广海湾海域潮位多峰特征及原因分析
Copy editor: 林强
收稿日期: 2025-03-15
修回日期: 2025-04-25
网络出版日期: 2025-05-09
基金资助
中交集团青年创新课题(2024-ZJKJ-QNCX28)
Multi-peak characteristics and cause analysis of tidal levels in Guanghai Bay
Received date: 2025-03-15
Revised date: 2025-04-25
Online published: 2025-05-09
Supported by
Youth Innovation Project of CCCC(2024-ZJKJ-QNCX28)
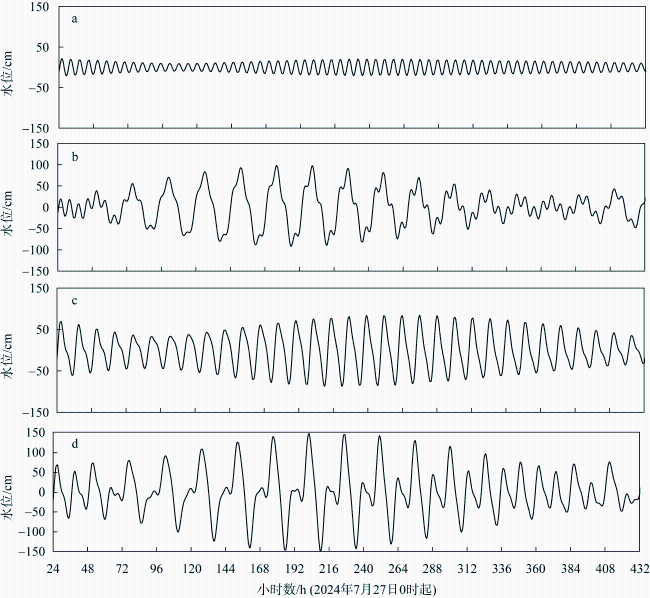
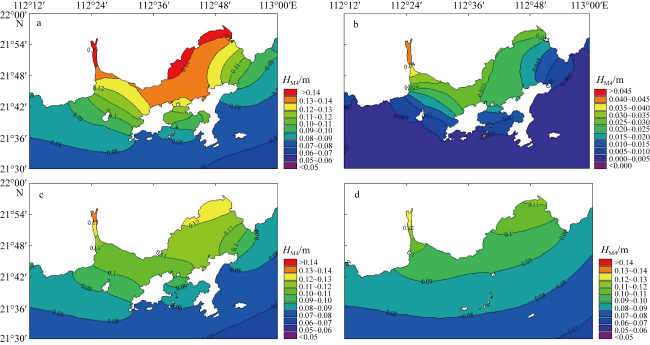
在2024年广海湾附近海域夏季潮位观测期间, 发现该海域存在低高潮多峰现象, 这种异常的潮位数据给工程应用造成一定困扰。作者通过潮位重构、理论分析和数值模拟等方法, 对造成多峰现象的原因进行了探讨。认为该海域的M4分潮的比重较大是主要原因, 其与全日分潮、半日分潮的共同作用, 导致了这种多峰现象。通过改变潮汐边界、近岸水深、地形等影响因素, 构建不同的数值模型, 探讨了M4分潮大振幅的原因。结果表明, 广海湾附近海域本底的M4分潮整体较大, 其与M2分潮的振幅比已经接近多峰现象的临界条件。而独特的岛屿和近岸浅水地形, 使广海湾浅海分潮的振幅进一步增大, 形成低高潮的多峰现象。该研究解释了该海域多峰潮位的原因, 为附近海域潮位在生态防护、航运和近岸工程等方面的应用提供了一定的理论支撑。
乔光全 , 徐润刚 . 广海湾海域潮位多峰特征及原因分析[J]. 热带海洋学报, 2025 , 44(6) : 12 -20 . DOI: 10.11978/2025044
During the summer tide observation near Guanghai Bay (GB) in 2024, it was found that there were multiple peaks during low-high tide periods in the area. This abnormal tidal characteristics have caused certain difficulties for engineering applications. The causes of this multi-peak phenomenon were explored through tidal level reconstruction, theoretical analysis, and numerical simulation. The main reason is believed to be the high proportion of quarter-diurnal tidal components in this sea area. The interaction among diurnal, semi-diurnal, and quarter-diurnal tidal components leads to this multi-peak occurrence. By modifying factors such as tidal boundaries, nearshore water depth, and topography, numerical models were constructed to explore the reasons for the large amplitude of M4 tidal component. The results indicate that the background amplitude of M4 tidal component near GB is generally large, with the amplitude ratio of M4/M2 approaching the critical condition for multi-peak phenomena. The unique island and nearshore shallow topography further increase the amplitude of shallow-water tidal components in GB, forming the observed multi-peak phenomenon at the low-high tide. The research explains the multi-peak tidal level phenomenon in this sea area and provides theoretical support for the application of tidal levels in ecological protection, navigation, and nearshore engineering in nearby waters.
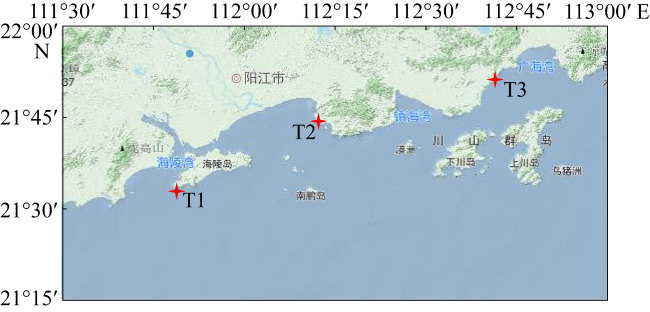
图1 潮位观测站位置示意图该图基于广东省标准地图服务网站下载的审图号为GS(2024) 0568-甲测资字44100039的标准地图制作, 底图无修改 Fig. 1 Schematic diagram of the location of the tidal observation stations |
表1 不同测点的调和常数Tab. 1 Tidal harmonic constants at different stations |
| 分潮 | T1 | T2 | T3 | |||
|---|---|---|---|---|---|---|
| 振幅/cm | 迟角/° | 振幅/cm | 迟角/° | 振幅/cm | 迟角/° | |
| Q1 | 8.5 | 148 | 8.5 | 143 | 8 | 141 |
| O1 | 40.8 | 151 | 40.2 | 148 | 38.2 | 145 |
| K1 | 47 | 191 | 45.9 | 188 | 44.7 | 185 |
| P1 | 14.9 | 186 | 14.6 | 183 | 14.1 | 180 |
| N2 | 12.6 | 60 | 11.7 | 53 | 11.3 | 51 |
| M2 | 62.6 | 64 | 59.7 | 58 | 55.8 | 54 |
| S2 | 32 | 94 | 29.8 | 88 | 27.2 | 83 |
| K2 | 9.1 | 97 | 8.5 | 91 | 7.7 | 86 |
| MN4 | 1.5 | 61 | 2.6 | 16 | 5.1 | 350 |
| M4 | 4.4 | 60 | 7.8 | 24 | 14.2 | 7 |
| MS4 | 2.6 | 149 | 4.1 | 104 | 8.8 | 78 |
| M6 | 0.6 | 221 | 0.6 | 9 | 2.8 | 94 |
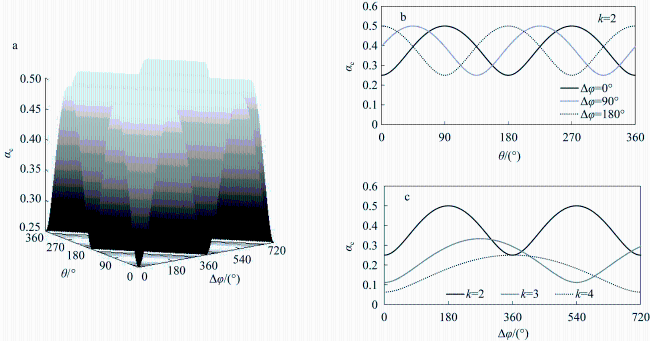
图4 临界振幅比${{\alpha }_{\text{c}}}$与迟角差$\Delta \phi $、母潮相位$\theta $的关系a. 三者关系; b.${{\alpha }_{\text{c}}}$与$\theta $的关系; c.${{\alpha }_{\text{c}}}$与$\Delta \phi $的关系 Fig. 4 The relationship between critical amplitude ratio ${{\alpha }_{\text{c}}}$, phase lag difference $\Delta \phi $, and parental tide phase $\theta $. (a) Relationship among the three; (b) relationship between ${{\alpha }_{\text{c}}}$ and $\theta $; (c) relationship between ${{\alpha }_{\text{c}}}$ and $\Delta \phi $ |
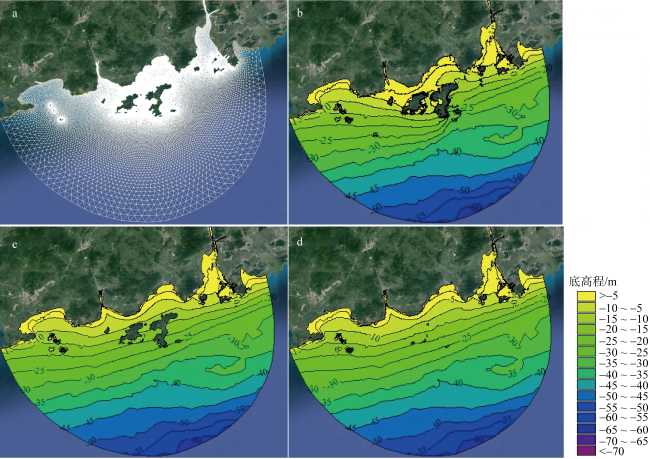
表2 不同算例参数表Tab. 2 Parameters for different cases |
| 边界分潮数量 | 地形 | 岛屿 | 节点数 | 网格数 | |
|---|---|---|---|---|---|
| 算例1 | 13个 | 自然地形 | 保留 | 41451 | 79956 |
| 算例2 | 9个(无浅水分潮) | 自然地形 | 保留 | ||
| 算例3 | 13个 | 等深线与海岸大致平行 | 保留 | ||
| 算例4 | 13个 | 等深线与海岸大致平行 | 取消 | 25603 | 49393 |
表3 调和常数验证结果Tab. 3 Verification results of harmonic constants |
| 分潮 | 振幅/cm | 迟角/° | ||||||||||
|---|---|---|---|---|---|---|---|---|---|---|---|---|
| T1 | T2 | T3 | T1 | T2 | T3 | |||||||
| 数模 | 误差 | 数模 | 误差 | 数模 | 误差 | 数模 | 误差 | 数模 | 误差 | 数模 | 误差 | |
| Q1 | 8.8 | 0.3 | 8.8 | 0.3 | 7.8 | -0.2 | 149 | 1 | 144 | 1 | 148 | 7 |
| O1 | 41.3 | 0.5 | 41.3 | 1.1 | 39.9 | 1.7 | 152 | 1 | 147 | -1 | 148 | 3 |
| K1 | 46.7 | -0.3 | 46.7 | 0.8 | 43.9 | -0.8 | 191 | 0 | 187 | -1 | 187 | 2 |
| P1 | 15.1 | 0.2 | 15.1 | 0.5 | 14.0 | -0.1 | 186 | 0 | 182 | -1 | 181 | 1 |
| N2 | 13.1 | 0.5 | 12.1 | 0.4 | 11.7 | 0.4 | 59 | -1 | 60 | 7 | 52 | 1 |
| M2 | 62.3 | -0.3 | 62.3 | 2.6 | 57.1 | 1.3 | 63 | -1 | 62 | 4 | 58 | 4 |
| S2 | 33.0 | 1.8 | 31.8 | 2.0 | 26.9 | -0.3 | 93 | -1 | 91 | 3 | 81 | -2 |
| K2 | 10.0 | 0.9 | 10.0 | 1.5 | 7.9 | 0.2 | 96 | -1 | 93 | 2 | 84 | -2 |
| MN4 | 1.9 | 0.4 | 3.1 | 0.5 | 4.9 | -0.2 | 59 | -2 | 22 | 6 | 354 | 4 |
| M4 | 5.0 | 0.6 | 8.5 | 0.7 | 14.5 | 0.3 | 61 | 1 | 23 | -1 | 358 | -9 |
| MS4 | 2.6 | 0.0 | 4.4 | 0.3 | 7.0 | -1.8 | 151 | 2 | 110 | 6 | 83 | 5 |
| M6 | 0.6 | 0.0 | 1.5 | 0.9 | 3.1 | 0.3 | 223 | 2 | 9 | 0 | 97 | 3 |
| [1] |
陈宜展, 曹永港, 罗士浩, 等, 2022. 粤西阳江海域春夏季沿岸激流现象及机理分析[J]. 海洋学报, 44(11): 1-11.
|
| [2] |
成印河, 梁广建, 朱凤芹, 等, 2017. 粤西沿岸海域潮汐特征[J]. 海洋科学, 41(6): 111-118.
|
| [3] |
刁希梁, 丁扬, 鲍献文, 2017. 大亚湾海域潮位“双峰”现象生成机制研究[J]. 中国海洋大学学报(自然科学版), 47(9): 1-10.
|
| [4] |
国家海洋信息中心, 2023. 潮汐表(2024年, 第3册)[M]. 天津: 天津科学技术出版社: 1-445 (in Chinese).
|
| [5] |
李孟国, 郑敬云, 2007. 中国海域潮汐预报软件Chinatide的应用[J]. 水道港口, 28(1): 65-68.
|
| [6] |
李嵩, 管卫兵, 曹振轶, 等, 2020. 大亚湾和大鹏湾两个相邻海湾潮波浅水变形的异同分析[J]. 海洋学研究, 38(3): 31-47.
|
| [7] |
彭帅星, 朱佳, 陈照章, 等, 2021. 大亚湾双峰水位的形成条件及准调和分量应用的分析[J]. 厦门大学学报(自然科学版), 60(5): 937-944.
|
| [8] |
王延强, 仉天宇, 朱学明, 2014. 基于18. 6年卫星高度计资料对南海潮汐的分析与研究[J]. 海洋预报, 31(2): 35-40.
|
| [9] |
武文, 严聿晗, 宋德海, 2017. 大亚湾的潮汐动力学研究——I. 潮波系统的观测分析与数值模拟[J]. 热带海洋学报, 36(3): 34-45.
|
| [10] |
夏综万, 廖世智, 冯砚青, 2013. 粤东甲子海域潮波异常和南海北部潮波的传播[J]. 海洋学报, 35(1): 1-8.
|
| [11] |
严聿晗, 武文, 宋德海, 等, 2017. 大亚湾的潮汐动力学研究——Ⅱ. 潮位和潮流双峰现象的产生机制[J]. 热带海洋学报, 36(3): 46-54.
|
| [12] |
|
| [13] |
|
| [14] |
|
/
| 〈 |
|
〉 |