
基于航次观测和再分析资料的南海海表二氧化碳分压反演及变化机制分析*
|
邱爽(1992—), 女, 北京人, 博士研究生, 主要从事海洋动力过程与环境效应研究。email: |
Copy editor: 姚衍桃
收稿日期: 2021-03-04
修回日期: 2021-04-08
网络出版日期: 2021-04-29
基金资助
中国科学院战略性先导科技专项(XDA13010404)
国家自然科学基金(41806146)
国家自然科学基金(41976024)
国家自然科学基金(41830538)
南方海洋科学与工程广东省实验室( 广州) 重大专项团队项目(GML2019ZD0302)
南方海洋科学与工程广东省实验室( 广州) 重大专项团队项目(GML2019ZD0303)
“广东特支计划”本土创新创业团队(2019BT02H594)
Multi-linear regression of partial pressure of sea-surface carbon dioxide in the South China Sea and its mechanism
Copy editor: YAO Yantao
Received date: 2021-03-04
Revised date: 2021-04-08
Online published: 2021-04-29
Supported by
Strategic Priority Research Program of the Chinese Academy of Sciences(XDA13010404)
National Natural Science Foundation of China(41806146)
National Natural Science Foundation of China(41976024)
National Natural Science Foundation of China(41830538)
Key Special Project for Introduced Talents Team of Southern Marine Science and Engineering Guangdong Laboratory (Guangzhou)(GML2019ZD0302)
Key Special Project for Introduced Talents Team of Southern Marine Science and Engineering Guangdong Laboratory (Guangzhou)(GML2019ZD0303)
“Guangdong TeZhi Plan” Local Innovation and Entrepreneurship Team(2019BT02H594)
海表二氧化碳分压(pCO2)是指海洋表层水和大气之间的二氧化碳(CO2)交换处于动态平衡时CO2的含量, 是描述海-气CO2交换的一个主要因子。本文利用2008—2014年覆盖南海大部分海域的海表pCO2观测资料, 结合现场海表温度和海表盐度以及卫星观测的叶绿素a数据, 构建了基于多元线性回归方法的分区域反演模型。模型在水深浅于30m的区域均方根误差为5.3μatm, 其余海区均方根误差为10.8μatm, 与前人基于个别航次的有限区域反演结果的均方根误差相当。利用该模型公式和HYbrid Coordinate Ocean Model(HYCOM)再分析海表温、盐数据及MODIS-Aqua卫星观测的叶绿素a数据进行反演, 得到了时空分辨率为5'×5'的2004—2016年的逐月南海海表pCO2数据。该数据能较好地反映南海海表pCO2在海表温度影响下, 春夏高、秋冬低的季节变化特征, 与前人基于航次观测的研究结果相似, 表明反演模型具有较高的可信度。进一步分析发现, 南海及邻近海域平均海表pCO2具有显著的准十年振荡特征: 2012年附近出现了极小值, 之前表现为降低的趋势, 之后略有升高的趋势。受海表pCO2的影响, 南海海盆平均海-气CO2通量在2012年之前出现了显著降低的趋势, 表明南海释放到大气中的CO2减少, 并在2007年之后的冬季出现了负值(从碳源变为碳汇), 2012年之后变化较为平缓。热带太平洋年代际振荡引起的南海区域海表盐度变化是造成海表pCO2及海-气CO2通量准十年变化的主要原因。分区分析的结果表明, 南海北部海表pCO2变化最为显著, 在南海海表pCO2的季节和准十年变化中都起到非常重要的作用。
邱爽 , 叶海军 , 张玉红 , 唐世林 . 基于航次观测和再分析资料的南海海表二氧化碳分压反演及变化机制分析*[J]. 热带海洋学报, 2022 , 41(1) : 106 -116 . DOI: 10.11978/2021030
The partial pressure of carbon dioxide (pCO2) refers to the content of CO2 gas at the sea surface when the CO2 exchange between the sea surface and atmosphere is in dynamic equilibrium, which is an important factor to calculate air-sea CO2 flux. Based on the observations of pCO2 covering most of the South China Sea (SCS) from 2008 to 2014, combined with in-situ observations of sea-surface temperature (SST), sea-surface salinity (SSS) and Modis-Aqua satellite observations of chlorophyll a (Chla), we construct a regional inversion of sea-surface pCO2 based on a multi-linear regression method. The root mean square error is estimated to be 5.3 μatm in the area with depth shallower than 30 m, and 10.8 μatm in the remaining sea area, which are consistent with previous results based on cruise observations. Using the equation acquired from our method and combining with the HYbrid Coordinate Ocean Model (HYCOM) reanalysis SST and SSS data and MODIS-Aqua remote sensing Chla data, we obtained monthly sea-surface pCO2 of the SCS from 2004 to 2016 with spatial resolution of 5'×5'. The data can well reflect the seasonal variation of sea-surface pCO2 in the SCS under the influence of SST, which is high in spring and summer, and low in autumn and winter. These findings are similar to previous results based on cruise observations, indicating our method has rather high reliability. Further analysis shows the average sea-surface pCO2 of the SCS and adjacent sea areas has a significant quasi-decadal oscillation: a minimum value appeared around 2011, which first showed a decreasing trend and then an increasing trend. Due to the influence of sea-surface pCO2, the average air-sea CO2 flux in the SCS and adjacent areas decreased significantly before 2012, and changed into negative values during winter, then changed slowly since 2012. The variation of SSS in the SCS caused by the Pacific Decadal Oscillation is the main reason for the quasi-decadal oscillation of sea-surface pCO2 and air-sea CO2 fluxes. Our results indicate the variation of sea-surface pCO2 in the northern SCS is the most significant, which plays an important role in the seasonal and quasi-decadal oscillation of pCO2 in the whole area.
表1 2010—2014年国家基金委共享航次获得的南海海表层pCO2资料统计Tab. 1 Information of sea-surface pCO2 observations in the South China Sea |
| 年份 | 仪器 | 月份 | 原始数据量/组 |
|---|---|---|---|
| 2008 | PMEL | 9、10、12 | 1634 |
| 2009 | PMEL | 1 | 223 |
| 2010 | GO-8050 | 9 | 5187 |
| 2011 | GO-8050 | 4、5 | 6445 |
| 2012 | GO-8050 | 10 | 2519 |
| 2013 | GO-8050 | 3、5 | 3246 |
| 2014 | GO-8050 | 4、5 | 8952 |
| 合计 | / | / | 28206 |
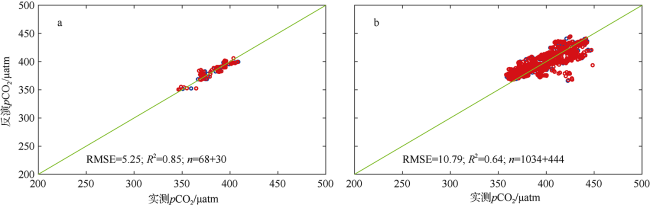
图2 多元线性回归pCO2结果与pCO2观测结果的比较a. 浅水区(水深≤30m); b. 深水区(水深>30m)。红色圆圈代表模型构建数据, 蓝色圆圈代表模型验证数据 Fig. 2 Comparison of multi-linear regression pCO2 results and in-situ pCO2 observations. (a) Water depth less than 30 m; (b) deeper than 30 m. The red circle represents the model construction, and the blue circle represents the model validation |
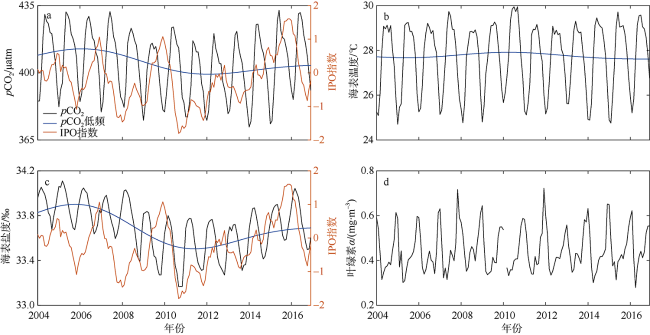
图4 南海海表pCO2(a)、海表温度(b)、海表盐度(c)和叶绿素a(d)的时间序列图a Time series of sea-surface pCO2 (a), SST (b), sea-surface salinity (c) and chlorophyll a (d). (a) and (c) are superposed with the Pacific Interdecadal Oscillation (IPO) index. The black line is the original data, the blue line is the low-frequency result (after applying a 7-year low-pass filter), and the brown line is the IPO index |
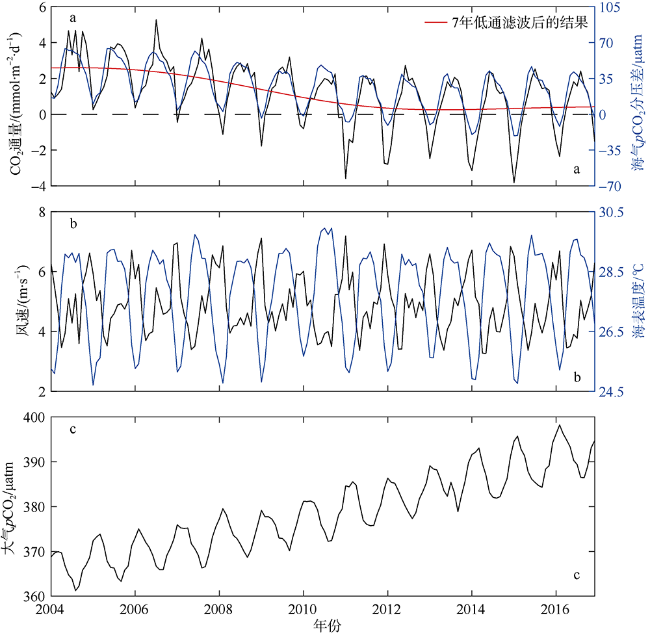
图6 南海及邻近海域的海-气CO2通量及海-气CO2分压差(a)、风速与海表温度(b)和大气pCO2(c)的准十年振荡Fig. 6 Quasi-decadal variabilities of air-sea CO2 flux and ΔpCO2 (a), wind speed and SST (b), and atmospheric pCO2 (c) in the South China Sea and adjacent waters. The red dotted line indicates the air-sea CO2 flux after applying a 7-year low-pass filter |
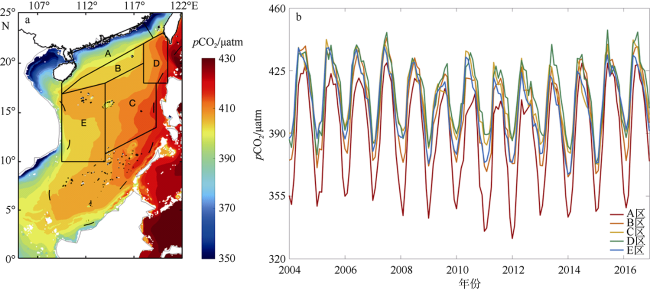
图7 南海海表pCO2气候态月平均和分区(a)以及各分区平均的pCO2时间序列(b)图a Sea-surface pCO2 climatology in five South China Sea sub domains. (a) climatological monthly average of pCO2 in the South China Sea with the 5 domains indicated by the area of black lines according to Li et al. (2020); (b) the average pCO2 time series of each domain |
*感谢HYCOM模式再分析资料提供海表温、盐数据,感谢OceanColor网站提供高分辨率叶绿素数据下载,感谢参与数据采集的人员和相关航次工作人员。
| [1] |
陈海花, 李洪平, 何林洁, 等, 2015. 基于SODA数据集的南海海表面盐度分布特征与长期变化趋势分析[J]. 海洋技术学报, 34(4): 48-52.
|
| [2] |
傅圆圆, 程旭华, 张玉红, 等, 2017. 近二十年南海表层海水的盐度淡化及其机制[J]. 热带海洋学报, 36(4): 18-24.
|
| [3] |
韩玉康, 周林, 吴炎成, 2016. 基于HYCOM的南海中尺度涡数值模拟[J]. 海洋通报, 35(3): 299-316.
|
| [4] |
姜亦飞, 王辉, 乔然, 等, 2014. 南海东北部春季海表pCO2分布及海-气CO2通量[J]. 海洋学报, 36(6): 18-24.
|
| [5] |
吕航宇, 白雁, 李骞, 等, 2018. 夏季珠江口海域海水CO2分压的卫星遥感反演[J]. 海洋学研究, 36(2): 1-11.
|
| [6] |
邱春华, 贾英来, 2009. 南海北部深水海域温度以及盐度的季节及年际变化特征[J]. 中国海洋大学学报, 39(3): 375-380, 386.
|
| [7] |
王静, 赵飞达, 齐义泉, 2015. 夏末秋初南海18°N断面混合层结构特征分析[J]. 海洋通报, 34(1): 52-58.
|
| [8] |
许欣, 于培松, 蔡小霞, 等, 2016. 南海西部秋季海表$p_{{CO}_{2}}$分布与海气CO2通量[J]. 热带海洋学报, 35(3): 55-64.
|
| [9] |
翟惟东, 2015. 南海北部春季非水华期的CO2分压及其调控[J]. 海洋学报, 37(6): 31-40.
|
| [10] |
|
| [11] |
|
| [12] |
|
| [13] |
|
| [14] |
|
| [15] |
|
| [16] |
|
| [17] |
|
| [18] |
|
| [19] |
|
| [20] |
|
| [21] |
|
| [22] |
|
| [23] |
|
| [24] |
|
| [25] |
|
| [26] |
|
| [27] |
|
| [28] |
|
| [29] |
|
| [30] |
|
| [31] |
|
| [32] |
|
| [33] |
|
| [34] |
|
| [35] |
|
| [36] |
|
| [37] |
|
| [38] |
|
| [39] |
|
/
| 〈 |
|
〉 |


