
长江口咸潮入侵格局变化及其成因
|
裘诚(1987—), 男, 上海市人, 高级工程师, 从事河口海岸学研究。email: dieohacker@aliyun.com |
Editor: 殷波
收稿日期: 2025-07-14
修回日期: 2025-07-24
网络出版日期: 2025-07-28
基金资助
上海市科委重点项目(23DZ1203002)
国家自然科学基金项目(U2340225)
国家自然科学基金项目(42276174)
Changes and causes of saltwater intrusion patterns in the Changjiang Estuary
Editor: YIN Bo
Received date: 2025-07-14
Revised date: 2025-07-24
Online published: 2025-07-28
Supported by
Science and Technology Commission of Shanghai Municipality(23DZ1203002)
National Natural Science Foundation of China(U2340225)
National Natural Science Foundation of China(42276174)
2007—2021年长江口重大圈围工程导致河道缩窄, 显著改变局部地形。文章利用2007—2025年的实测地形和盐度资料, 分析期间长江口河势变化和咸潮入侵格局变化, 并利用数值模式揭示格局变化的成因。由于工程致使长江口北支下段南侧发生严重淤积, 北支上端出现新生沙体, 导致北支下段和上端2021年的河槽容积比2007年分别减小了33.33%和13.26%。2007年和2025年枯季盐度观测资料表明, 北支咸潮入侵和北支盐水倒灌显著减弱, 而北港咸潮入侵在气候态风时减弱、强北风时加剧。月平均径流量和风作用的数值模拟结果表明, 从2007年至2021年, 咸潮入侵在北支大幅减弱, 在北港上段和中段大部分区域减弱, 在南港、北槽和南槽显著加剧; 北支盐水倒灌大幅减弱导致南支咸潮入侵减弱。2021年与2007年相比: 北支2月大潮、小潮期间纳潮量分别减小了2.88×10⁸m3、1.98×10⁸m3, 进入南支的净水通量分别减小了423m3·s-1、369m3·s-1, 盐分倒灌的净盐通量分别减小了10.06kg·s-1、1.10kg·s-1; 北支上段净单宽盐通量变化也说明北支盐分向南支输运大幅减小; 2007年北支盐水倒灌显著, 2021年几乎消失。北港2月大潮、小潮期间纳潮量分别减小了1.92×10⁸m3、1.86×10⁸m3, 净水通量分别增加了857m3·s-1、1379m3·s-1, 分流比分别增加了12.79%、7.79%, 向海的净盐通量减小了2.28kg·s-1、5.42kg·s-1。这些因素的变化解释了北港上段和中段大部分区域咸潮入侵减弱的原因。北港分流比的明显增加和相应的南港分流比减小说明了南港、北槽和南槽咸潮入侵加剧的成因。北港中段大潮期间小部分区域盐度上升是由横沙小港净盐通量从北槽向北港输运显著增加造成的。
裘诚 , 朱宜平 , 朱建荣 . 长江口咸潮入侵格局变化及其成因[J]. 热带海洋学报, 2026 , 45(2) : 42 -58 . DOI: 10.11978/2025104
Studying changes in estuarine saltwater intrusion patterns can deepen the understanding of its mechanism and help better ensure the safe use of freshwater resources. Based on measured topographic and salinity data, this paper analyzes changes in river regime and saltwater intrusion patterns in the Changjiang Estuary. A numerical model is used to reveal the causes of these pattern changes. From 2007 to 2021, major reclamation projects in the estuary led to channel narrowing and significant local topographic changes. Due to severe siltation on the south side of the lower North Branch and the emergence of a new sand body at its upper end, the channel volume decreased by 33.33% and 13.26% (with the negative sign denoting northward transport from the south), respectively. Salinity observations in the dry seasons of 2007 and 2025 indicate a significant weakening of saltwater intrusion and of the North Branch saltwater backflow into the South Branch. In the North Channel, saltwater intrusion weakened under prevailing climatic winds but intensified under strong northerly winds. Overall, the saltwater intrusion pattern in the Changjiang Estuary has changed. Numerical simulations, considering multi-year monthly mean river discharge and wind, show that from 2007 to 2021, saltwater intrusion weakened significantly in the North Branch, weakened in the upper and most middle reaches of the North Channel, but intensified significantly in the South Channel, North Passage, and South Passage. The saltwater backflow from the North Branch into the South Branch was greatly reduced, resulting in weakened saltwater intrusion in the South Branch, which is conducive to water intakes at source areas. In the North Branch, the tidal prism decreased by 2.88×10⁸ m3 and 1.98×10⁸ m3 during spring and neap tides in February, respectively. The net water flux into the South Branch decreased by 423 m3·s-1 and 369 m3·s-1, and the net salt flux into the South Branch decreased by 10.06 kg·s-1 and 1.10 kg·s-1. The variation of net unit-width salt flux in the upper North Branch also indicates a major reduction in salt transport to the South Branch. Significant North Branch backflow observed in 2007 had nearly disappeared by 2021. In the North Channel, during February spring and neap tides, the tidal prism decreased by 1.92×10⁸ m3 and 1.86×10⁸ m3, while the net water flux increased by 857 m3·s-1 and 1379 m3·s-1. The water diversion ratio increased by 12.79% and 7.79%, and the net seaward salt flux decreased by 2.28 kg·s-1 and 5.42 kg·s-1. These changes explain the weakening of saltwater intrusion in the upper and most middle reaches of the North Channel. The obvious increase in the North Channel’s water diversion ratio (corresponding to a decrease in the South Channel’s ratio) also accounts for the intensification of saltwater intrusion in the South Channel, North Passage, and South Passage. A localized salinity rise in a small part of the North Channel during spring tide is caused by a significant increase in the net salt flux from the North Passage into the North Channel. This paper reveals the hydrodynamic causes of the changing saltwater intrusion pattern in the Changjiang Estuary through changes in net water flux, net salt flux, tidal prism, and water diversion ratio.
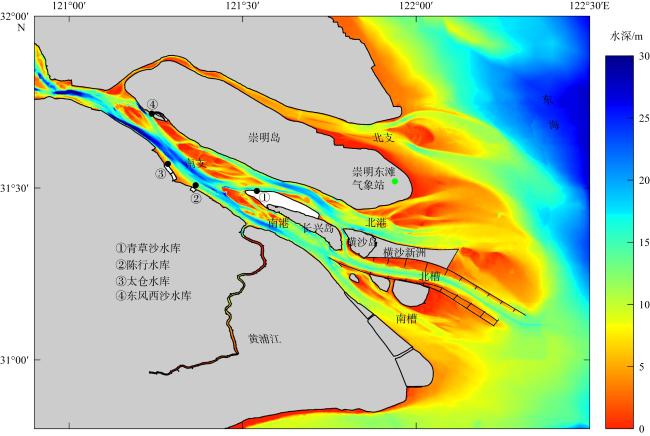
图1 长江口形势图该图基于自然资源部标准地图服务网站下载的审图号为GS(2019)3266号的标准地图制作, 底图无修改。图中绿点为崇明东滩气象站; 黑点为水库取水口; 白色部分为水库区域; 北槽南北两侧的刻度线为导堤的丁坝 Fig. 1 Sketch map of the Changjiang Estuary. The green dot in the figure indicates the position of Chongming Dongtan (eastern shoal) meteorological station; black dots indicate the water intakes of reservoirs |
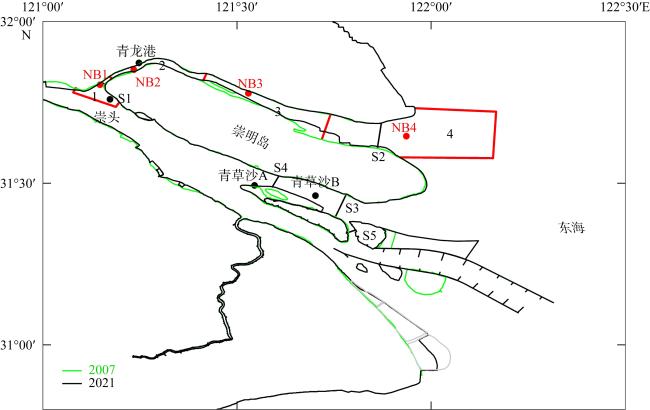
图2 长江口2007年和2021年岸线该图基于自然资源部标准地图服务网站下载的审图号为GS(2019)3266号的标准地图制作, 底图无修改。图中黑点为青龙港、崇头、青草沙A、青草沙B测站; 红点为北支模式输出点NB1、NB2、NB3、NB4; 红线将北支划分为区域1、区域2、区域3和区域4; S1、S2为北支上段、下段横断面; S3、S4为北港中段、上段横断面; S5为横沙小港横断面 Fig. 2 Shorelines of the Changjiang Estuary in 2007 and 2021. The black dots in the figure represent the measuring stations; the red dots represent the model output points in the North Branch; the red lines divide the North Branch into four areas. S1 and S2 are the transects of the upper and lower reaches of the North Branch; S3 and S4 are the transects of the middle and upper reaches of the North Channel; S5 is the transect in the Hengsha Channel |
表1 长江口北支各区域河槽表面积变化(单位: m2)Tab. 1 Changes in channel surface area in various regions of the North Branch of the Changjiang Estuary (unit: m2) |
| 年份 | 区域1 | 区域2 | 区域3 | 区域4 |
|---|---|---|---|---|
| 2007 | 4.16×10⁷ | 4.31×10⁷ | 1.34×10⁸ | 5.33×10⁸ |
| 2021 | 3.99×10⁷ | 4.09×10⁷ | 1.03×10⁸ | 5.12×10⁸ |
| 变化率 | -4.26% | -5.38% | -30.10% | -4.10% |
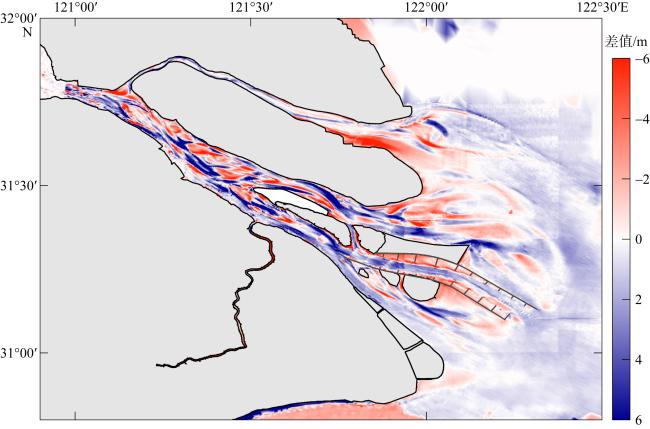
图3 2007年至2021年长江口水深变化该图基于自然资源部标准地图服务网站下载的审图号为GS(2019)3266号的标准地图制作, 底图无修改。红色表示淤积; 蓝色表示侵蚀 Fig. 3 Changes in the depth of the Changjiang Estuary from 2007 to 2021. Red indicates deposition; blue indicates erosion |
表2 长江口北支各区域河槽容积变化(单位: m3)Tab. 2 Changes in river channel volume in different areas of the North Branch of the Changjiang Estuary (unit: m3) |
| 年份 | 区域1 | 区域2 | 区域3 | 区域4 |
|---|---|---|---|---|
| 2007 | 2.72×10⁸ | 1.16×10⁸ | 4.99×10⁸ | 3.16×10⁹ |
| 2021 | 2.04×10⁸ | 1.47×10⁸ | 4.45×10⁸ | 2.79×10⁹ |
| 变化率 | -33.33 % | +21.09 % | -12.13 % | -13.26 % |
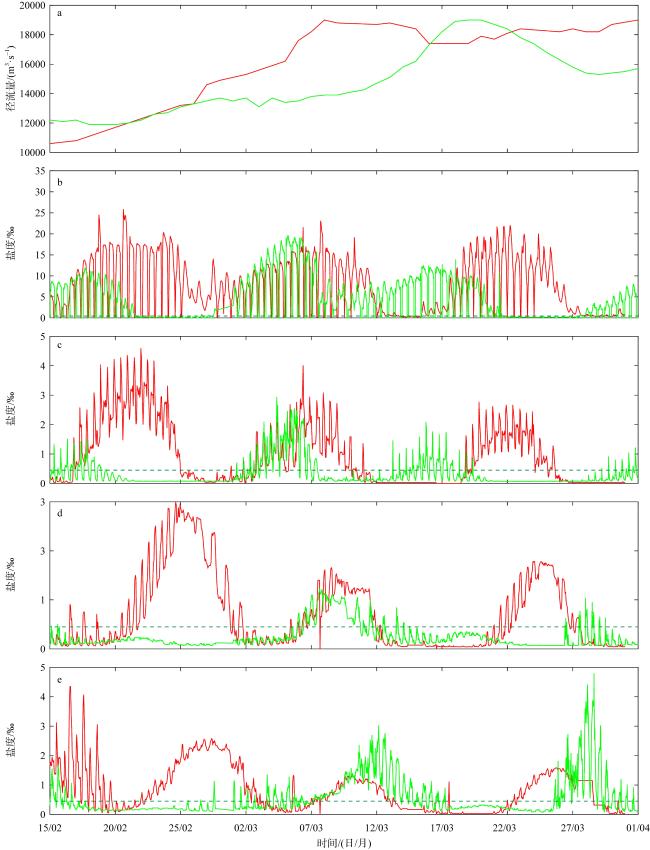
图4 2月15日—3月31日大通实测径流量(a)和青龙港(b)、崇头(c)、青草沙A (d)、青草沙B (e)测站表层盐度随时间变化曲线图中红线为2007年; 绿线为2025年。图中虚线表示盐度0.45‰, 为饮用水盐度标准 Fig. 4 Temporal variation in the measured river discharge at Datong Station (a), and surface salinity at measuring stations Qinglonggang (b), Chongtou (c), Qingcaosha A (d), and Qingcaosha B (e), from February 15 to March 31. The red line represents 2007, and the green line represents 2025 |
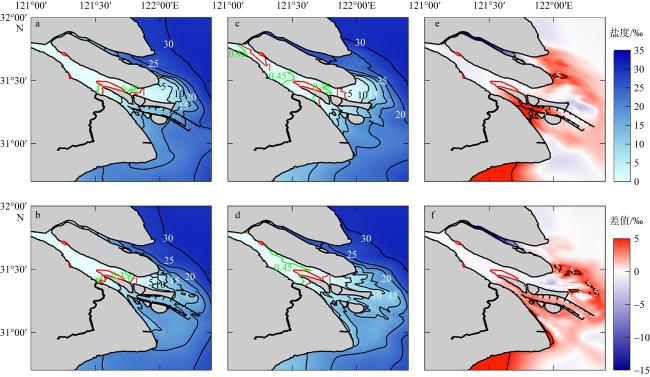
图6 2021年与2007年2月大潮和小潮期间的潮周期和垂向平均盐度分布以及2021年与2007年潮周期和垂向平均盐度差值分布a. 2021年2月大潮; b. 2021年2月小潮; c. 2007年2月大潮; d. 2007年2月小潮; e. 2021年与2007年2月大潮盐度差值; f. 2021年与2007年2月小潮盐度差值。该图基于自然资源部标准地图服务网站下载的审图号为GS(2019)3266号的标准地图制作, 底图无修改 Fig. 6 Distribution of tidal-period and vertically averaged salinity during spring tide (a, c, e) and neap tide (b, d, f) in February 2021 (a, b) and 2007 (c, d), as well as the distribution of differences in tidal-period and vertically averaged salinity between 2021 and 2007 (e, f) |
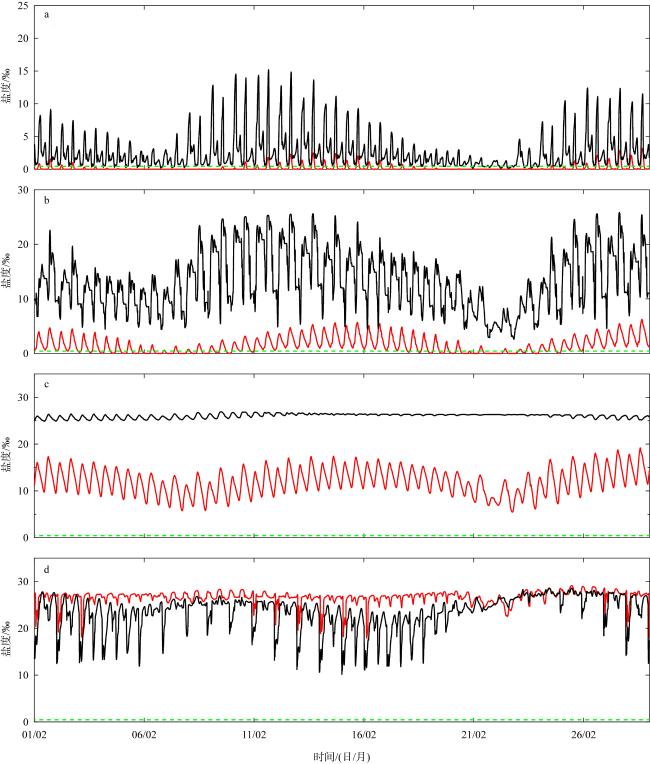
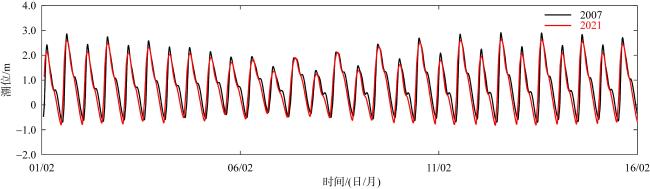
图7 NB1 (a)、NB2 (b)、NB3 (c)和NB4 (d)输出点表层盐度随时间变化图中红线为2021年; 黑线为2007年。绿色虚线表示盐度0.45‰ Fig. 7 Temporal variations of surface salinity at the output points of NB1 (a), NB2 (b), NB3 (c), and NB4 (d). The red line represents 2021; the black line represents 2007. The green dashed line indicates a salinity of 0.45‰ |
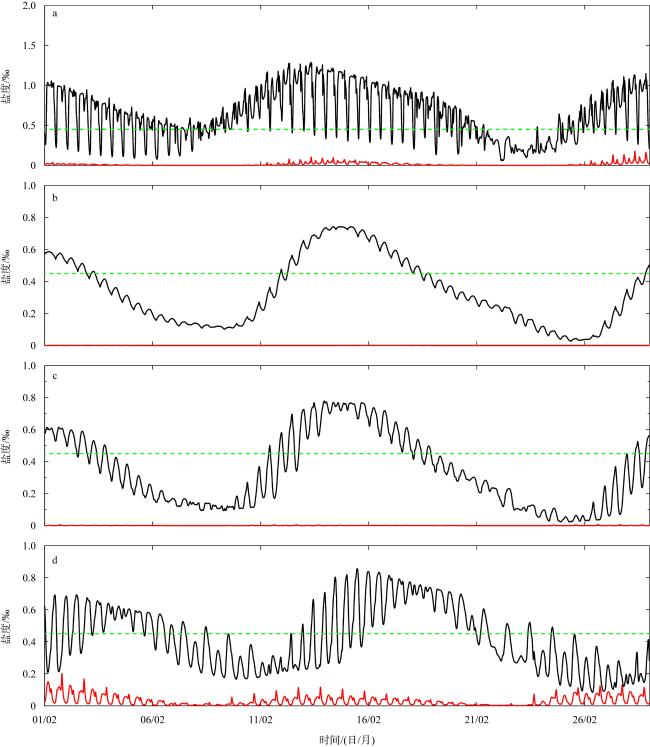
图8 东风西沙水库(a)、太仓水库(b)、陈行水库(c)和青草沙水库(d)取水口表层盐度随时间变化图中红线为2021年; 黑线为2007年。绿色虚线表示盐度0.45‰ Fig. 8 Temporal variations of surface salinity at the water intake of Dongfeng Xisha Reservoir (a), Taicang Reservoir (b), Chenhang Reservoir (c), and Qingcaosha Reservoir (d). The red line represents the year 2021 and the black line represents the year 2007. The green dashed line indicates the salinity threshold |
表3 2007年和2021年2月份大潮、大潮后中潮、小潮、小潮后中潮和全潮期间通过北支横断面S1的净水通量、净盐通量和分流比Tab. 3 Net water flux, net salt flux and water diversion ratio across the North Branch transect S1 during spring tide, middle tide after spring tide, neap tide, middle tide after neap tide and the whole tidal cycles in February 2007 and 2021 |
| 统计时段 | 净水通量/(m3·s-1) | 净盐通量/(kg·s-1) | 分流比/% | |||
|---|---|---|---|---|---|---|
| 2021年 | 2007年 | 2021年 | 2007年 | 2021年 | 2007年 | |
| 大潮 | 49 | -374 | -0.01 | -10.07 | 0.41 | -3.07 |
| 大潮后中潮 | 249 | -226 | 0.00 | -5.56 | 1.77 | -1.68 |
| 小潮 | 445 | 76 | 0.00 | -1.10 | 3.03 | 0.55 |
| 小潮后中潮 | -2 | -446 | 0.00 | -9.02 | -0.02 | -4.06 |
| 全潮 | 173 | -224 | 0.00 | -5.94 | 1.36 | -1.81 |
注: 负号代表涨潮方向 |
表4 2007年和2021年河势下通过北支横断面S2和北港横断面S3大潮、大潮后中潮、小潮、小潮后中潮和全潮期间纳潮量(单位: ×108m3)Tab. 4 Tidal prism during spring tide, middle tide after spring tide, neap tide, middle tide after neap tide and the full tidal cycles across the transect S2 in the North Branch and transect S3 in the North Channel in February under the river regime conditions of 2007 and 2021 (unit: ×108m3) |
| 统计时段 | 北支 | 北港 | ||
|---|---|---|---|---|
| 2007 | 2021 | 2007 | 2021 | |
| 大潮 | 9.82 | 6.94 | 16.51 | 14.59 |
| 大潮后中潮 | 8.11 | 5.52 | 13.29 | 11.48 |
| 小潮 | 5.44 | 3.46 | 10.56 | 8.70 |
| 小潮后中潮 | 8.80 | 6.45 | 15.54 | 13.71 |
| 全潮 | 6.63 | 4.43 | 10.28 | 8.93 |
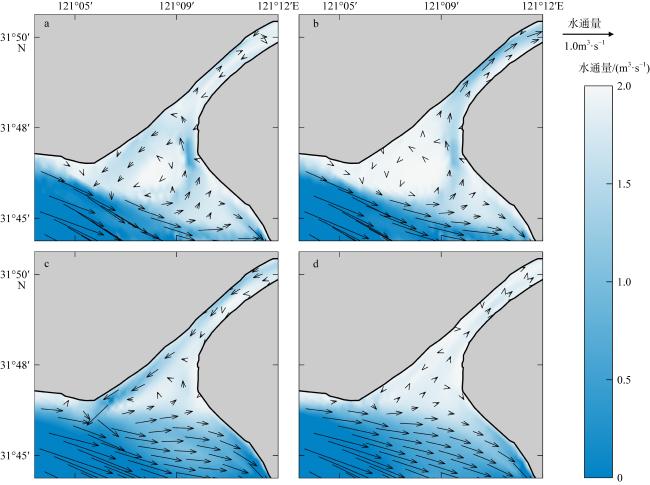
图10 2021年(a、b)和2007年(c、d)2月大潮期间(a、c)和小潮期间(b、d)北支上端区域单宽水通量平面分布该图基于自然资源部标准地图服务网站下载的审图号为GS(2019)3266号的标准地图制作, 底图无修改 Fig. 10 Planar distribution of net unit-width water flux in the upper region of the North Branch during spring tide (a, c) and neap tide (b, d) in February of 2021 (a, b) and 2007 (c, d) |
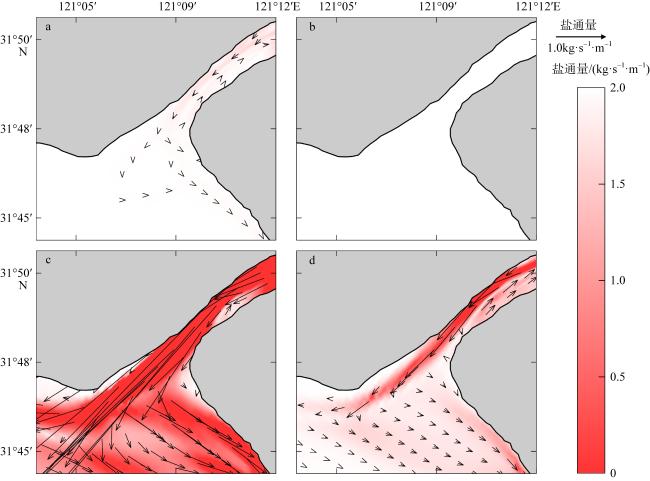
图11 2021年(a、b)和2007年(c、d) 2月大潮期间(a、c)和小潮期间(b、d)北支上端区域单宽盐通量平面分布该图基于自然资源部标准地图服务网站下载的审图号为GS(2019)3266号的标准地图制作, 底图无修改 Fig. 11 Planar distribution of net unit-width salt flux in the upper region of the North Branch during spring tide (a, c) and neap tide (b, d) in February of 2021 (a, b) and 2007 (c, d) |
表5 2007年和2021年2月份大潮、大潮后中潮、小潮、小潮后中潮和全潮期间通过北港横断面S4的净水通量、净盐通量和分流比Tab. 5 Net water flux, net salt flux and water diversion ratio across the North Channel transect S4 during spring tide, middle tide after spring tide, neap tide, middle tide after neap tide and the full tidal cycles in February 2007 and 2021 |
| 统计时段 | 净水通量/(m3·s-1) | 净盐通量/(kg·s-1) | 分流比/% | |||
|---|---|---|---|---|---|---|
| 2021 | 2007 | 2021 | 2007 | 2021 | 2007 | |
| 大潮 | 8611 | 7754 | 0.18 | 2.46 | 73.53 | 60.74 |
| 大潮后中潮 | 10118 | 8759 | 0.18 | 7.03 | 70.50 | 60.55 |
| 小潮 | 10938 | 9559 | 0.09 | 5.51 | 69.40 | 61.61 |
| 小潮后中潮 | 5708 | 5567 | 0.17 | 1.46 | 63.52 | 55.22 |
| 全潮 | 8693 | 7660 | 0.16 | 4.11 | 68.74 | 58.90 |
表6 2007年和2021年2月份大潮、大潮后中潮、小潮、小潮后中潮和全潮期间通过横沙通道横断面S5的净水通量和净盐通量Tab. 6 Net water flux and net salt flux across the transect S5 of Hengsha Channel during spring tide, middle tide after spring tide, neap tide, middle tide after neap tide and the full tidal cycles in February 2007 and 2021 |
| 统计时段 | 净水通量/(m3·s-1) | 净盐通量/(kg·s-1) | ||
|---|---|---|---|---|
| 2021 | 2007 | 2021 | 2007 | |
| 大潮 | -2041 | -393 | -17.65 | -2.84 |
| 大潮后中潮 | -1859 | -94 | -15.69 | -2.07 |
| 小潮 | -1122 | -412 | -11.19 | -4.24 |
| 小潮后中潮 | -1367 | -230 | -10.62 | -3.62 |
| 全潮 | -1566 | -226 | -13.59 | -2.99 |
注: 负号表示净水通量或者净盐通量从南港向北港输运 |
| [1] |
陈泾, 朱建荣, 2014. 长江河口青草沙水库盐水入侵来源[J]. 海洋学报(中文版), 36(11): 131-141.
|
| [2] |
顾靖华, 朱建荣, 裘诚, 等, 2021. 长江河口盐水入侵长期演变分析[J]. 华东师范大学学报(自然科学版), (6): 174-186.
|
| [3] |
海洋图集编委会, 1992. 渤海黄海东海海洋图集(水文)[M]. 北京:海洋出版社:13-168.
EDITORIAL BOARD FOR MARINE ATLAS, 1992. Ocean atlas in Huanghai Sea and East China Sea (Hydrology)[M]. Beijing: China Ocean Press: 13-168 (in Chinese).
|
| [4] |
韩乃斌, 1983. 长江口南支河段氯度变化分析[J]. 水利水运科学研究, (1): 74-81.
|
| [5] |
李林江, 朱建荣, 2021. 冬季北风风速对长江河口盐水入侵的影响[J]. 海洋学报, 43(10): 10-22.
|
| [6] |
李林江, 朱建荣, 2015. 长江口南汇边滩围垦工程对流场和盐水入侵的影响[J]. 华东师范大学学报(自然科学版), (4): 77-86.
|
| [7] |
李志鹏, 朱建荣, 2022. 2007—2016年北支河势变化对长江口盐水入侵影响数值研究[J]. 华东师范大学学报(自然科学版), (3): 109-124.
|
| [8] |
陆佳玉, 葛建忠, 丁平兴, 2020. 潮控型分汊河口分流过程探讨: 以长江北支口为例[J]. 华东师范大学学报(自然科学版), (3): 1-12.
|
| [9] |
仇威, 朱建荣, 2023. 持续强北风天气下长江口盐水入侵对径流量的响应[J]. 华东师范大学学报(自然科学版), (3): 132-146.
|
| [10] |
沈焕庭, 茅志昌, 谷国传, 等, 1980. 长江口盐水入侵的初步研究—兼谈南水北调[J]. 人民长江, 11(3): 20-26.
|
| [11] |
沈焕庭, 茅志昌, 朱建荣, 2003. 长江河口盐水入侵[M]. 北京: 海洋出版社.
|
| [12] |
吴辉, 朱建荣, 2007. 长江河口北支倒灌盐水输送机制分析[J]. 海洋学报, 29(1): 17-25.
|
| [13] |
朱建荣, 鲍道阳, 2016. 近60年来长江河口河势变化及其对水动力和盐水入侵的影响Ⅰ. 河势变化[J]. 海洋学报, 38(12): 11-22.
|
| [14] |
朱建荣, 鲁佩仪, 唐川敏, 等, 2020. 长江河口北支建闸对减轻盐水入侵的数值模拟[J]. 华东师范大学学报(自然科学版), (3): 13-22.
|
| [15] |
朱建荣, 吕行行, 2019. 长江河口下扁担沙水域最长连续不宜取水时间[J]. 海洋学报, 41(6): 12-22.
|
| [16] |
朱建荣, 吴辉, 顾玉亮, 2011. 长江河口北支倒灌盐通量数值分析[J]. 海洋学研究, 29(3): 1-7.
|
| [17] |
朱宜平, 2021. 长江口青草沙水域外海正面盐水入侵特点分析[J]. 华东师范大学学报(自然科学版), (2): 21-29.
|
| [18] |
|
| [19] |
|
| [20] |
|
| [21] |
|
| [22] |
|
| [23] |
|
| [24] |
|
| [25] |
|
| [26] |
|
| [27] |
|
| [28] |
|
| [29] |
|
| [30] |
|
| [31] |
|
| [32] |
|
| [33] |
|
| [34] |
|
| [35] |
|
| [36] |
|
| [37] |
|
/
| 〈 |
|
〉 |
