
台风登陆前华南地区降水日变化特征分析
|
李卓(1993—), 女, 四川省绵阳市人, 主要研究方向为降水日变化和台风。email: |
收稿日期: 2021-04-09
修回日期: 2021-07-07
网络出版日期: 2021-07-09
基金资助
国家自然科学基金(42075004)
国家自然科学基金(42005062)
广东省自然科学基金(2021A1515011404)
Analysis of diurnal variation characteristics of precipitation over South China before typhoon landfall
Received date: 2021-04-09
Revised date: 2021-07-07
Online published: 2021-07-09
Supported by
National Natural Science Foundation of China(42075004)
National Natural Science Foundation of China(42005062)
Natural Science Foundation of Guangdong Province of China(2021A1515011404)
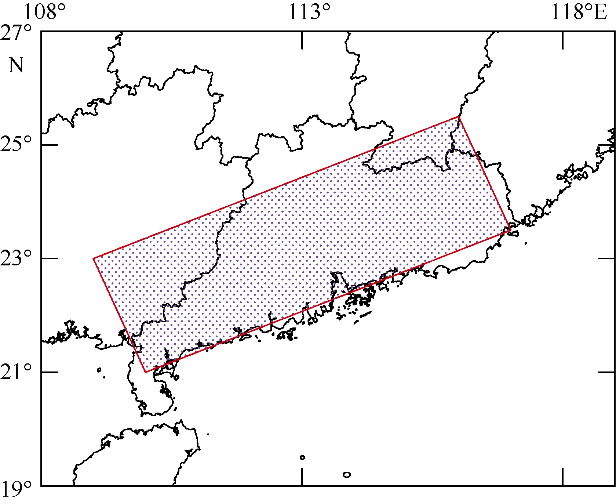
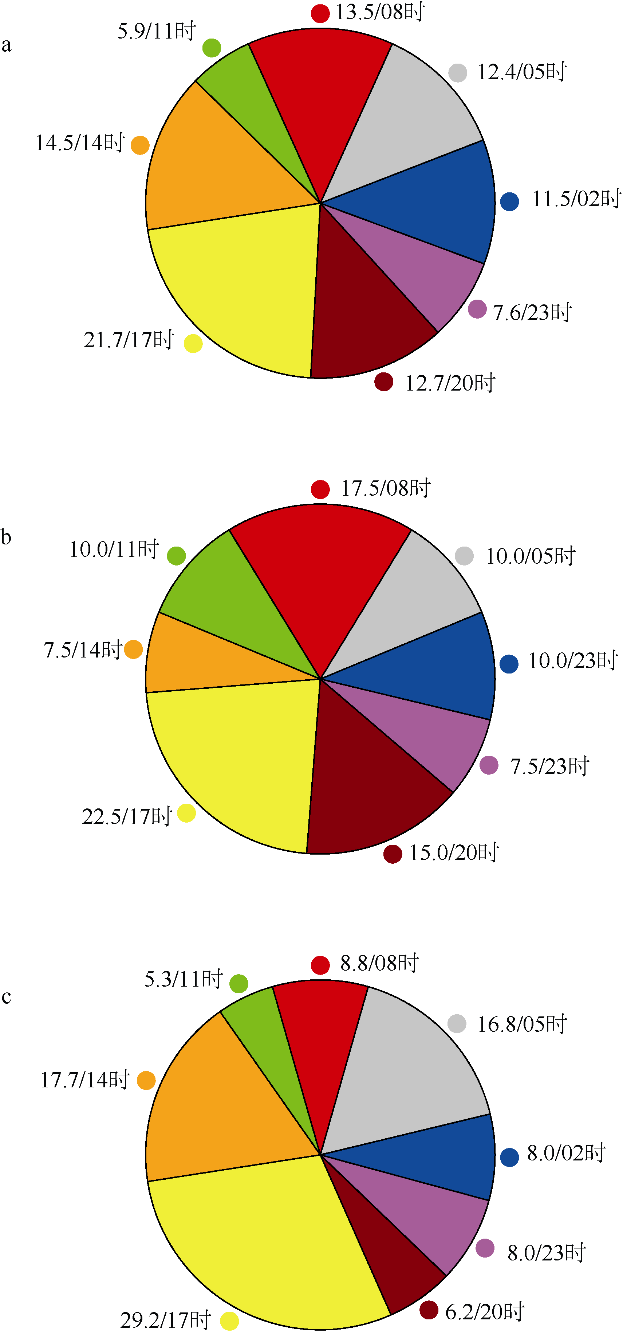
文章采用1998—2017年间日本气象厅(Japan Meteorological Agency, JMA)台风最佳路径、热带测雨卫星(tropical rainfall measuring mission, TRMM)逐3小时降水及日本55年再分析(Japanese 55-year reanalysis, JRA-55)逐6小时数据, 针对起源于西北太平洋、移动路径位于台湾岛以南且台风最外围第一波螺旋雨带经过华南地区的台风, 将符合上述条件的台风筛选出来后, 由卫星云图和TRMM降水资料判断出台风第一波螺旋雨带到达华南地区的日期, 并分析雨带到达之前台风对该地区日降水的影响, 以此探索台风登陆前外围环境场对华南地区降水日变化的影响规律及机理。结果表明, 在台风临近华南地区期间, 一方面台风外围气流会向该地区输送水汽促进该地区降水, 另一方面华南地区在台风外围辐散场下沉气流的影响下降水受到抑制。当前者作用大于后者时, 华南地区降水增强, 此情形下华南地区大气不稳定极值时间多发生于午后, 午后降水明显, 对应的台风多发生于7、8月份, 西太平洋副热带高压偏东, 有利于台风北移, 台风第一波雨带到达华南地区时台风中心距华南沿海较近; 反之, 华南地区降水减小, 大气层结较稳定, 夜间至清晨出现因辐射冷却导致的层云降水峰值, 对应的台风多出现于9、10月份, 西太平洋副热带高压西伸, 不利于台风向北发展, 台风第一波雨带到达华南地区时台风中心距华南沿海较远。文章结果有望提高对台风登陆前的外围环流场影响沿海地区云和降水过程的规律性认知。
李卓 , 黎伟标 , 张奡褀 . 台风登陆前华南地区降水日变化特征分析[J]. 热带海洋学报, 2022 , 41(2) : 26 -37 . DOI: 10.11978/2021045
We used the Japan Meteorological Agency (JMA) best track data, tropical rainfall measuring mission (TRMM) 3B42 3-hourly precipitation data and Japanese 55-year reanalysis (JRA-55) 6-hourly data from 1998 to 2017. We selected typhoons, which originated from the Northwest Pacific and had rain belt passing through South China with moving path located to the south of Taiwan Island, as our research objects. The date of the first spiral rain belt of typhoon arriving in South China was manually judged from satellite cloud images and TRMM precipitation data. The influences of typhoons on diurnal variation of precipitation in the study area before the rain belt arriving were then analyzed. The results showed that on the one hand the peripheral circulations of typhoons would transport much water vapor into the region before typhoon landfall, which was beneficial to the precipitation in the region; on the other hand, the downdraft outside of cyclonic divergence field would suppress the convection in the region, which was inconducive to the occurrence of precipitation. When the former played a greater role than the latter, the precipitation in South China would increase. The maximum of atmospheric instability within a day would occur in the afternoon, resulting in an afternoon rainfall peak. These relevant typhoons appeared mostly in July and August, when the western Pacific subtropical high was located easterly and was favorable for the northward movement of typhoon. The typhoon centers were close to the coastal area of South China when their first wave of rainband reached South China. On the contrary, the atmospheric layer over South China was stable and therefore precipitation decreased; the diurnal variation of precipitation peaked in the morning due to radiative cooling and the relevant typhoons mostly appeared in September and October. As the westward extension of the western Pacific subtropical high is not conducive to the northward movement of typhoon, the typhoon centers were far away from the coastal area of South China when their first wave of rain band reached South China. The results are expected to improve the knowledge for impact of cyclonic peripheral circulation on precipitation process in coastal regions before typhoon landfall.
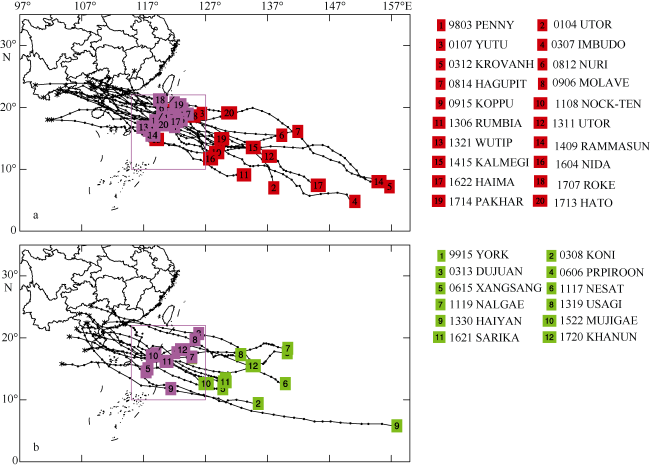
图2 筛选出来的1998—2017年间的1类台风(a)和2类台风(b)图中显示了台风编号、名称、路径和day0时台风中心经纬度。紫色方框内标注的各个点是两类台风第一波外围雨带到达华南地区时台风中心经纬度。该图基于国家测绘地理信息局标准地图服务网站下载的审图号为GS(2019)1822的标准地图制作 Fig. 2 The selected Typhoon-1 (a) and Typhoon-2 (b) from 1998 to 2017. Their numbers, names, routes, and longitude and latitude of typhoon center on day0 as shown in the picture. The points marked in the purple box are the longitudes and latitudes of the typhoons’ centers when the first wave of cyclonic spiral rain band reached South China |
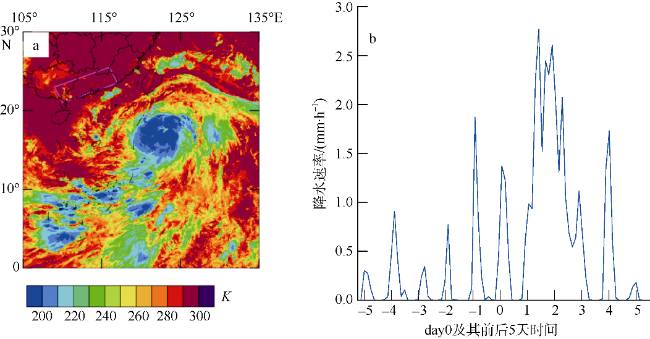
图3 201604号台风day0时刻10.4μm通道亮温(a)和day0前后5天关键区域的平均降水量(b)该图基于国家测绘地理信息局标准地图服务网站下载的审图号为GS(2019)1822的标准地图制作 Fig. 3 Horizontal distribution of Himawari-8 10.4 μm brightness temperature on day0 moment for typhoon 201604 (a), and time series of average precipitation within the study area before and after day0 (b) |
表1 两类台风的基本信息Tab. 1 Basic information for two classes of typhoons |
| 1类台风: 影响下华南地区午后降水强(20个) | 2类台风: 影响下华南地区午后降水不明显(12个) | ||||||||
|---|---|---|---|---|---|---|---|---|---|
| 编号 | 起始月份 | 最大强度 | day0强度 | day0日期/(月.日) | 编号 | 起始月份 | 最大强度 | day0强度 | day0日期/(月.日) |
| 199803 | 8 | 强热带风暴 | 热带风暴 | 8.9 | 199910 | 9 | 强热带风暴 | 热带风暴 | 9.12 |
| 200104 | 7 | 台风 | 台风 | 7.4 | 200308 | 7 | 强热带风暴 | 热带风暴 | 7.19 |
| 200107 | 7 | 台风 | 热带风暴 | 7.23 | 200313 | 8 | 强台风 | 台风 | 9.1 |
| 200307 | 7 | 强台风 | 强台风 | 7.22 | 200606 | 8 | 台风 | 热带风暴 | 8.1 |
| 200312 | 8 | 台风 | 台风 | 8.23 | 200616 | 9 | 超强台风 | 台风 | 9.29 |
| 200812 | 8 | 台风 | 台风 | 8.21 | 201117 | 9 | 强台风 | 台风 | 9.28 |
| 200814 | 9 | 强台风 | 强台风 | 9.22 | 201119 | 9 | 强台风 | 台风 | 9.30 |
| 200906 | 7 | 台风 | 强热带风暴 | 7.17 | 201319 | 9 | 超强台风 | 超强台风 | 9.20 |
| 200915 | 9 | 台风 | 热带风暴 | 9.13 | 201330 | 11 | 超强台风 | 台风 | 11.8 |
| 201108 | 7 | 强热带风暴 | 热带风暴 | 7.28 | 201522 | 10 | 强台风 | 热带风暴 | 10.2 |
| 201306 | 6 | 强热带风暴 | 热带风暴 | 6.30 | 201621 | 10 | 超强台风 | 台风 | 10.16 |
| 201311 | 8 | 超强台风 | 台风 | 8.12 | 201720 | 10 | 强台风 | 热带风暴 | 10.13 |
| 201321 | 10 | 超强台风 | 热带风暴 | 9.27 | |||||
| 201409 | 7 | 超强台风 | 台风 | 7.16 | |||||
| 201415 | 9 | 台风 | 台风 | 9.15 | |||||
| 201604 | 7 | 强台风 | 强热带风暴 | 7.31 | |||||
| 201622 | 10 | 超强台风 | 超强台风 | 10.19 | |||||
| 201707 | 7 | 热带风暴 | 热带风暴 | 7.22 | |||||
| 201713 | 8 | 强台风 | 热带风暴 | 8.20 | |||||
| 201714 | 8 | 台风 | 热带风暴 | 8.25 | |||||
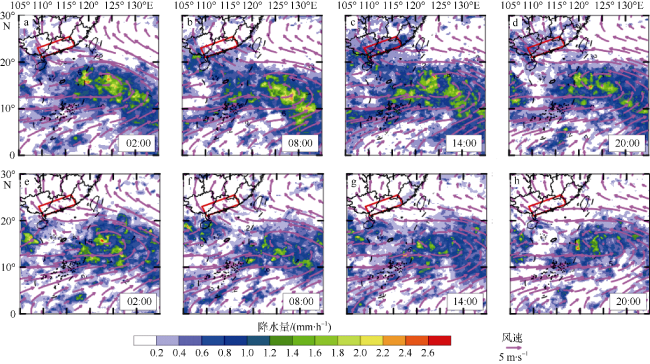
图6 1类台风(a~d)和2类台风(e~h)影响下华南地区地表降水量和850 hPa风场的变化图中红色方框标注了关键区域, 填色代表了降水强度的强弱情况, 矢量线表示风场的大小和方向。该图基于国家测绘地理信息局标准地图服务网站下载的审图号为GS(2019)1822的标准地图制作 Fig. 6 The average horizontal distributions of precipitation overlapped with 850 hPa wind field at different local times within three days before day0 under the influence of Typhoon-1 (a~d) and Typhoon-2 (c~d). The red box indicates the key area |
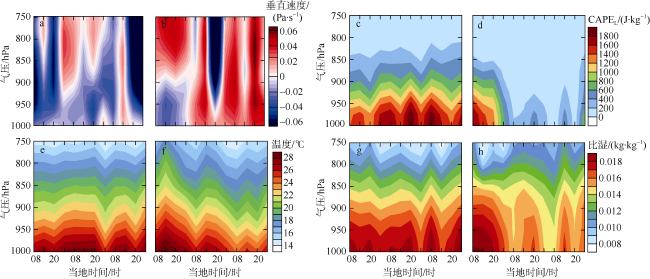
图7 day0前3天关键区域气流的垂直速度(a、b)、CAPEL (c、d)、温度(e、f)、比湿(g、h)在垂直方向上的情况图a、c、e、g表示1类台风影响下的情况; 图b、d、f、h表示2类台风影响下的情况。图a中数值为正代表气流下沉, 数值为负代表气流上升。CAPEL为大气顶到当前高度层的不稳定能量积分 Fig. 7 Temporal variations of vertical velocity (a, b), CAPEL (c, d), temperature (e, f), and specific humidity (g, h) with height in the key area within three days before day0 |
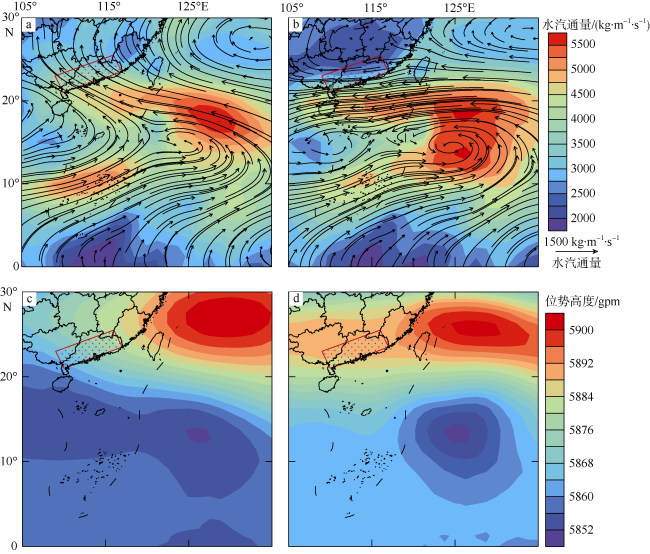
图8 关键区域附近1类台风(a、c)和2类台风(b、d)影响下day0前3天大气整层的平均水汽通量(a、b)和500hPa位势高度(c、d)图中红色方框为关键区域。该图基于国家测绘地理信息局标准地图服务网站下载的审图号为GS(2019)1822的标准地图制作 Fig. 8 Horizontal distributions of average 500 hPa geopotential height overlapped with column water vapor flux within three days before day0 for the two types of typhoon |
| [1] |
陈炯, 郑永光, 张小玲, 等, 2013. 中国暖季短时强降水分布和日变化特征及其与中尺度对流系统日变化关系分析[J]. 气象学报, 71(3). 367-382.
|
| [2] |
黄天福, 谢佳君, 刘鹏, 2013. 基于多卫星资料的全国夏秋季节降水日变化特征研究[J]. 贵州气象, 37(6): 30-33. (in Chinese)
|
| [3] |
李传祥, 王咏青, 夏华弟, 等, 2013. “海棠”、“罗莎”和“莫拉克”登陆前降水量差异分析[J]. 浙江气象, 34(2): 32-39. (in Chinese)
|
| [4] |
李德帅, 2013. 基于逐小时资料的华南地区汛期降水时空变化特征及其成因研究[D]. 兰州: 兰州大学: 1-151.
|
| [5] |
吕翔, 徐海明, 2007. 中南半岛地区夏季降水日变化特征[J]. 南京气象学院学报, 30(5): 632-642.
|
| [6] |
莫志祥, 1983. 从两次暴雨过程看热力条件分析的重要性[J]. 广西气象, (3): 21-24. (in Chinese)
|
| [7] |
唐红玉, 顾建峰, 俞胜宾, 等, 2011. 西南地区降水日变化特征分析[J]. 高原气象, 30(2): 376-384.
|
| [8] |
唐晓春, 刘会平, 潘安定, 等, 2003. 广东沿海地区近50年登陆台风灾害特征分析[J]. 地理科学, 23(2): 182-187.
|
| [9] |
王美蓉, 郭栋, 钟珊珊, 2019. 多源资料在青藏高原大气热源计算中的适用性分析[J]. 气象, 45(12): 1718-1726.
|
| [10] |
王文秀, 郭汝凤, 陈世发, 等, 2018. 1951-2016年登陆我国华南地区台风的时空分布特征分析[J]. 防护林科技, (6): 16-18.
|
| [11] |
夏静雯, 傅云飞, 2016. 东亚与南亚雨季对流和层云降水云内的温湿结构特征分析[J]. 大气科学, 40(3): 563-580.
|
| [12] |
许春林, 王文波, 杨森槐, 等, 2009. 台风“鹦鹉”登陆过程中肇庆降水显著偏弱的原因[J]. 广东气象, 31(6): 32-35.
|
| [13] |
徐建平, 林佩云, 1995. 台湾地形对过岛台风的影响[J]. 广东气象, (4): 42-44.
|
| [14] |
杨慧, 2019. 1960-2017年中国热带气旋降水气候特征研究[D]. 北京: 中国气象科学研究院: 1-62.
|
| [15] |
杨云月, 许涛, 罗翠榆, 等, 2020. 典型厄尔尼诺期间台风降水δ18O变化分析: 以2018年22号台风“山竹”为例[J]. 热带海洋学报, 39(4): 34-41.
|
| [16] |
宇如聪, 李建, 陈昊明, 等, 2014. 中国大陆降水日变化研究进展[J]. 气象学报, 72(5): 948-968.
|
| [17] |
宇如聪, 李建, 2016. 中国大陆日降水峰值时间位相的区域特征分析[J]. 气象学报, 74(1): 18-30.
|
| [18] |
张长江, 薛利成, 马雷鸣, 等, 2018. 热带气旋客观定位的红外亮温方差方法[J]. 中国图象图形学报, 23(3): 450-457.
|
| [19] |
张思齐, 2019. 全球再分析与中国观测资料对比研究[D]. 北京: 中国气象科学研究: 1-72.
|
| [20] |
张学敏, 1991. 台风环流降水的诊断分析[J]. 海洋预报, 8(1): 76-83.
|
| [21] |
周琴芳, 2019. 副热带高压对“灿鸿”和“苏迪罗”台风路径的影响[J]. 现代农业科技, (19): 196-197, 200.
|
| [22] |
邹丽丽, 谭桂容, 李任承, 等, 2017. 对流有效位能的本质和一种新的计算方法[J]. 气象科技进展, 7(3): 6-15.
|
| [23] |
|
| [24] |
|
| [25] |
|
| [26] |
|
| [27] |
|
| [28] |
|
| [29] |
|
| [30] |
|
| [31] |
|
| [32] |
|
/
| 〈 |
|
〉 |
