
热液喷口探测化学传感器的研制及应用*
作者简介:秦华伟(1976—), 男, 山西省长治市人, 教授, 硕士生导师, 主要从事海洋机电装备集成技术方面的研究。E-mail: qinhw@hdu.edu.cn
收稿日期: 2017-06-27
要求修回日期: 2017-09-13
网络出版日期: 2018-05-03
基金资助
国家海洋局海洋生态系统与生物地球化学重点实验室开放研究基金(LMEB201701)
Development and application of chemical sensor for hydrothermal vents detection
Received date: 2017-06-27
Request revised date: 2017-09-13
Online published: 2018-05-03
Supported by
State Oceanic Administration Key Laboratory of Marine Ecosystems and Biogeochemistry Open Research Fund (LMEB201701)
Copyright
秦华伟 , 陶卓 , 李怀明 , 岳羲和 , 蔡真 , 陈升 , 周红伟 , 叶瑛 . 热液喷口探测化学传感器的研制及应用*[J]. 热带海洋学报, 2018 , 37(3) : 86 -92 . DOI: 10.11978/2017072
The water around submarine hydrothermal vents has significant turbidity and chemical composition anomalies, providing an important indicator for finding hydrothermal vents. In this paper, a detection method of submarine hydrothermal vents was proposed, and a low-power chemical sensor hydrothermal detection system was designed. The chemical sensor can detect real-time potential values of pH, H2S, Eh, and CO32- when mounted on the relevant detection platform. Combined with abnormal turbidity, we can infer the location of hydrothermal vents. The results of the testing in the Southwest Indian Ridge showed that the chemical sensor can effectively detect chemical abnormalities caused by hydrothermal activity, which is an effective technique for detecting hydrothermal vents.
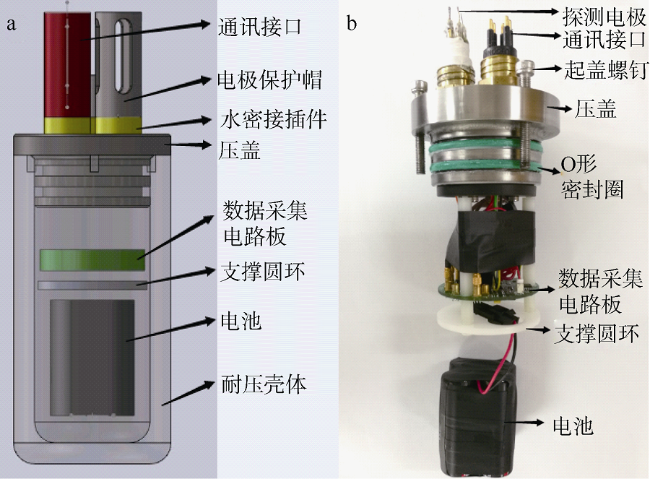
Fig. 1 Chemical sensor outline (a) and its internal structure (b)图1 化学传感器外形(a)及内部结构(b) |
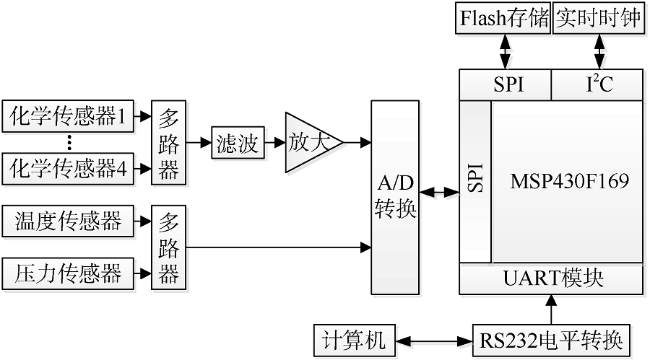
Fig. 2 Data collection system图2 数据采集系统 |
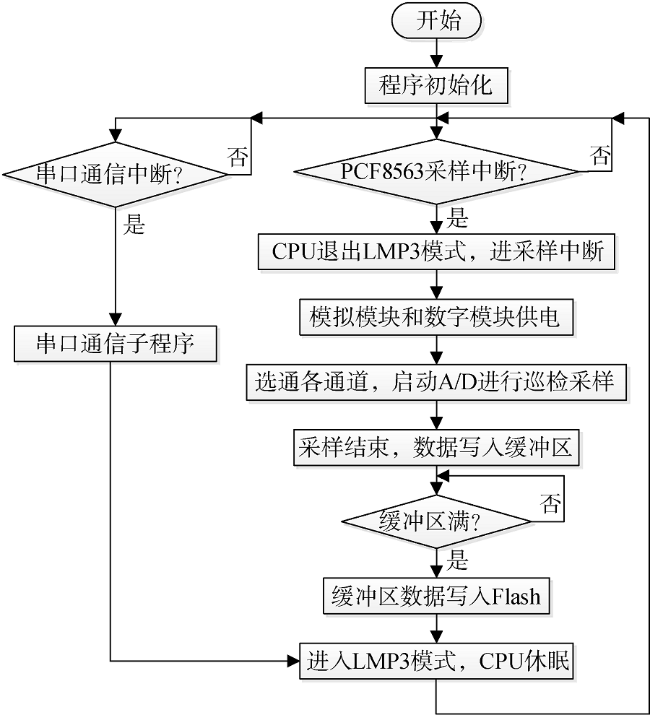
Fig. 3 Flow chart of the software system图3 系统软件流程图 |
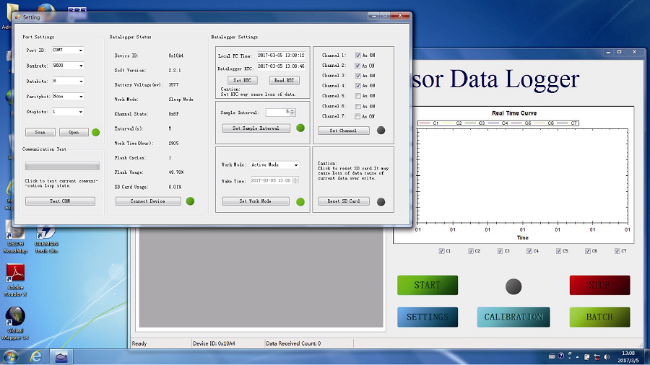
Fig. 4 Device software and hardware testing图4 设备软件及硬件测试 |
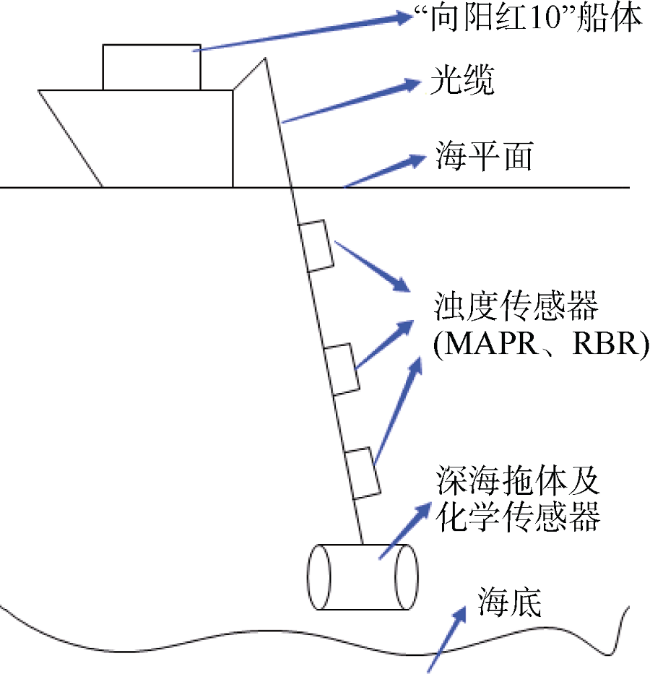
Fig. 5 Chemical sensor work diagram图5 化学传感器工作示意图 |
Tab. 1 Chemical sensor operation statistics表1 化学传感器作业情况统计表 |
| 航次 和航段 | 参加 测线数 | 有效 测线数 | 发现明显或可能 热液异常的测线数 |
|---|---|---|---|
| 43Ⅲ | 11 | 10 | 2 |
| 43Ⅳ | 18 | 17 | 3 |
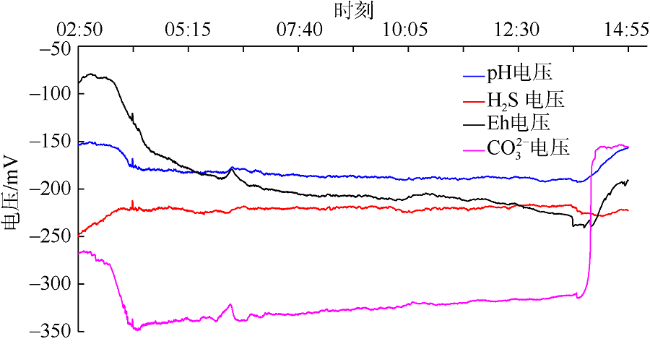
Fig. 6 Voltage changes of Eh, H2S, pH, and CO32- with time图6 Eh、H2S、pH及CO32-电位随时间变化图 |
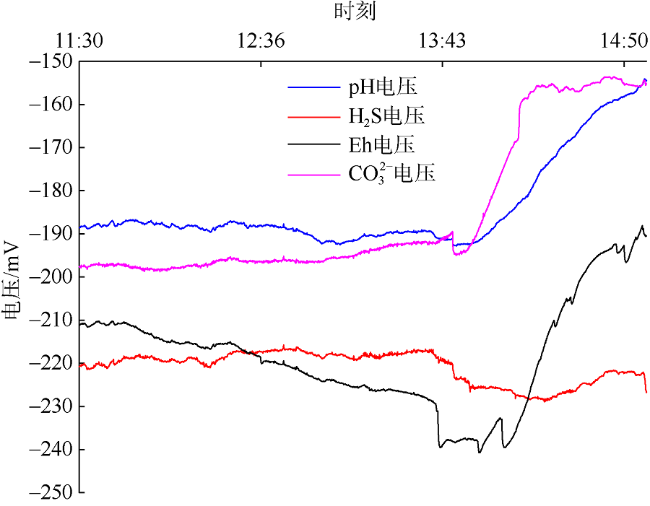
Fig. 7 Snapshot of chemical abnormalities图7 化学量异常局部图 |
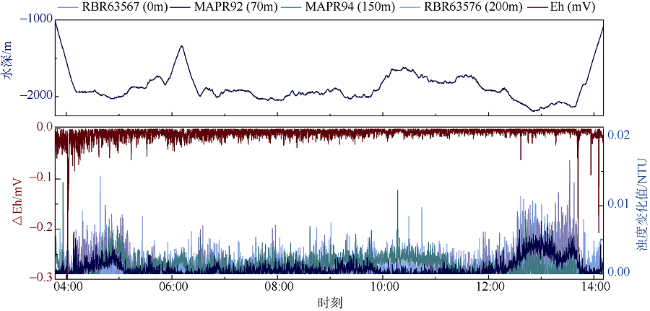
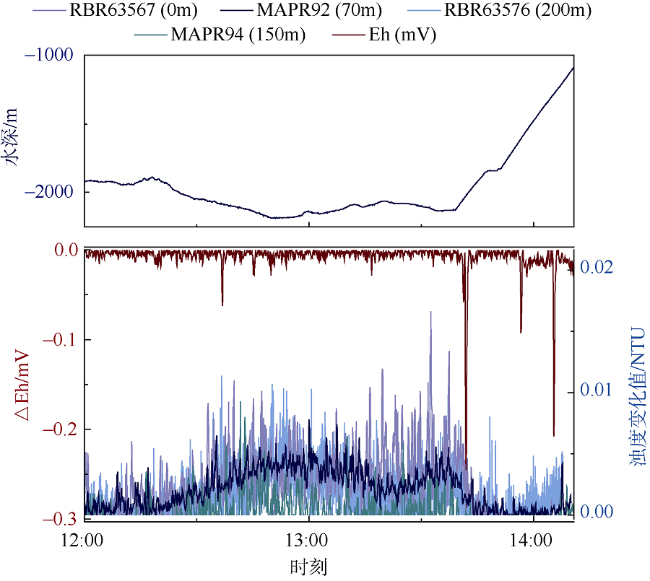
Fig. 8 Eh and turbidity changes with depth图8 氧化还原电位梯度ΔEh及浊度随深度变化图 |
Fig. 9 Snapshot of abnormal turbidity图9 浊度异常局部图 |
The authors have declared that no competing interests exist.
| [1] |
|
| [2] |
|
| [3] |
|
| [4] |
|
| [5] |
全国压力容器标准化技术委员会. JB 4732-1995 钢制压力容器分析设计标准[S]. 北京: 中国标准出版社, 1995.
|
| [6] |
|
| [7] |
|
| [8] |
|
| [9] |
|
| [10] |
|
| [11] |
|
| [12] |
|
| [13] |
|
| [14] |
|
| [15] |
|
/
| 〈 |
|
〉 |
