
利用热带太平洋关键区海表面盐度指标区分两类厄尔尼诺
作者简介:方祝骏(1993—), 男, 宁夏回族自治区银川市人, 在读硕士研究生, 主要从事气候变化研究。E-mail: 20161211128@nuist.edu.cn
收稿日期: 2018-06-04
要求修回日期: 2018-07-28
网络出版日期: 2019-04-15
基金资助
国家重点研究与发展项目(2016YFC1401601)
国家自然科学基金项目(41690122、41690120)
中国科学院战略性先导科技专项(XDA11010105、XDA11020306、XDA11010304)
Distinguishing two types of El Niño in the Tropical Pacific using key region sea surface salinity index
Received date: 2018-06-04
Request revised date: 2018-07-28
Online published: 2019-04-15
Supported by
National Key Research and Development Program of China (2016YFC1401601)
National Natural Science Foundation of China (41690122, 41690120)
Chinese Academy of Sciences Strategic Priority Project (XDA11010105, XDA11020306, XDA11010304)
Copyright
文章利用强化海洋数据(enhance ocean data, 简称EN4.4.1.f) 1980—2016年的再分析逐月资料, 根据海表盐度异常(SSSA)指标, 找出与厄尔尼诺关系最为重要和密切的盐度变化区域, 并区分两类厄尔尼诺。利用海表面温度作为两类厄尔尼诺的时间相关系数指标, 通过研究其水平分布发现: 在热带太平洋存在着多个能指示两类厄尔尼诺的盐度变化区域, 在东部(EP)型厄尔尼诺时期, 最显著的SSSA关键区主要出现在日界线附近的西太平洋暖池区域东边缘, 并以赤道和日界线为轴线呈中心对称分布; 而在中部(CP)型时期, 关键区在日界线以西的赤道太平洋, 且在日界线以东的SSSA分布则呈现沿赤道的经向非对称性, 这种非对称性在东南太平洋出现了与EP型厄尔尼诺时期相比更为显著不同的正SSSA关键区。文章以此找到关键区域中能够较好代表并区分两类厄尔尼诺的区域, 对挑选出的多个关键区进行有机组合, 定义了一组以SSSA为指标进行有效区分两类厄尔尼诺的方法, 并以此指数对近年来发生的两类厄尔尼诺进行合理再现。
方祝骏 , 智海 , 林鹏飞 , 魏翔 . 利用热带太平洋关键区海表面盐度指标区分两类厄尔尼诺[J]. 热带海洋学报, 2019 , 38(2) : 32 -42 . DOI: 10.11978/2018061
In this paper, the sea surface salinity anomaly (SSSA) index from the EN4 reanalysis data during 1980-2016 is used to distinguish two types of El Niño. We identify the salinity variation region which has a close contact with two types of El Niño in the tropical Pacific. We demonstrate that salinity time series in different boxes are related sea surface temperature variation, and can indicate two types of El Niño. Depending on the key salinity field contrast of their correlation coefficient of temporal and horizontal distribution. Evidently, the region of SSS field is mainly located in the equatorial region with symmetric distribution in the western tropical Pacific during the eastern Pacific (EP) El Niño. One significant region of SSS field is migrated westward, another skewing southward east of the dateline as asymmetric distribution during the central Pacific El Niño, which is different from the EP El Niño. Based on these characteristics, we find key areas of an index that represents two types of El Niño and distinguishes them. Finally, we use this index to reproduce recent El Niño events.
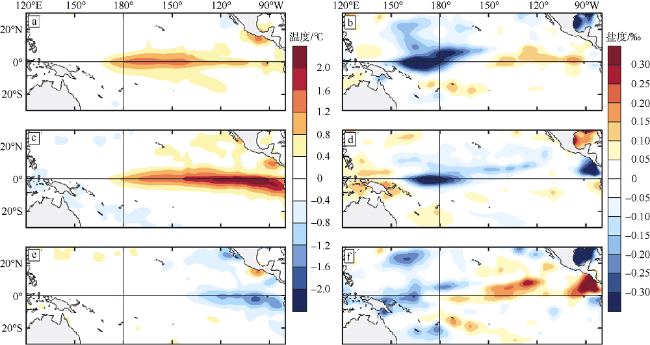
Fig. 1 Horizontal distribution of SSTA and SSSA and the difference between two types of El Niño events. (a, c, e) Sea surface temperature; (b, d, f) sea surface salinity; (a, b) CP type; (c, d) EP type; (e, f) CP minus EP图1 两类El Niño事件期间SSTA (单位: ℃)和SSSA (单位: ‰)的水平分布及两类事件之间对应的差值 |
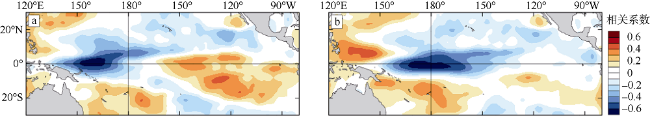
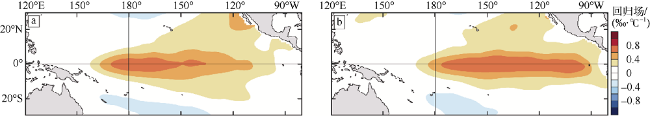
Fig. 2 Horizontal distributions of correlation coefficient. (a) CP type (EMI index), and (b) EP type (Niño3 Index)图2 区域中逐点的盐度分别与采用SSTA为指标(EMI或者Nino3)的时间序列求时间相关, 逐点相关系数构成相关系数水平分布图 |
Fig. 3 Horizontal distributions of lead and lag correlation coefficients between the time series of SSSA on each grid and EMI index. SSSA leading SSTA by four months to one month is shown in (a, b, c, d); the zero lead month of SSSA and SSTA is shown in (e); SSSA lagging SSTA by 1~4 months is shown in (f, g, h, i)图3 区域内逐点的SSSA时间序列与采用CP型SSTA为指标(EMI指数)的时间序列进行时间相关, 逐点相关系数的相关系数水平分布图 |
Fig. 4 Horizontal distributions of lead and lag correlation coefficients between the time series of SSSA on each grid and Niño3 index. SSSA leading SSTA by four months to one month is shown in (a, b, c, d); the zero lead month of SSSA and SSTA is shown in (e); SSSA lagging SSTA by 1-4 months is shown in (f, g, h, i)图4 区域内逐点的SSSA时间序列与采用EP型SSTA为指标(Niño3指数)的时间序列进行时间相关, 逐点相关系数的相关系数水平分布图 |
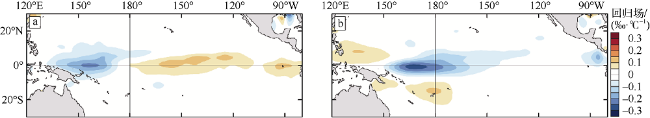
Fig. 5 Regressions of SSSA on each grid to EMI index (a) and Nino3 index (b)图5 分别为SSSA场回归到代表CP的EMI指数(a)和代表EP的Niño3指数(b)的水平分布图 |
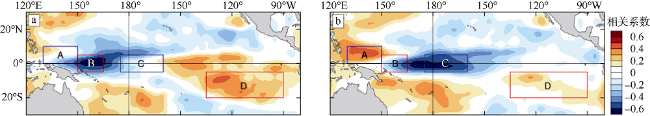
Fig. 6 Salinity correlated with the representing time series of CP El Niño (EMI index) (a) and EP El Niño (Niño3 Index) (b). The horizontal distribution of the correlation coefficient is shown. The red and blue boxes represent the characteristic areas of CP El Niño and EP El Niño, respectively图6 盐度逐点的时间序列与代表CP的时间序列(EMI指数)和EP的时间序列(Niño3指数)做超前1个月的时间相关的相关系数关键区。 |
Fig. 7 Regressions of SSTA on each grid to SCPI index (a) and SEPI index (b) by ARGO data图7 ARGO数据中SSTA场回归到代表CP的SCPI指数(a)和代表EP的SEPI指数(b)的水平分布图 |
Tab. 1 The temporal and spatial correlation coefficients between the CP/EP El Niño and SCPI/SEPI index, and the four EOF modes in the tropical Pacific表1 SCPI/SEPI指数以及热带地区EOF前四模态的时间系数与CP、EP型El Niño的时间和空间相关系数 |
| 类型 | 空间相关 | 时间相关 | ||
|---|---|---|---|---|
| CP | EP | CP | EP | |
| SCPI | 0.73 | 0.15 | 0.70 | 0.17 |
| SEPI | 0.15 | 0.50 | 0.11 | 0.69 |
| PC1 | 0.30 | 0.56 | 0.31 | 0.31 |
| PC2 | 0.08 | 0.76 | 0.22 | 0.43 |
| PC3 | 0.69 | 0.34 | 0.58 | 0.09 |
| PC4 | 0.29 | -0.10 | 0.17 | -0.14 |
注: PC表示EOF分析的各个主成分 |
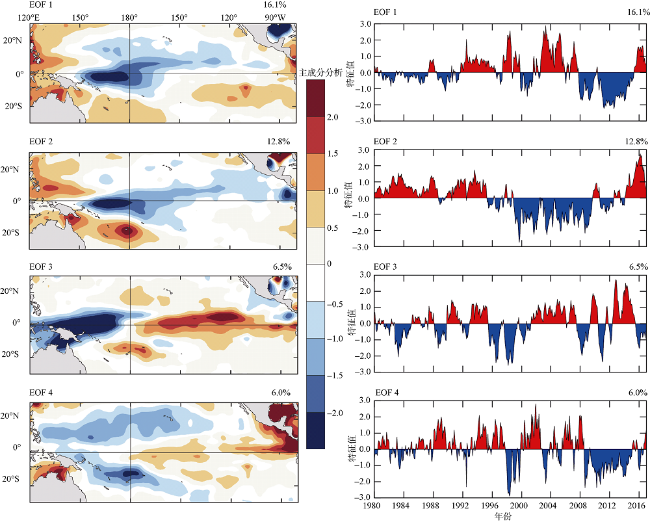
Fig. 8 The first four EOF modes of SSSA (left panels) and the corresponding time coefficients (right panels) in the tropical Pacific图8 热带地区SSSA的EOF分析前四模态水平分布图(左)及其时间系数图(右) |
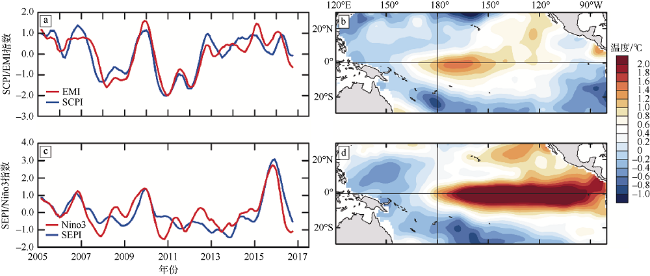
Fig. 9 The time series of SCPI/EMI index (a), SEPI/ Niño3 index (b) and the compound horizontal distribution by SSTA extreme points when reaching the standard of SCPI/SEPI index, (c) CP, and (d) EP图9 指数的时间序列 |
The authors have declared that no competing interests exist.
| [1] |
|
| [2] |
|
| [3] |
|
| [4] |
|
| [5] |
|
| [6] |
|
| [7] |
|
| [8] |
|
| [9] |
|
| [10] |
|
| [11] |
|
| [12] |
|
| [13] |
|
| [14] |
|
| [15] |
|
| [16] |
|
| [17] |
|
| [18] |
|
| [19] |
|
| [20] |
|
| [21] |
|
| [22] |
|
| [23] |
|
| [24] |
|
| [25] |
|
| [26] |
|
| [27] |
|
| [28] |
|
| [29] |
|
| [30] |
|
| [31] |
|
| [32] |
|
| [33] |
|
| [34] |
|
| [35] |
|
| [36] |
|
| [37] |
|
| [38] |
|
| [39] |
|
| [40] |
|
| [41] |
|
| [42] |
|
| [43] |
|
/
| 〈 |
|
〉 |


