
南海北部海面高度的季节内变异及其传播特征 *
|
王霞(1984—), 女, 河南省开封市人, 博士研究生, 主要从事南海环流和中尺度涡研究。E-mail:wangxia@scsio.ac.cn |
Copy editor: 林强
收稿日期: 2018-08-22
要求修回日期: 2018-09-14
网络出版日期: 2019-06-17
基金资助
国家自然科学基金项目(41776014)
国家自然科学基金项目(41430964)
中国科学院前沿科学重点研究计划(QYZDJ-SSW-DQC034)
版权
Intra-seasonal variability of sea level anomalies and their propagation features in the northern South China Sea from 25 years of satellite altimetry data
Copy editor: LIN Qiang
Received date: 2018-08-22
Request revised date: 2018-09-14
Online published: 2019-06-17
Supported by
National Natural Science Foundation of China(41776014)
National Natural Science Foundation of China(41430964)
Key Research Program of Frontier Science of Chinese Academy of Sciences(QYZDJ-SSW-DQC034)
Copyright
利用25年(1993—2017)的卫星高度计资料, 采用复经验正交函数(complex empirical orthogonal function, CEOF)方法, 分析南海北部海区海面高度季节内变异的时空分布及传播特征。标准差分析表明, 南海北部海面高度的季节内变异(intra-seasonal variability of sea level anomalies, SLA-ISV)在沿陆坡外侧区较强, 且SLA-ISV表现出明显的季节性变化, 冬半年强于夏半年。CEOF前两个主要模态能较好地揭示研究海区SLA-ISV的时空分布及其传播特征, 并表明SLA-ISV的强度受到季节性变化和年际变化的调制。全年CEOF的第一模态揭示SLA-ISV从台湾岛西南至西沙群岛以东区域的冬半年西南向传播特征; 而全年CEOF的第二模态则表现了SLA-ISV分别在台湾岛西南和东沙群岛西南的西南向传播特征。南海北部中尺度涡季节变化统计分析表明, CEOF的分解结果与南海北部的涡旋活动一致。
王霞 , 方文东 , 陈荣裕 . 南海北部海面高度的季节内变异及其传播特征 *[J]. 热带海洋学报, 2019 , 38(3) : 1 -12 . DOI: 10.11978/2018086
Intra-seasonal variability (ISV) of sea level anomalies (SLA) and their propagation features in the northern South China Sea (NSCS) are investigated using 25-year (1993-2017) satellite observations. The standard deviation of intra-seasonal SLA reveals that larger ISV exists in the northeastern South China Sea along the continental shelf/slope (200~2000 m) where it extends southwestward from Taiwan to Hainan. The ISV of SLA exhibits obvious seasonality, being strong in winter and weak in summer. By using Complex Empirical Orthogonal Function (CEOF) analysis, the spatial pattern and temporal variability of the ISV, as well as their inter-annual modulation, are studied. We find that there are mainly two types of ISV pattern, showing great agreement with eddy activities in the NSCS. The ISV of SLA is also modulated by seasonal and inter-annual variation. The first mode of CEOF indicates southwestward propagation of the ISV from southwest of Taiwan to east of the Xisha Islands, being especially strong in winter. The second mode of CEOF reveals two westward ISV regions: southwest to Taiwan and south to the Dongsha Islands. The statistical analysis for the seasonal variation of mesoscale eddies indicates that the CEOF results are consistent with the distribution of mesoscale eddy activities in the NSCS.
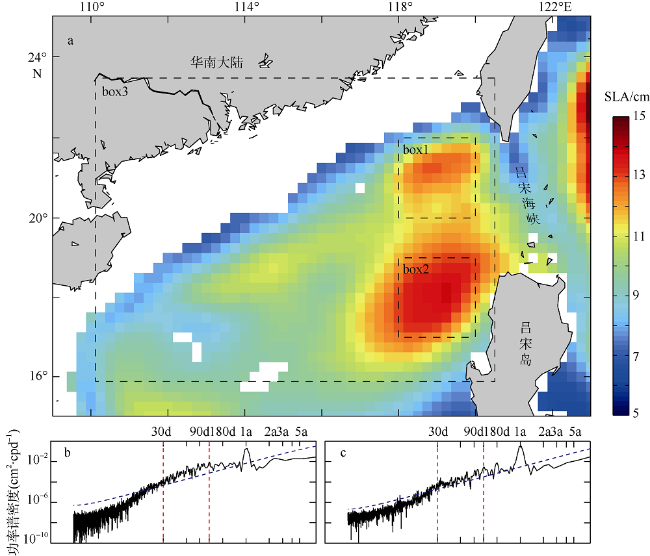
图1 1993—2017年的SLA标准差分布(a)和box1(b)、box2(c)的功率谱密度图图a中box1和box2为南海北部标准差分布的两个高值区。box3为第三节CEOF的计算范围。图b、c中的蓝色虚线为95%的置信度检验曲线, 红线标识了海面高度季节内变异带通滤波的截至频率带(30~120d), x轴为log10的对数坐标轴 Fig. 1 a: Standard deviation of SLA during 1993-2017. The black box1 and box2 indicate two regions with strong SLA variability. The black box3 denotes the area where the CEOF is applied for the intra-seasonal SLA in section 3. b-c: Power spectral analysis for SLA in box1 and box2. Blue dotted line denotes the 95% confidence line, and the red vertical lines indicate the cutoff periods (30-120 day) for intra-seasonal signals, the x-axis is log10 coordinates |
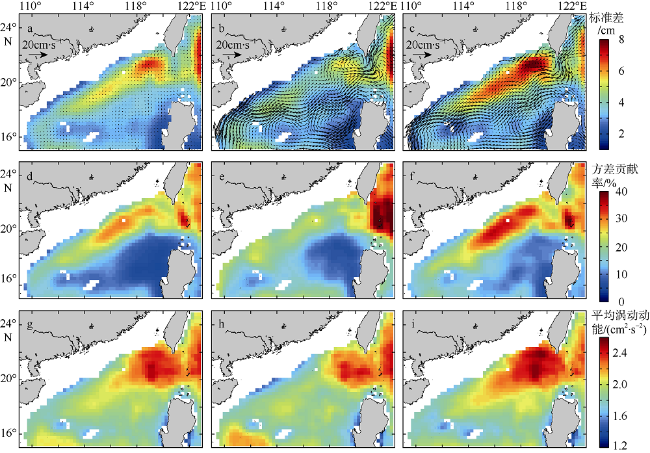
图2 1993—2017年30~120d季节内变异标准差(a—c)、方差贡献率(d—f)和平均EKE(log10)空间分布(g—i)a—c中的矢量表示多年平均表层地转流。从左至右分别表示全年、夏半年和冬半年 Fig. 2 Multiyear mean surface geostrophic current anomaly and standard deviation (a-c), variance contribution (d-f), mean EKE(log10) of 30~120 day filtered SLA during 1993-2017(g-i). The left, middle and right columns are for all, summer (April-September) and Winter (October-March) |
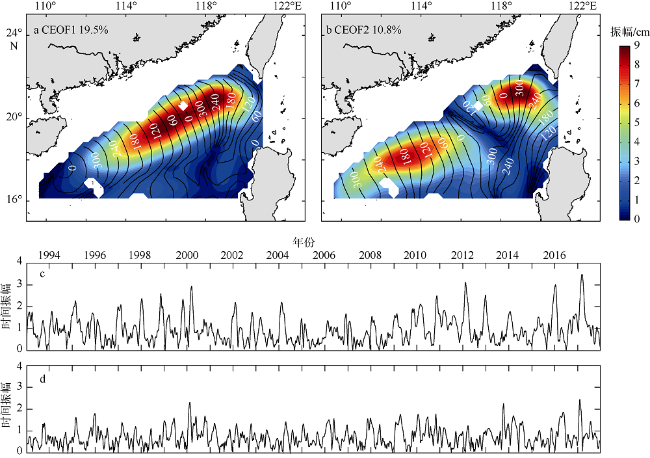
图3 南海北部SLA-ISA全年数据的CEOF分解结果a、b为第一模态(CEOF1)和第二模态(CEOF2)的空间振幅(填色)及空间位相分布(等值线, 间隔为30°); c、d分别为CEOF1和CEOF2的时间振幅(无量纲) Fig. 3 Spatial amplitude (shading; cm) and phase (contour; interval = 30°) corresponding to CEOF1(a) and CEOF2 (b) of the 30-120 day filtered SLA. Time series for CEOF1 (c) and CEOF2 (d) |
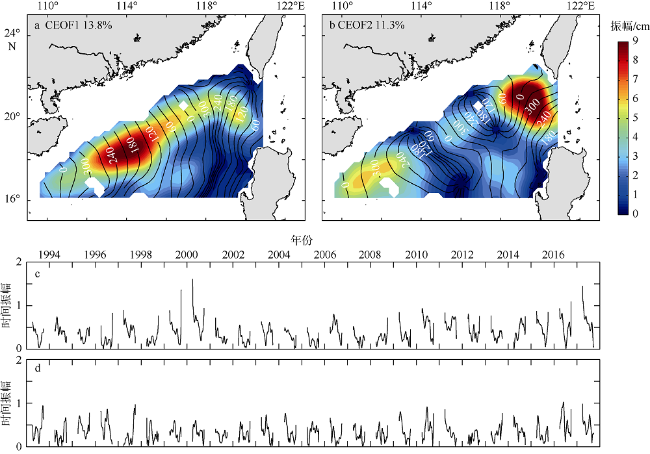
图4 南海北部SLA-ISA夏半年(4月至9月)数据的CEOF分解结果a、b为第一模态(CEOF1)和第二模态(CEOF2)的空间振幅(填色)及空间位相分布(等值线, 间隔为30°); c、d分别为CEOF1和CEOF2的时间振幅(无量纲) Fig. 4 Same as |
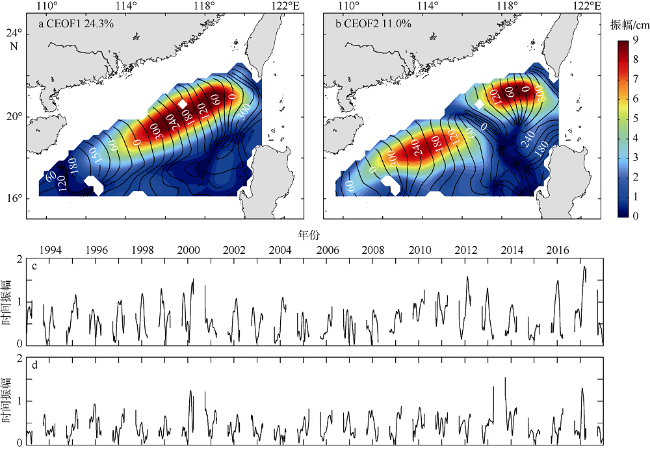
图5 南海北部SLA-ISA冬半年(10月至次年3月)数据的CEOF分解结果a、b为第一模态(CEOF1)和第二模态(CEOF2)的空间振幅(填色)及空间位相分布(等值线, 间隔为30°); c、d分别为CEOF1和CEOF2的时间振幅(无量纲) Fig. 5 Same as |
表1 前3个模态的方差贡献率Tab. 1 Variance of the first three leading CEOF modes |
| CEOF 模态 | 全年 | 冬半年(10—3月) | 夏半年(4—9月) | |||
|---|---|---|---|---|---|---|
| 方差贡献率/% | 累计/% | 方差贡献率/% | 累计/% | 方差贡献率/% | 累计/% | |
| 1 | 19.5 | 19.5 | 24.3 | 24.3 | 13.8 | 13.8 |
| 2 | 10.8 | 30.3 | 11.0 | 35.3 | 11.3 | 25.1 |
| 3 | 7.8 | 38.1 | 8.8 | 44.0 | 8.1 | 33.2 |
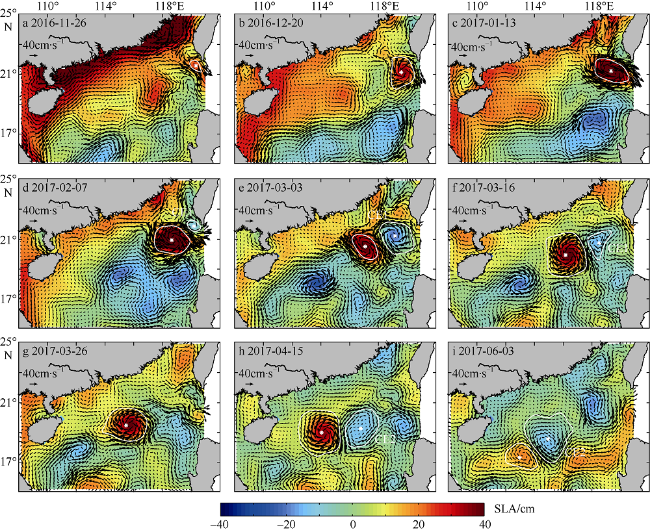
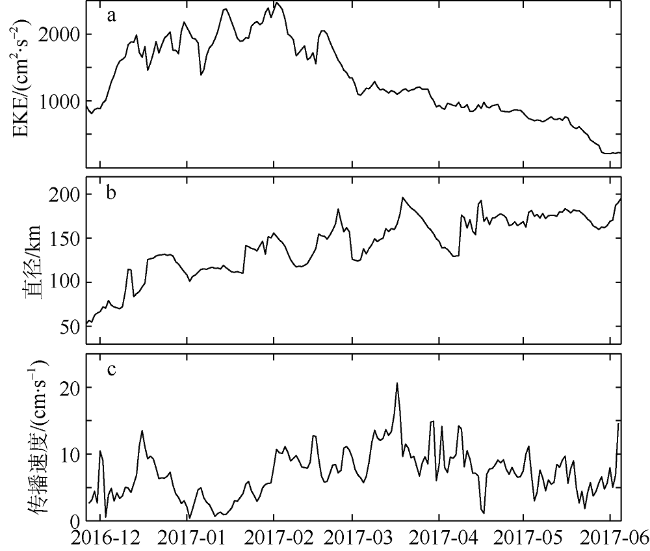
图6 2016年11月至2017年6月一典型的反气旋涡演变过程矢量表示地转流异常, 白色的封闭曲线为涡旋的边界, 白色星号点为涡旋中心 Fig. 6 Temporal evolution of an anticyclonic eddy detected by altimeter SLA, and geostrophic current anomalies from November 2016 to June 2017. Enclosed white contour and white dot denote eddy boundary and eddy core, respectively |
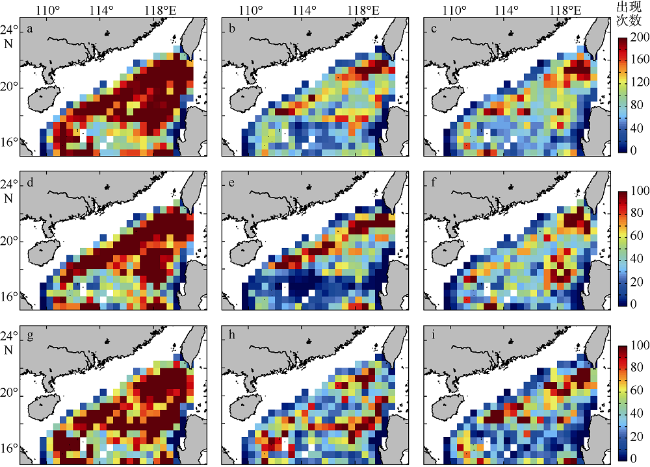
图8 1993年1月至2017年1月南海北部涡旋出现次数的空间统计a—c为全年, d—f为冬半年, g—i为夏半年。按0.5°×0.5°的网格大小, 统计了1993年1月至2017年1月涡旋中心经过每个网格的次数。从左至右分别为所有的涡旋、反气旋涡和气旋涡 Fig. 8 Geographic distributions of eddy occurrence (units in times). The upper row is for the whole year, the middle row is for winter (October to March) and the lower row is for summer (April to September) at each 0.5°×0.5° pixel in the NSCS between January 1993 and January 2017. The eddy occurrence denotes all detected eddy snapshots. The left, middle and right columns are for all eddies, anticyclonic eddies and cyclonic eddies, respectively |
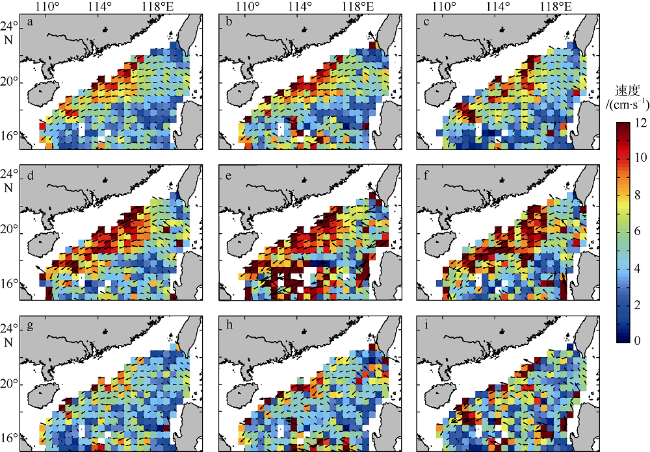
图9 南海北部涡旋传播速度的空间分布a—c为全年, d—f为冬半年, g—i为夏半年。按0.5°×0.5°的网格大小, 统计了1993年1月至2017年1月涡旋经过每个网格时的速度和方向。从左至右分别为所有的涡旋、反气旋涡和气旋涡 Fig. 9 Geographic distributions of eddy propagation speeds (units: cm·s-1). The upper row is for the whole year, the middle row is for winter (October to March) and the lower row is for summer (April to September) at each 0.5°×0.5° pixel in the NSCS between January 1993 and January 2017. The left, middle and right columns are for all eddies, anticyclonic eddies and cyclonic eddies, respectively |
The authors have declared that no competing interests exist.
作者已声明无竞争性利益关系。
| [1] |
程旭华, 齐义泉, 王卫强 , 2005. 南海中尺度涡的季节和年际变化特征分析[J]. 热带海洋学报, 24(4):51-59.
|
| [2] |
李立, 许金电, 靖春生 , 等, 2002. 南海海面高度、动力地形和环流的周年变化——TOPEX/Poseidon卫星测高应用研究[J]. 中国科学(D辑), 32(12):978-986.
|
| [3] |
李燕初, 蔡文理, 李立 , 等, 2003. 南海东北部海域中尺度涡的季节和年际变化[J]. 热带海洋学报, 22(3):61-70.
|
| [4] |
王桂华, 苏纪兰, 齐义泉 , 2005. 南海中尺度涡研究进展[J]. 地球科学进展, 20(8):882-886.
|
| [5] |
魏凤英 , 2007. 现代气候统计诊断与预测技术[M]. 2版. 北京: 气象出版社: 1-296.
|
| [6] |
|
| [7] |
|
| [8] |
|
| [9] |
|
| [10] |
|
| [11] |
|
| [12] |
|
| [13] |
|
| [14] |
|
| [15] |
|
| [16] |
|
| [17] |
|
| [18] |
|
| [19] |
|
| [20] |
|
| [21] |
|
| [22] |
|
| [23] |
|
| [24] |
|
| [25] |
|
| [26] |
|
| [27] |
|
| [28] |
|
| [29] |
|
| [30] |
|
| [31] |
|
| [32] |
|
| [33] |
|
| [34] |
|
| [35] |
|
/
| 〈 |
|
〉 |
