
南海岛礁周边海域表面叶绿素浓度的时空特征
|
陈武阳(1995—), 男, 江西省九江市人, 主要从事珊瑚礁海区动力过程环境效应研究 |
Copy editor: 林强
收稿日期: 2018-12-10
要求修回日期: 2019-05-07
网络出版日期: 2019-11-26
基金资助
中国科学院先导专项项目(XDA13030304)
国家重点研发计划(2017YFC1405402)
中国科学院重点部署项目(KGZDEW60902)
热带海洋环境国家重点实验室(中国科学院南海海洋研究所)自主研究项目(LTOZZ1701)
版权
Spatial-temporal variation of sea surface chlorophyll around islands and reefs in the South China Sea
Copy editor: LIN Qiang
Received date: 2018-12-10
Request revised date: 2019-05-07
Online published: 2019-11-26
Supported by
Strategic Priority Research Program of the Chinese Academy of Sciences(XDA13030304)
National Key Research and Development Program of China(2017YFC1405402)
Key Program of the Chinese Academy of Sciences(KGZDEW60902)
Innovation Group Program of State Key Laboratory of Tropical Oceanography (South China Sea Institute of Oceanology)(LTOZZ1701)
Copyright
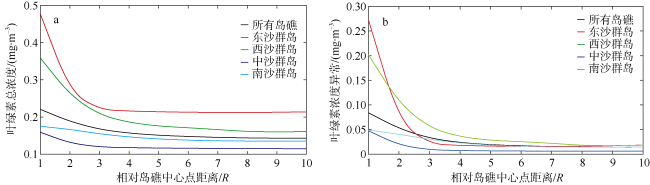
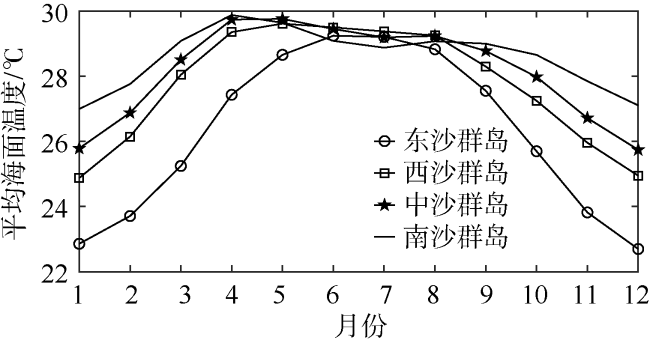
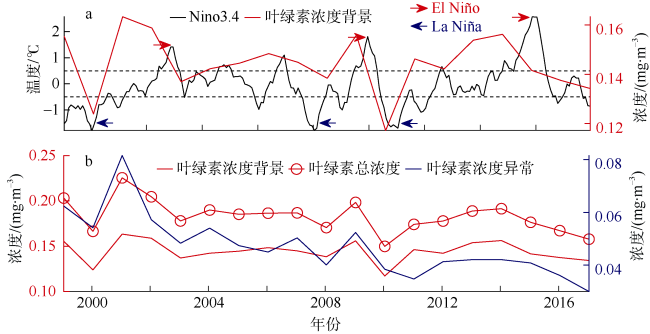
南海海域内岛礁众多, 渔业资源丰富, 而目前针对岛礁周边海区生态要素开展的研究仍较少。本文利用近20年多卫星融合水色遥感数据, 分析了南海38个主要岛礁周边区域海面叶绿素浓度的空间分布、季节变化和年际变化特征。结果表明, 岛礁周边普遍存在叶绿素浓度高值区, 其浓度约在离岛礁5个等效半径外降至海区背景水平。岛礁周边海域的叶绿素(相对于背景值的)浓度异常受海区背景值影响, 两者在南海的空间分布格局与背景值基本一致: 在平均温度较低、季风强度较大的东沙、西沙海区, 叶绿素浓度异常高于温度较高、季风强度相对较弱的中沙、南沙海区。叶绿素浓度呈现出明显的季节变化和年际变化特征, 一般在冬季风期间升高, 而在夏季风爆发前降至最低; 在El Niño次年随海温升高和季风减弱而下降, 在La Niña次年则相反。岛礁周边的叶绿素浓度异常受到温度变化的影响, 随着近年来海温变化幅度加大, 其年均水平呈显著下降趋势(P=5.05×10 -5)。这些结果可为我国岛礁区域渔业资源的开发和管理提供信息支持。
陈武阳 , 李骏旻 , 何庆友 , 唐世林 , 施平 . 南海岛礁周边海域表面叶绿素浓度的时空特征[J]. 热带海洋学报, 2019 , 38(6) : 21 -28 . DOI: 10.11978/2018135
There are many islands and reefs associated with abundant fishery resources in the South China Sea (SCS). Ecological variables such as chlorophyll in these regions were seldom studied. In this paper, merged ocean color data in recent ~20 years are used to analyze the spatial, seasonal and interannual variations of sea surface chlorophyll concentration (CHL) around 38 islands and reefs in the SCS. The results show that CHL is relatively high around these islands and reefs, which is generally reduced to the background level at five equivalent radii from the island center. The CHL anomaly (relative to the background CHL) is consistent with background CHL in terms of spatial distribution. They are relatively high in Xisha and Dongsha regions, and relatively low in Zhongsha and Nansha regions, mainly due to differences in temperatures and monsoon intensities. The CHL has significant seasonal and interannual variations. It rises during the winter monsoon and falls to a minimum before the summer monsoon onset. It declines in the following years of El Niño, when the SST increases and the monsoon weaken; and the opposite happens in the following years of La Niña. Moreover, the CHL anomaly increases in spring and autumn seasons when the coral reef community is growing vigorously in Xisha and Dongsha regions. It decreased significantly (P=5.05×10 -5) during the last 20 years, probably due to the increases in sea surface temperature and its amplitude. These findings provide useful information for the development and management of fishery resources in the SCS.
Key words: islands and reefs; chlorophyll; South China Sea; monsoons; sea surface temperature
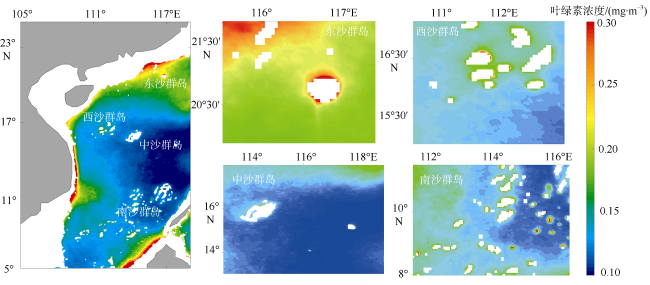
图1 南海及主要岛礁区域多年平均(1999—2017)海面叶绿素浓度分布Fig. 1 Multi-year (1999-2017) averages of sea surface chlorophyll concentrations (CHL) around islands and reefs in the South China Sea (SCS) |
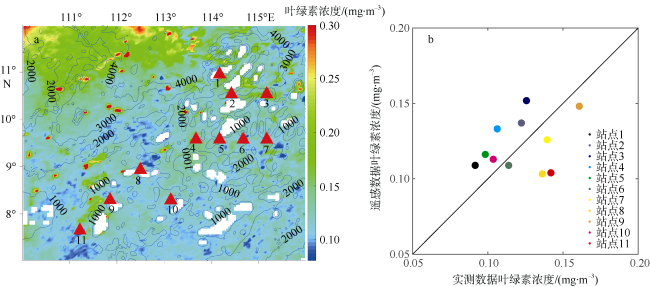
图2 GlobColour多卫星融合海面叶绿素数据与南沙海区2015年12月实测数据的比较a. 卫星遥感海面叶绿素浓度(填色)、水下地形(等深线)与航次站位(三角形)分布; b. 现场观测浓度与卫星遥感数据的对应关系。遥感数据与实测数据相比, 均方根误差为0.021mg·m-3, 平均相对误差为16% Fig. 2 Comparison between GlobColour and in-situ CHL data measured in Nansha region in December 2015. a) Spatial distributions of GlobColour CHL concentration (color), topography (contour) and cruise stations (triangle); b) in-situ data vs remote sensing data, with root mean squared error of 0.021 mg·m-3 and mean relative error of 16% |
表1 本文用于分析的南海岛礁列表Tab. 1 Islands and reefs analyzed in this paper |
| 海区 | 岛礁 | 经度 | 纬度 | R/km |
|---|---|---|---|---|
| 东沙群岛 | 北卫滩 | 115°58′E | 21°04′N | 2.1 |
| 南卫滩 | 115°55′E | 20°58′N | 2.3 | |
| 东沙环礁 | 116°49′E | 20°40′N | 11.6 | |
| 西沙群岛 | 华光礁 | 111°40′E | 16°13′N | 12.9 |
| 中建岛 | 111°12′E | 15°46′N | 2.1 | |
| 永兴岛 | 112°20′E | 16°50′N | 2.3 | |
| 银砾滩 | 112°14′E | 16°46′N | 2.2 | |
| 玉琢礁 | 112°01′E | 16°20′N | 7.3 | |
| 浪花礁 | 112°31′E | 16°03′N | 8.2 | |
| 东岛 | 112°44′E | 16°40′N | 2.0 | |
| 金银岛 | 111°31′E | 16°27′N | 2.9 | |
| 中沙群岛 | 华夏暗沙 | 113°58′E | 15°52′N | 3.2 |
| 排洪滩 | 113°42′E | 15°37′N | 2.4 | |
| 中南暗沙 | 115°24′E | 13°57′N | 3.3 | |
| 黄岩岛 | 117°46′E | 15°09′N | 8.2 | |
| 南沙群岛 | 雄南礁 | 116°46′E | 11°55′N | 2.1 |
| 双子礁 | 114°21′E | 11°25′N | 5.9 | |
| 铁峙礁 | 114°14′E | 11°03′N | 5.4 | |
| 渚碧礁 | 114°05′E | 10°55′N | 2.8 | |
| 库归礁 | 114°35′E | 10°45′N | 4.3 | |
| 杨信沙洲 | 114°32′E | 10°42′N | 6.0 | |
| 舶兰礁 | 114°35′E | 10°24′N | 4.7 | |
| 安达礁 | 114°42′E | 10°21′N | 5.6 | |
| 牛轭礁 | 114°39′E | 09°59′N | 3.6 | |
| 主权礁 | 114°34′E | 09°58′N | 2.3 | |
| 华礁 | 114°18′E | 09°50′N | 4.2 | |
| 屈原礁 | 114°22′E | 09°47′N | 5.6 | |
| 和平暗沙 | 115°54′E | 10°53′N | 4.2 | |
| 海马滩 | 117°47′E | 10°50′N | 7.0 | |
| 东华礁 | 116°55′E | 10°32′N | 2.1 | |
| 莪兰暗沙 | 117°16′E | 10°19′N | 4.2 | |
| 半路礁 | 116°08′E | 10°07′N | 2.0 | |
| 美济礁 | 115°32′E | 09°54′N | 4.6 | |
| 仁爱礁 | 115°52′E | 09°44′N | 3.3 | |
| 浪口礁 | 114°40′E | 08°07′N | 16.1 | |
| 金盾暗沙 | 111°32′E | 07°35′N | 4.3 | |
| 福禄寺礁 | 113°38′E | 10°14′N | 2.2 | |
| 万安滩 | 109°31′E | 07°30′N | 5.3 |
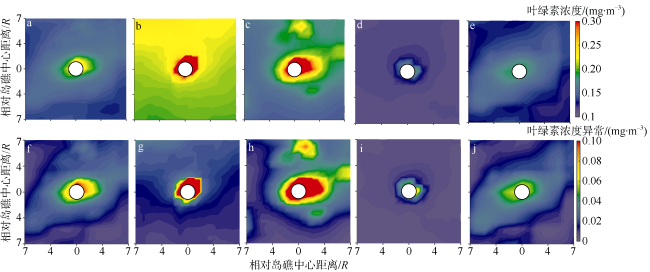
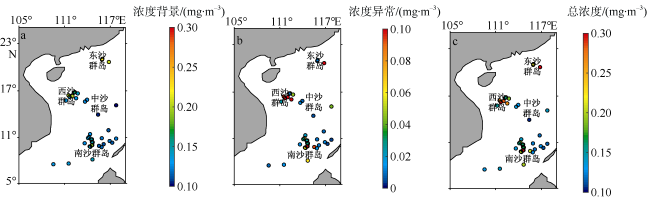
图4 南海(a、f)及东沙(b、g)、西沙(c、h)、中沙(e、i)和南沙(e、j)海区主要岛礁周边海域多年(1999—2017)平均海面叶绿素浓度(a—e)和叶绿素浓度异常(f—j)的合成分布Fig. 4 Composite averages (1999-2017) of (top) CHL and (bottom) CHL anomaly around typical islands and reefs in the whole SCS (a, f), Dongsha (b, g), Xisha (c, j), Zhongsha(d, i), and Nansha (e, j) |
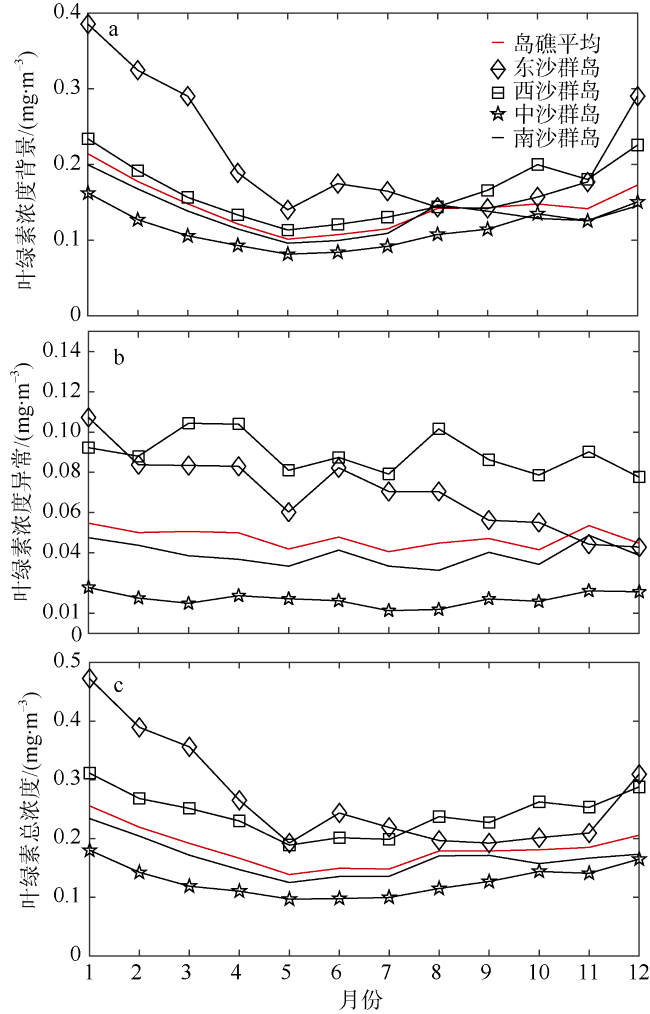
图7 南海主要岛礁多年(1999—2017)月平均海面叶绿素浓度背景值(7~9R)(a)、岛礁邻近区(1~3R)叶绿素浓度异常值(b)和叶绿素总浓度值(c)的年周期变化Fig. 7 Multi-year (1999-2017) monthly averages of background (7~9R) CHL of typical islands and reefs in the SCS (a), CHL anomaly (b), and total CHL (=a + b) in the adjacent island and reef areas (1~3R) (c) |
图8 1999—2017年间Nino 3.4指数和南海主要岛礁(7~9R)海面叶绿素浓度背景值(a)以及岛礁邻近区(1~3R)海面叶绿素浓度异常值和总浓度值的变化曲线(b)a中高于虚线温度区间的数值代表El Niño事件(红色箭头), 低于该区间的为La Niña事件(蓝色箭头) Fig. 8 Multi-year (1999-2017) Nino 3.4 index and annual averages of background (7~9R) CHL of typical islands and reefs in the SCS (a), CHL anomaly, and total CHL (= a+b) in adjacent reef areas (1~3R) (b) |
| 1 |
陈楚群, 施平, 毛庆文 , 2001. 南海海域叶绿素浓度分布特征的卫星遥感分析[J]. 热带海洋学报, 20(2):66-70.
|
| 2 |
高永利, 黄晖, 练健生 , 等, 2014. 西沙群岛礁栖鱼类物种多样性及其食性特征[J]. 生物多样性, 22(5):618-623.
|
| 3 |
古园园, 王静, 储小青 , 等, 2017. 夏季南海西部叶绿素浓度高值带的年际变化[J]. 海洋学报, 39(6):1-9.
|
| 4 |
贾丹丹, 陈正华, 张威 , 等, 2018. 南海珊瑚礁区34年卫星遥感海表温度变化的时空特征分析[J]. 海洋学报, 40(3):112-120.
|
| 5 |
李永振, 史赟荣, 艾红 , 等, 2011. 南海珊瑚礁海域鱼类分类多样性大尺度分布格局[J]. 中国水产科学, 18(3):619-628.
|
| 6 |
刘昕, 王静, 程旭华 , 等, 2012. 南海叶绿素浓度的时空变化特征分析[J]. 热带海洋学报, 31(4):42-48.
|
| 7 |
聂宝符, 陈特固, 梁美桃 , 等, 1997. 南沙群岛及其邻近礁区造礁珊瑚与环境变化的关系[M]. 北京: 科学出版社: 5-28.
|
| 8 |
王雪辉, 杜飞雁, 林昭进 , 等, 2011. 西沙群岛主要岛礁鱼类物种多样性及其群落格局[J]. 生物多样性, 19(4):463-469.
|
| 9 |
谢石建, 朱首贤, 马疆 , 等, 2015. 基于NAO.99b资料对南海主要岛礁潮汐特征的分析[J]. 解放军理工大学学报(自然科学版), 16(6):593-599.
|
| 10 |
余克服, 蒋明星, 程志强 , 等, 2004. 涠洲岛42年来海面温度变化及其对珊瑚礁的影响[J]. 应用生态学报, 15(3):506-510.
|
| 11 |
赵辉, 唐丹玲, 王素芬 , 2005. 南海西北部夏季叶绿素a浓度的分布特征及其对海洋环境的响应[J]. 热带海洋学报, 24(6):31-37.
|
| 12 |
|
| 13 |
|
| 14 |
|
| 15 |
|
| 16 |
|
| 17 |
|
| 18 |
|
| 19 |
|
/
| 〈 |
|
〉 |
