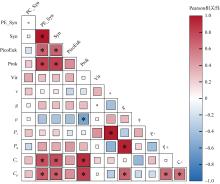
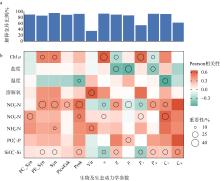
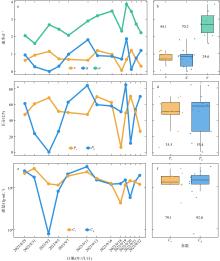
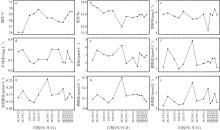
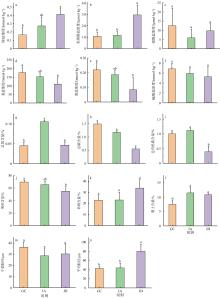
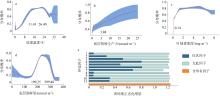
热带海洋学报
首页
期刊信息
期刊介绍
编委会
数据库收录
出版范围
学术伦理
获奖情况
费用与稿酬标准
开放获取出版政策
在线期刊
当期目录
全年目录
最新录用
过刊浏览
专题
摘要点击排行
全文下载排行
下载次数查询
引用排行
作者中心
投稿须知
论文模版
常见问题
地图审核
版权协议转让
稿件进度查询
在线投稿
审稿流程
审稿中心
审稿政策
主编审稿
编委审稿
专家审稿
编辑登录
下载中心
期刊订阅
联系我们
English
检索
E-mail
RSS
作者投稿
主编审稿
专家审稿
远程编辑
图/表 说明
高级检索
期刊
DOI
请选择
热带海洋学报
起始年
结束年
请选择
2009
2010
2011
2012
2013
2014
2015
2016
2017
2018
2019
2020
2021
2022
请选择
2022
2021
2020
2019
2018
2017
2016
2015
2014
2013
2012
2011
2010
2009
卷
期
作者
作者单位
期刊
出版年
Fig. 8
PCA analysis of the environmental parameter in the mangroves during the dry and wet season
Fig. 7
Dendrogram based on Ward's method, clustering of the sample sites based on trophic state in the mangroves during the wet season
Fig. 6
Dendrogram based on Ward's method, clustering of the sample sites based on trophic state in the mangroves during the dry season
Fig. 5
Spatiotemporal variations in algal cell abundance across the mangroves during dry and wet season. Cells abundance data is given in ×10
6
cells·L
-1
Fig. 4
The spatiotemporal distribution of trophic state index in the mangroves
Fig. 3
Variations in micronutrient (mg·L
-1
) and Chl a (mg·m
-3
) concentration during the dry and wet season
Tab. 2 Pearson correlation coefficient of environmental parameters in the mangroves during the wet season (n = 23) and dry season (n = 30)
Tab. 1 Spatiotemporal variation and T-test evaluation of environmental parameters during dry season (n = 30) and wet season (n = 23) in the mangroves
Fig. 2
Algal bloom on the floor of mangrove forest (Avicennia marina) around Peninsula and mid part of the Guangdong coast exposed during low tide. (a) Long term severe environmental pollution result in the mangrove plant death; (b) A. marina bed covered with algal bloom due to the long term nutrient enrichment
Fig. 1
The location map of the study areas along the Guangdong coast. The map review number is given as GS (2019) 3333
图1
胚轴鲜重-生长高(a)和胚轴鲜重-净生物量(b)拟合曲线
表8 秋茄胚轴性状的主成分得分和综合得分
表7 秋茄胚轴性状的主成分载荷矩阵及方差贡献率
表6 秋茄胚轴与幼苗生长性状间的相关系数
表5 不同鲜重等级胚轴的秋茄幼苗生长表现
表4 不同鲜重等级胚轴的营养成分组成比例
表3 不同鲜重等级胚轴的个体平均营养成分含量
表2 不同鲜重等级胚轴的营养成分百分含量
表1 不同鲜重等级胚轴的形态特征指标
图5
重金属胁迫下各生理生化指标的PCA分析
跳至
页
第1页
共202页
共4034条记录
首页
上一页
下一页
尾页