
Journal of Tropical Oceanography >
Remote sensing retrieval of chlorophyll-a concentration in coastal aquaculture area of Zhelin Bay
Received date: 2019-11-06
Request revised date: 2020-03-24
Online published: 2020-04-01
Supported by
Key Special Project for Introduced Talents Team of Southern Marine Science and Engineering Guangdong Laboratory(Guangzhou)(GML2019ZD0301)
Guangdong Science and Technology Plan Project(2015A020216021)
The National Natural Science Foundation of China(41876204)
Copyright
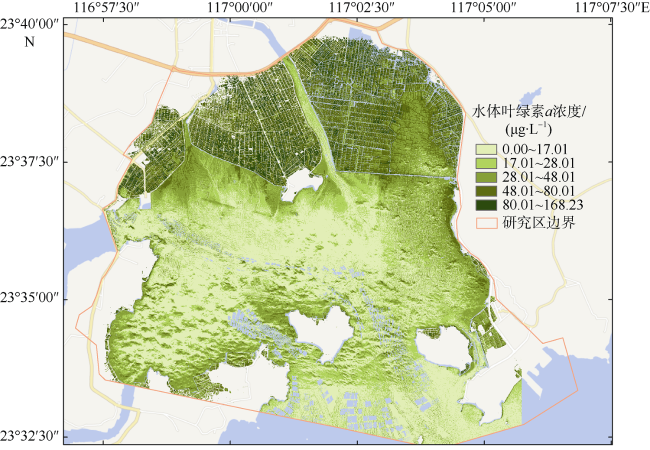
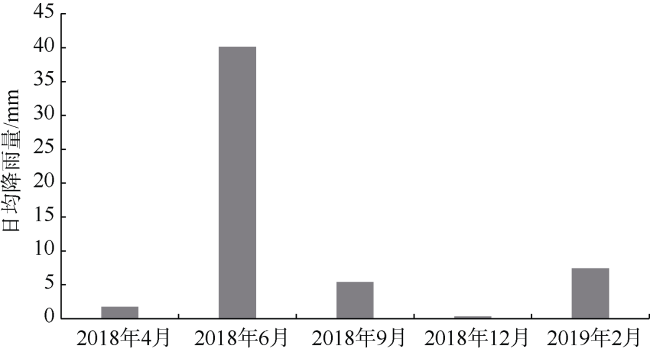
Mariculture has become a major source of pollution in offshore waters. Chlorophyll-a, as a parameter of primary productivity, is an important indicator of water quality evaluation. We took Zhelin Bay of Guangdong Province as our study area. Using Sentinel-2 spectral image on September 4, 2018 and in-situ measured chlorophyll-a concentration, we constructed an estimation model of chlorophyll-a concentration to obtain the spatial distribution of chlorophyll-a concentration. In the chlorophyll-a concentration inversion model, we selected a linear regression model, a three-band model and the Normalized Difference Chlorophyll Index (NDCI) for comparative analysis. Through comparison and evaluation, a model with high inversion accuracy was used to estimate the chlorophyll-a concentration in multiple months of 2018 and analyze its distribution characteristics. The results showed that the inversion accuracy of the NDCI model was significantly higher than that of the other models. The decision coefficient R2 of the NDCI model was 0.8, the root mean square error (RMSE) was 9.7, and the mean absolute percentage error (MAPE) was 0.99. The time applicability of the NDCI model was tested by the measured data, which showed that the NDCI model could more accurately and effectively estimated the spatial distribution characteristics of chlorophyll-a concentration. The chlorophyll-a concentration showed a trend of decreasing from nearshore to the outside of the bay. The overall trend of chlorophyll-a concentration in the aquaculture area was as follows: pond breeding area > tidal flat breeding area > cage culture area > floating raft breeding area. Under the influence of water exchange, rainfall and culture activities, the concentration of chlorophyll-a in the culture area of the fish pond was the lowest in February when the fish was in the seedling stage, and its change trend was February < April < June < December. This study provides a valuable reference for environmental monitoring of marine aquaculture waters in Zhelin Bay.
PAN Cuihong , XIA Lihua , WU Zhifeng , WANG Meng , XIE Xuetong , WANG Fang . Remote sensing retrieval of chlorophyll-a concentration in coastal aquaculture area of Zhelin Bay[J]. Journal of Tropical Oceanography, 2021 , 40(1) : 142 -153 . DOI: 10.11978/2019110
图1 研究区养殖类型分布示意图底图来源于天地图在线地图(https://map.tianditu.gov.cn/) Fig. 1 Overview of the study area and the distribution of aquaculture type areas |
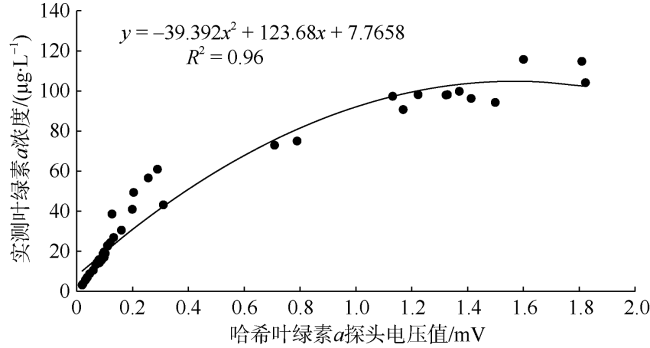
图2 哈希叶绿素a探头电压值与实测叶绿素a浓度的相关关系Fig. 2 Linear relationship between voltage value of chlorophyll-a probe and measured chlorophyll-a concentration |
表1 各样本叶绿素a浓度统计结果Tab. 1 Statistical results of chlorophyll-a concentration of the samples |
| 养殖类型 | 样本 | 浓度范围/(μg·L-1) | 平均浓度/(μg·L-1) |
|---|---|---|---|
| 池塘养殖区 | A20, A21, A22, A23, A25, A26, A39, A27, A30, A31, A29, A35, A45, A34, A24, A46, A37, A38, A43 | 15.63~115.78 | 77.67 |
| 牡蛎养殖区 | A9, A28, A33, A40, A42, A44, A36, A47 | 5.56~56.6 | 24.92 |
| 网箱养殖区 | A2, A3, A8, A11, A12, A13, A14, A16 | 3.66~38.62 | 16.55 |
| 浮筏养殖区 | A4, A5, A6, A17, A18, A19 | 3.18~26.90 | 15.94 |
| 非养殖区 | A1, A7, A10, A15, A32, A41 | 3.22~14.25 | 7.87 |
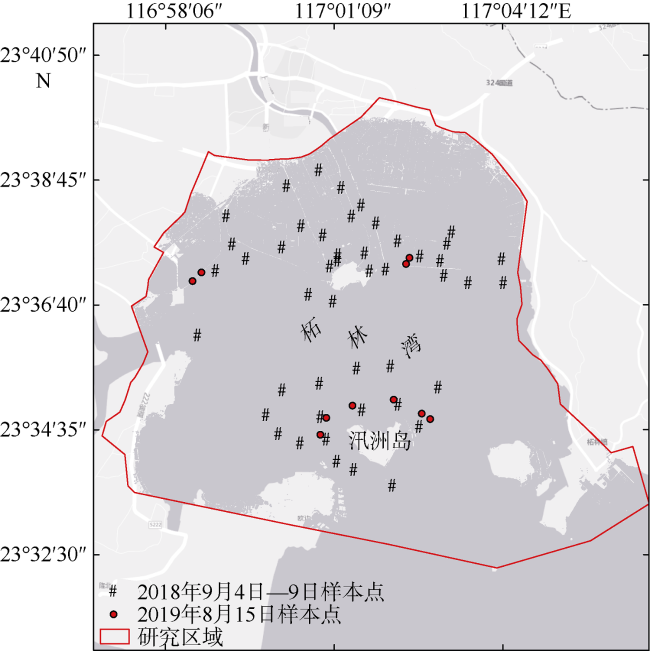
图3 样本点分布底图来源于OpenStreet在线地图(https://osm-boundaries.com/ Map) Fig. 3 Distribution of sampling sites (background image from OpenStreet online map: https://osm-boundaries.com/ Map) |
表2 Sentinel-2影像波段介绍Tab. 2 Introduction to sentinel-2 image bands |
| Sentinel-2波段 | 中心波长/nm |
|---|---|
| 波段1(海岸线气溶胶) | 443 |
| 波段2(蓝) | 490 |
| 波段3(绿) | 556 |
| 波段4(红) | 665 |
| 波段5(植被红边) | 705 |
| 波段6(植被红边) | 740 |
| 波段7(植被红边) | 783 |
| 波段8(近红外) | 842 |
| 波段8a(植被红边) | 865 |
| 波段9(水汽) | 945 |
| 波段10(短波-卷云) | 1375 |
| 波段11(短波1) | 1610 |
| 波段12(短波2) | 2190 |
表3 用于本次研究的柘林湾Sentinel-2影像信息Tab. 3 Sentinel-2 image information in the study of Zhelin Bay |
| 序号 | 数据类型 | 成像时间 | 备注 |
|---|---|---|---|
| 1 | S2B_MSIL1C | 2018-04-02 | 0.74%, 无云 |
| 2 | S2B_MSIL1C | 2018-06-11 | 4.44%, 无云 |
| 3 | S2A_MSIL1C | 2018-09-04 | 8.644%, 少量云 |
| 4 | S2B_MSIL2A | 2018-12-18 | 0.0%, 无云 |
| 5 | S2B_MSIL2A | 2019-02-06 | 0.0%, 无云 |
| 6 | S2B_MSIL2A | 2019-08-15 | 26.42%, 少量云 |
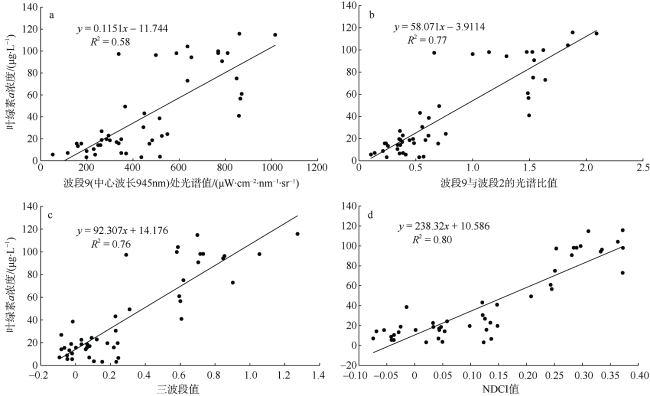
图5 叶绿素a浓度反演模型a. 单波段模型; b. 比值模型; c. 三波段模型; d. NDCI模型 Fig. 5 Various chlorophyll-a inversion models: (a) single band model, (b) the ratio of the model, (c) three-band model, and (d) NDCI model |
表4 不同叶绿素a浓度反演模型的精度对比Tab. 4 Accuracy comparison of different chlorophyll-a inversion models |
| 模型 | 线性表达式 | x变量 | R2 | RMSE | MAPE | MAE |
|---|---|---|---|---|---|---|
| 单波段模型 | y=0.1151x-11.744 | $ R_{(945 \mathrm{nm})}$ | 0.58 | 15.55 | 1.06 | 12.24 |
| 比值模型 | y=58.071x-3.9114 | $ \frac{R_{(945 \mathrm{nm})}}{R_{(495 \mathrm{nm})}}$ | 0.77 | 10.70 | 0.75 | 7.98 |
| 三波段模型 | y=92.307x+14.176 | $ \left[\frac{1}{R_{(665 \mathrm{nm})}}-\frac{1}{R_{(705 \mathrm{nm})}}\right] \times R_{(740 \mathrm{nm})}$ | 0.76 | 9.95 | 1.27 | 5.70 |
| NDCI模型 | y= 238.32x+10.586 | $ \frac{R_{(705 \mathrm{nm})}-R_{(665 \mathrm{nm})}}{R_{(665 \mathrm{nm})}+R_{(705 \mathrm{nm})}}$ | 0.80 | 9.70 | 0.99 | 7.75 |
表5 各模型反演2019年8月15日叶绿素a浓度的精度对比Tab. 5 Accuracy comparison of chlorophyll-a concentration on August 15, 2019 estimated by various models |
| 模型 | RMSE | MAPE | MAE | SD |
|---|---|---|---|---|
| 单波段模型 | 42.79 | 14.14 | 42.33 | 8.11 |
| 比值模型 | 16.51 | 5.93 | 16.38 | 3.41 |
| 三波段模型 | 6.92 | 2.62 | 6.46 | 2.92 |
| NDCI模型 | 3.29 | 0.52 | 2.19 | 4.85 |
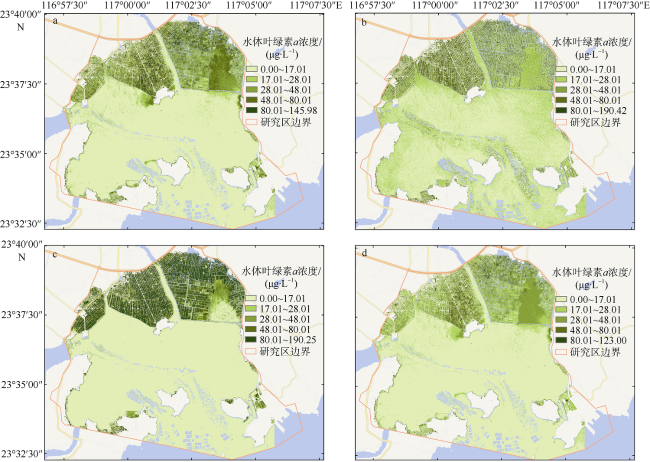
图7 2018年4月(a)、6月(b)、12月(c)与2019年2月(d)叶绿素a浓度的NDCI模型估算结果Fig. 7 NDCI model-estimated the results of chlorophyll-a concentration in April (a), June (b), and December (c) of 2018 and February 2019 (d) |
表6 不同时间各养殖类型区的叶绿素a平均浓度Tab. 6 Average chlorophyll-a concentration of each culture type at different times |
| 时间 | 鱼塘养殖区平均浓度/(μg·L-1) | 牡蛎养殖区平均浓度/(μg·L-1) | 网箱养殖区平均浓度/(μg·L-1) | 浮筏养殖区平均浓度/(μg·L-1) | 非养殖水体平均浓度/(μg·L-1) |
|---|---|---|---|---|---|
| 2018年4月 | 45.65 | 18.10 | 3.81 | 5.39 | 4.12 |
| 2018年6月 | 40.19 | 17.61 | 12.65 | 14.96 | 14.08 |
| 2018年9月 | 65.52 | 31.17 | 19.38 | 16.25 | 14.26 |
| 2018年12月 | 75.54 | 17.08 | 18.54 | 17.12 | 12.54 |
| 2019年2月 | 34.49 | 10.28 | 9.71 | 9.11 | 5.50 |
| [1] |
安如, 刘影影, 曲春梅, 等, 2013. NDCI法Ⅱ类水体叶绿素a浓度高光谱遥感数据估算[J]. 湖泊科学, 25(3):437-444.
|
| [2] |
蔡玉婷, 2010. 福建近海叶绿素a和初级生产力的分布特征[J]. 农业环境科学学报, 29(S1):174-179.
|
| [3] |
陈楚群, 施平, 毛庆文, 1996. 应用TM数据估算沿岸海水表层叶绿素浓度模型研究[J]. 环境遥感, 11(3):168-176.
|
| [4] |
陈学民, 韩冰, 王莉莉, 等, 2013. 青海湖总磷、水温及矿化度与叶绿素a相关性分析[J]. 农业环境科学学报, 32(2):333-337.
|
| [5] |
陈永川, 汤利, 张德刚, 等, 2008. 滇池叶绿素a的时空变化及水体磷对藻类生长的影响[J]. 农业环境科学学报, 27(4):1555-1560.
|
| [6] |
广东省海洋与渔业厅, 2018. 2017年广东省海洋环境状况公报[R] (in Chinese).
|
| [7] |
郭宇龙, 李云梅, 李渊, 等, 2015. 一种基于GOCI数据的叶绿素a浓度三波段估算模型[J]. 环境科学, 36(9):3175-3185.
|
| [8] |
黄长江, 董巧香, 吴常文, 等, 2005. 大规模增养殖区柘林湾叶绿素a的时空分布[J]. 海洋学报, 27(2):127-134.
|
| [9] |
蒋丹丹, 原娟, 武文娟, 等, 2019. 基于Sentinel-2卫星影像的面向对象城市水体提取[J]. 地理空间信息, 17(5):10-13.
|
| [10] |
江源, 彭秋志, 廖剑宇, 等, 2013. 浮游藻类与河流生境关系研究进展与展望[J]. 资源科学, 35(3):461-472.
|
| [11] |
李苗, 臧淑英, 吴长山, 2012. 基于TM影像的克钦湖叶绿素a浓度反演[J]. 农业环境科学学报, 31(12):2473-2479.
|
| [12] |
李亭亭, 2018. 基于时序遥感数据的水环境时空采样布局优化方法研究——以鄱阳湖叶绿素为例[D]. 武汉: 武汉大学.
|
| [13] |
李修竹, 苏荣国, 张传松, 等, 2019. 基于支持向量机的长江口及其邻近海域叶绿素a浓度预测模型[J]. 中国海洋大学学报, 49(1):69-76.
|
| [14] |
骆剑承, 盛永伟, 沈占锋, 等, 2009. 分步迭代的多光谱遥感水体信息高精度自动提取[J]. 遥感学报, 13(4):604-615.
|
| [15] |
罗建美, 霍永伟, 韩晓庆, 2017. 基于HJ卫星的近岸Ⅱ类水体叶绿素a浓度定量遥感反演研究——以滦河口北部海域为例[J]. 海洋学报, 39(4):117-129.
|
| [16] |
欧素英, 罗凯文, 田枫, 2016. 柘林湾多口门潮汐汊道动力地貌的演变[J]. 热带海洋学报, 35(2):83-92.
|
| [17] |
潘应阳, 国巧真, 孙金华, 2017. 水体叶绿素a浓度遥感反演方法研究进展[J]. 测绘科学, 42(1):43-48.
|
| [18] |
宋挺, 周文鳞, 刘军志, 等, 2017. 利用高光谱反演模型评估太湖水体叶绿素a浓度分布[J]. 环境科学学报, 37(3):888-899.
|
| [19] |
孙伟, 2008. 青岛近岸海域叶绿素a与初级生产力调查研究[D]. 青岛: 中国海洋大学.
|
| [20] |
孙小涵, 胡连波, 冯永亮, 等, 2018. 基于HJ-1卫星数据的荣成湾叶绿素a浓度时空变化特征分析[J]. 海洋湖沼通报, (5):72-79.
|
| [21] |
王金梁, 秦其明, 李军, 等, 2014. 基于高光谱数据的水体叶绿素a指数反演模型的建立[J]. 农业工程学报, 30(3):128-134.
|
| [22] |
王增焕, 林钦, 李纯厚, 等, 2004. 广东东部重要渔业水域叶绿素变化特征的研究[J]. 海洋环境科学, 23(3):51-54.
|
| [23] |
魏复盛, 2002. 水和废水监测分析方法[M].4版. 北京: 中国环境科学出版社.
|
| [24] |
闻建光, 肖青, 杨一鹏, 等, 2007. 基于高光谱数据提取水体叶绿素a浓度的混合光谱模型[J]. 水科学进展, 18(2):270-276.
|
| [25] |
吴仪, 邓孺孺, 秦雁, 等, 2017. 新丰江水库叶绿素浓度时空分布特征的遥感反演研究[J]. 遥感技术与应用, 32(5):825-834.
|
| [26] |
杨凡, 杨正健, 纪道斌, 等, 2019. 三峡库区不同河段支流丰水期叶绿素a和营养盐的空间分布特征[J]. 环境科学学报, 40(11):4944-4952.
|
| [27] |
杨树文, 薛重生, 刘涛, 等, 2010. 一种利用TM影像自动提取细小水体的方法[J]. 测绘学报, 39(6):611-617.
|
| [28] |
张明慧, 苏华, 季博文, 2018. MODIS时序影像的福建近岸叶绿素a浓度反演[J]. 环境科学学报, 38(12):4831-4839.
|
| [29] |
赵文静, 曹文熙, 胡水波, 等, 2018. 南海典型海区浮游植物吸收光谱特征及遥感反演产品的精度评估[J]. 热带海洋学报, 37(3):35-44.
|
| [30] |
周小莉, 郭加伟, 刘锟铭, 2016. 基于陆地成像仪影像和主成分分析的水体信息提取——以鄱阳湖区为例[J]. 激光与光电子学进展, 53(8):080104.
|
| [31] |
朱小山, 吴玲玲, 杨瑶, 等, 2005. 粤东柘林湾增养殖区氮磷的分布特征及其富营养化状态评价[J]. 海洋湖沼通报, 5(3):16-22.
|
| [32] |
|
| [33] |
|
| [34] |
|
| [35] |
|
| [36] |
|
| [37] |
|
| [38] |
|
| [39] |
|
| [40] |
|
| [41] |
|
/
| 〈 |
|
〉 |

