
Journal of Tropical Oceanography >
Temporal and spatial patterns of dust deposition in the North Pacific Ocean and its potential impact on ecosystem in the subarctic ocean
Received date: 2020-01-15
Request revised date: 2020-03-07
Online published: 2020-04-01
Supported by
National Natural Science Foundation of China(41730536)
Copyright
As one of the three high nutrient and low chlorophyll (HNLC) regions in the global oceans, the growth of phytoplankton in the subarctic North Pacific Ocean is restricted by the trace element iron, which plays an important role in nitrogen fixation, photosynthesis and metabolism of phytoplankton. For an open ocean, atmospheric deposition (atmospheric pollutants produced by human activities as well as dust) is an important source of iron, which can impact biological activities in the upper layer of the ocean. In this study, we use the daily-averaged atmospheric deposition model outputs from the Spectral Radiation-Transport Model for Aerosol Species (SPRINTARS) for the period between December 1997 and November 2017, to quantify the flux of atmospheric deposition in the North Pacific Ocean and the corresponding spatial and temporal variability. The results show that the annual flux of atmospheric deposition into the North Pacific Ocean is 26.81 Tg·a-1, with clear seasonal variation: high flux of atmospheric deposition flux happens during spring and peaks in May, and low values occur in winter. The spatial distribution of atmospheric deposition shows a prominent increasing from the Northwest Pacific Ocean to Northeast Pacific Ocean. In this study, we analysis the response of Particulate Organic Carbon (POC; Aug. 2010) and chlorophyll (Apr. 2001, Apr. 2008 and Aug. 2010) at station K2 (47°N, 160°E) in the Northwest Pacific Ocean to strong dust events, which are defined as the times when high flux of atmospheric decomposition happens. The results show that the POC flux and chlorophyll increase obviously after each dust event because the iron from atmospheric deposition can regulate the growth of phytoplankton and biological pump Thus, the dust events can stimulate the responses of marine ecosystem by promoting ocean primary production.
CHEN Huanhuan , WANG Yuntao , QI Yiquan , CHAI Fei . Temporal and spatial patterns of dust deposition in the North Pacific Ocean and its potential impact on ecosystem in the subarctic ocean[J]. Journal of Tropical Oceanography, 2021 , 40(1) : 21 -30 . DOI: 10.11978/2020009
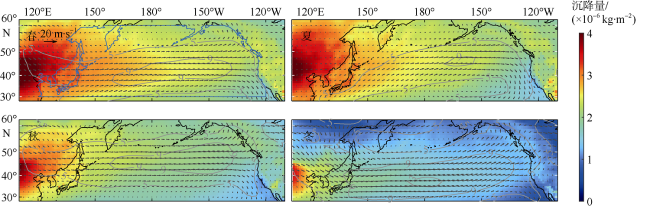
图1 1997年12月—2017年11月北太平洋海区大气沉降量(单位: 10-6kg·m-2)和850hPa平均风场的季节变化图中黑色箭头为风矢量, 灰色等值线为风速大小(单位: m·s-1); 春季时间为3—5月, 夏季时间为6—8月, 秋季时间为9—11月, 冬季时间为12月至次年2月; 春季图中的蓝线区域为本文研究区域; 沉降量选取以10为底的对数(lg)予以转换。审图号为GS(2016)1665号 Fig. 1 Seasonal distribution of dust deposition flux (shading; uints: 10-6 kg·m-2) and wind (black arrows are wind vectors, and gray contours are wind magnitude; units: m·s-1) at 850 hPa averaged over the period from December 1997 to November 2017 in the North Pacific Ocean: spring (March ~ May), summer (June ~ August), autumn (September ~ November), and winter (December ~ February). The blue line ( |
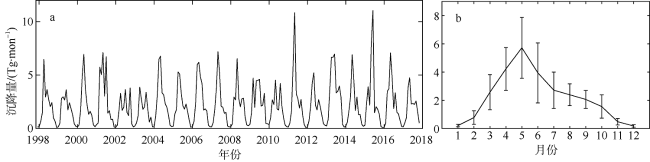
图2 1997年12月—2017年11月北太平洋区域大气沉降量的月均时间序列(a)和气候态月均时间序列及标准差(b)Fig. 2 (a) Monthly time series of dust deposition flux in the North Pacific Ocean from December 1997 to November 2017. (b) Climatological monthly average of dust deposition flux in the North Pacific Ocean (units: Tg, 1Tg=109kg) and corresponding standard deviation |
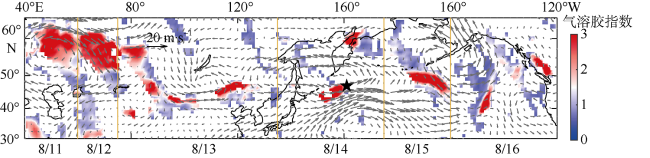
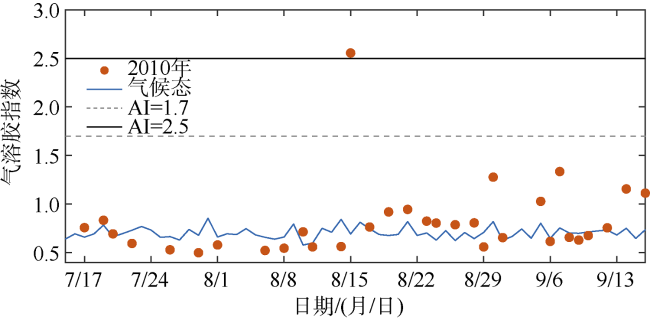
图3 2010年8月11日至16日北太平洋气溶胶指数与850hPa日均风速的时空分布图中灰色箭头为风场; 图下方数字为日期(月/日), 黄线为各日期的分界线; 黑色五角星表示K2站位。审图号为GS(2016)1665号 Fig. 3 Spatial distribution of Aerosol Index and daily wind (gray arrow; units: m·s-1) at 850 hPa from 11 August to 16 August 2010. The yellow lines delineate different days. Black pentagram indicates the location of station K2 |
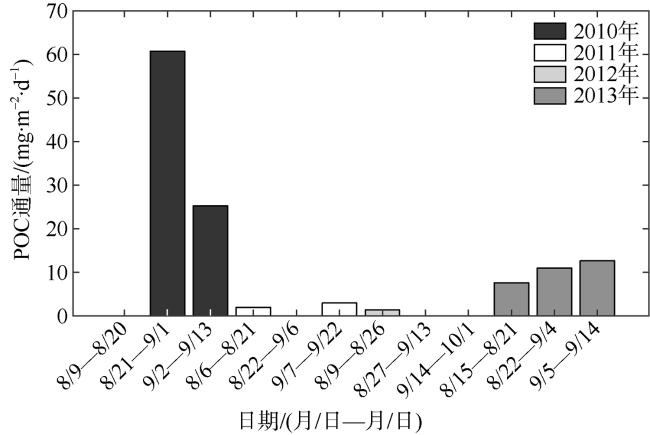
图4 2010—2013年期间K2站位8月至9月200m深度的POC通量Fig. 4 POC flux sampled by sediment traps at 200 m depth in August and September from 2010 to 2013 |
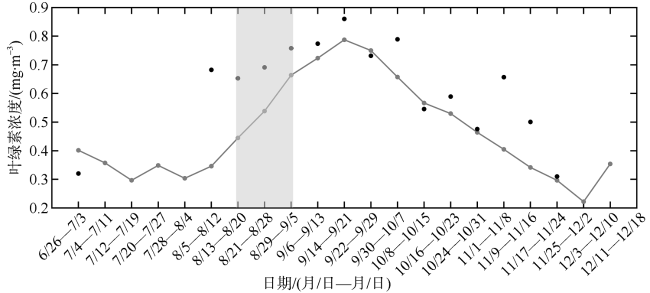
图5 K2站位2010年6—12月8天平均叶绿素浓度(黑点)与2010—2014年同期气候态叶绿素浓度(灰线)的时间序列图中浅灰色阴影区间为沙尘事件过境后的叶绿素响应时段 Fig. 5 Eight-day-averaged chlorophyll at station K2 from July to December 2010 (black dots), and climatological chlorophyll from 2010 to 2014 (gray line) calculated by satellite observations. The light gray shading represents the period of chlorophyll responses after the dust event |
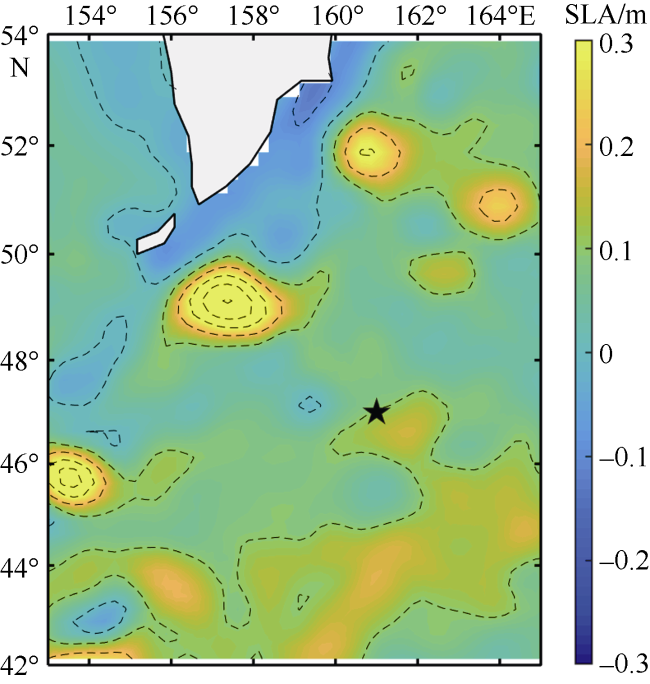
图7 2010年8月21日至9月1日的海表面高度异常(SLA)均值图中黑色五角星表示K2站位 Fig. 7 Sea-level anomaly averaged between August 21 and September 1, 2010 |
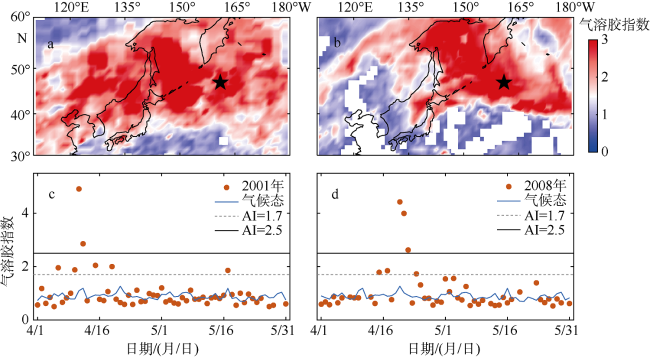
图9 2001年4月9日至12日(a)、2008年4月20日至22日(b)西北太平洋气溶胶指数的空间分布和2001年(c)、2008年(d)4—5月K2站位气溶胶指数的时间序列图中黑色五角星表示K2站位 Fig. 9 Spatial distribution of Aerosol Index (AI) (a) between April 9 and 12, 2001 and (b) between April 20 and 22, 2008. Corresponding time series of AI at station K2 from April to May in (c) 2001 and (d) 2008 |
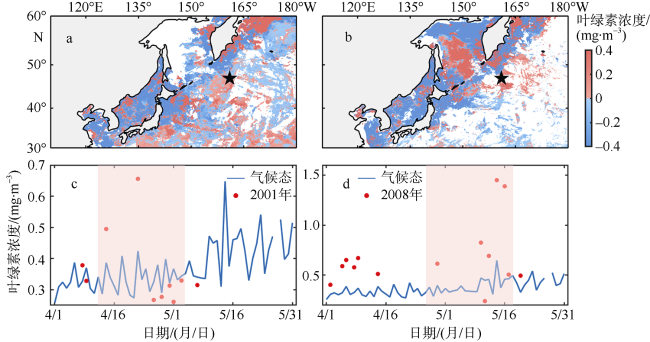
图10 2001年4月14日至5月4日(a)、2008年4月25日至5月15日(b)平均叶绿素浓度相对于同期气候态下的变化量空间分布和2001年(c)、2008年(d)4—5月K2站位叶绿素浓度的时间序列图a、b中的黑色五角星表示K2站位; 图c、d中的粉色阴影区间为沙尘事件过境后的叶绿素响应时段 Fig. 10 Spatial distribution of chlorophyll differences of the averaged from (a) April 14 to May 14, 2001; (b) April 25 to May 15, 2008; and corresponding average of climatology. Time series of chlorophyll at station K2 from April to May in (c) 2001 and (d) 2008, and corresponding climatology. The pink shading represents the period of chlorophyll responses after the dust event |
| [1] |
陈建芳, 郑连福,
|
| [2] |
丛丕福, 牛铮, 蒙继华, 等, 2006. 1998~2003年卫星反演的中国陆架海叶绿素a浓度变化分析[J]. 海洋环境科学, 25(1):30-33.
|
| [3] |
董泰锋, 蒙继华, 吴炳方, 等, 2011. 光合有效辐射(PAR)估算的研究进展[J]. 地理科学进展, 30(9):1125-1134.
|
| [4] |
金海燕, 林以安, 陈建芳, 等, 2005. 黄海、东海颗粒有机碳的分布特征及其影响因子分析[J]. 海洋学报, 27(5):46-53.
|
| [5] |
刘荣高, 刘纪远, 庄大方, 2004. 基于MODIS数据估算晴空陆地光合有效辐射[J]. 地理学报, 59(1):64-73.
|
| [6] |
马翱慧, 刘湘南, 李婷, 等, 2013. 南海北部海域叶绿素a浓度时空特征遥感分析[J]. 海洋学报, 35(4):98-105.
|
| [7] |
|
| [8] |
|
| [9] |
|
| [10] |
|
| [11] |
|
| [12] |
|
| [13] |
|
| [14] |
|
| [15] |
|
| [16] |
|
| [17] |
|
| [18] |
|
| [19] |
|
| [20] |
|
| [21] |
|
| [22] |
|
| [23] |
|
| [24] |
|
| [25] |
|
| [26] |
|
| [27] |
|
| [28] |
|
| [29] |
|
| [30] |
|
| [31] |
|
| [32] |
|
| [33] |
|
| [34] |
|
| [35] |
|
| [36] |
|
| [37] |
|
| [38] |
|
| [39] |
|
| [40] |
|
| [41] |
|
| [42] |
|
| [43] |
|
| [44] |
|
| [45] |
|
/
| 〈 |
|
〉 |
