
Journal of Tropical Oceanography >
Study on the correction of SST prediction in South China Sea using remotely sensed SST
Copy editor: LIN Qiang
Received date: 2019-12-09
Request revised date: 2020-03-29
Online published: 2020-04-09
Supported by
National Key Research and Development Program of China(2017YFC1404700)
Special Project for Economic Development of Guangdong(GDME-2018B001)
Copyright
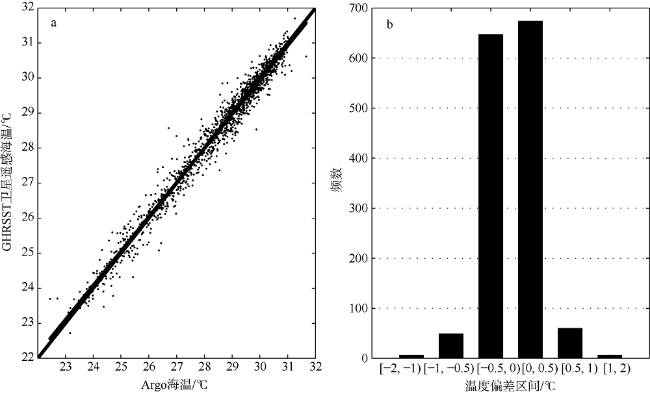
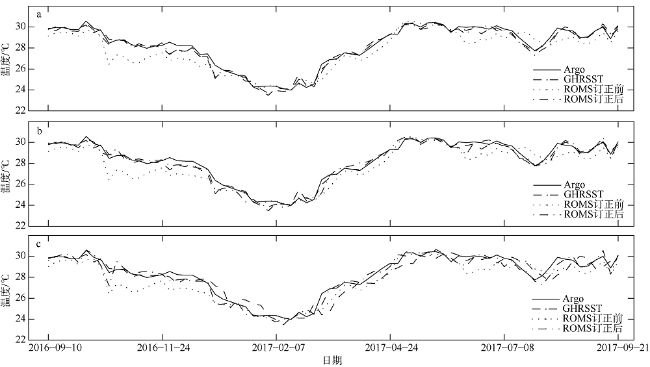
A new error-correction forecast model for sea surface temperature (SST) is proposed in this paper, where the SST errors are derived from the Group for High Resolution Sea Surface Temperature (GHRSST) data and operational numerical prediction SST product. First of all, the reliability of the GHRSST data was validated with the upper temperature data of Argo floats in the South China Sea. The results showed that the Root Mean Square Error (RMSE) between the two sets of data was about 0.3℃ while the correlation coefficient was 0.98; the GHRSST data could be used for the correction of operational numerical forecast model on SST in the South China Sea. After being corrected, the RMSEs of 24-hr, 48-hr and 72-hr SST forecast results were dropped from 0.8 ℃ to 0.5 ℃ compared with the upper temperature data of Argo floats. Meanwhile, the 24-hr, 48-hr and 72-hr SST forecast errors between the GHRSST data and model results were significantly reduced after the correction in the northern South China Sea (110°E -121°E, 13°N -23°N). During the influence of the cold air or the mesoscale eddy in the South China Sea, the effect of SST forecast correction was also quite significant. Therefore, this method should be considered to apply in the operational numerical forecast system on SST in the South China Sea.
Key words: SST; Operational numerical prediction; Error correction; GHRSST; Argo; South China Sea
ZHANG Peijun , ZHOU Shuihua , LIANG Changxia . Study on the correction of SST prediction in South China Sea using remotely sensed SST[J]. Journal of Tropical Oceanography, 2020 , 39(6) : 57 -65 . DOI: 10.11978/2019128
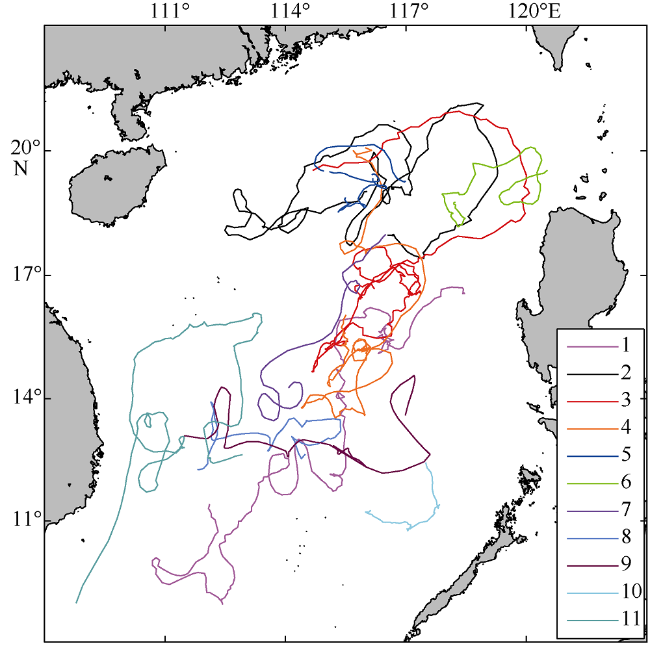
表1 Argo浮标编号及时间分布Tab. 1 The id numbers and time distributions of Argo profiling buoys |
| 序号 | 浮标编号 | 时间分布 |
|---|---|---|
| 1 | 2901479 | 2016-05-03—2019-02-05 |
| 2 | 2901480 | 2016-04-27—2018-09-08 |
| 3 | 2901481 | 2016-04-28—2019-02-20 |
| 4 | 2902045 | 2015-09-10—2017-07-05 |
| 5 | 2902056 | 2016-04-27—2016-10-22 |
| 6 | 2902692 | 2016-09-12—2017-09-18 |
| 7 | 2902694 | 2016-09-10—2017-09-21 |
| 8 | 2902744 | 2017-11-22—2019-01-16 |
| 9 | 2902745 | 2017-11-22—2019-02-15 |
| 10 | 5904539 | 2015-11-08—2016-05-30 |
| 11 | 5904747 | 2016-05-03—2018-01-13 |
表2 浮标位置上预报SST订正前后与浮标海温的均方根误差和相关系数Tab. 2 The RMSE and correlation coefficient between SST forecast and Argo SST in buoy position before and after correction |
| 均方根误差 | 相关系数 | |||
|---|---|---|---|---|
| 订正前 | 订正后 | 订正前 | 订正后 | |
| 24h | 0.85 | 0.36 | 0.94 | 0.98 |
| 48h | 0.84 | 0.42 | 0.94 | 0.98 |
| 72h | 0.86 | 0.46 | 0.94 | 0.97 |
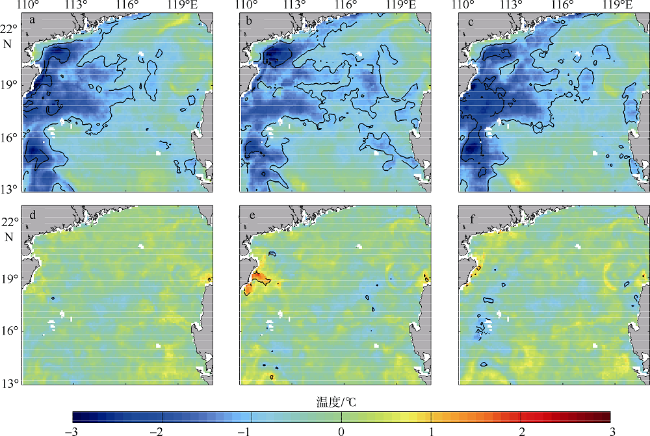
图4 2018年1月1日起报的南海北部预报与观测温度差异空间分布a—c分别为24、48和72h订正前; d—f为24、48和72h订正后 Fig. 4 Spatial distribution of temperature biases between forecast and observation from GHRSST at initial forecast time from January 1, 2018. (a, b and c) Results before correction; (d, e and f) results after correction |
图5 2018年7月20日起报的南海北部预报与观测温度差异空间分布a—c分别为24、48和72h订正前; d—f为24、48和72h订正后 Fig. 5 Spatial distribution of temperature biases between forecast and observation from GHRSST at initial forecast time from July 20, 2018. (a, b and c) Results before correction; (d, e and f) results after correction |
图6 2017年12月1日起报的南海北部预报与观测温度差异空间分布a—c分别为24、48和72h订正前; d—f为24、48和72h订正后 Fig. 6 Spatial distribution of temperature biases between forecast and observation from GHRSST at initial forecast time from December 1, 2017. (a, b and c) Results before correction; (d, e and f) results after correction |
图8 2016年6月26日起报的南海北部预报与观测温度差异空间分布a—c分别为24、48和72h订正前; d—f为24、48和72h订正后 Fig. 8 Spatial distribution of temperature biases between forecast and observation from GHRSST at initial forecast time from June 26, 2016. (a, b and c) Results before correction; (d, e and f) results after correction |
| [1] |
堵盘军, 王丽琳, 管琴乐, 等, 2013. 人机交互式台风浪业务预报系统的研制及应用[J]. 中国海洋大学学报, 43(10):16-24.
|
| [2] |
韩玉康, 余丹丹, 申晓莹, 等, 2018. HYCOM模式SST的预报误差订正[J]. 海洋预报, 35(3):76-80.
|
| [3] |
胡波, 杜惠良, 郝世峰, 等, 2014. 一种统计技术结合动力释用的沿海海雾预报方法[J]. 海洋预报, 31(5):82-86.
|
| [4] |
胡春梅, 余晖, 陈佩燕, 2006. 西北太平洋热带气旋强度统计释用预报方法研究[J]. 气象, 32(8):64-69.
|
| [5] |
匡晓迪, 王兆毅, 张苗茵, 等, 2016. 基于BP神经网络方法的近岸数值海温预报释用技术[J]. 海洋与湖沼, 47(6):1107-1115.
|
| [6] |
李佰平, 智协飞, 2012. ECMWF模式地面气温预报的四种误差订正方法的比较研究[J]. 气象, 38(8):897-902.
|
| [7] |
李娟, 左军成, 李艳芳, 等, 2011. 南海海表温度的低频变化及影响因素[J]. 河海大学学报(自然科学版), 39(5):575-582.
|
| [8] |
李江萍, 王式功, 2008. 统计降尺度法在数值预报产品释用中的应用[J]. 气象, 34(6):41-45.
|
| [9] |
李云, 万莉颖, 刘钦政, 2011. 卫星高度计资料在三维海温和盐度数值预报中的应用[J]. 海洋学报, 33(6):64-72.
|
| [10] |
毛庆文, 储小青, 严幼芳, 等, 2013. 南海三维动态温盐场重构系统的设计与实现[J]. 热带海洋学报, 32(6):1-8.
|
| [11] |
邱春华, 崔永生, 胡诗琪, 等, 2017. 基于融合遥感数据的广东沿岸温度锋面的季节变化研究[J]. 热带海洋学报, 36(5):16-23.
|
| [12] |
|
| [13] |
|
| [14] |
|
| [15] |
|
| [16] |
|
| [17] |
|
| [18] |
|
| [19] |
|
/
| 〈 |
|
〉 |


