
Journal of Tropical Oceanography >
Assessment of eastern Pacific ITCZ dipole mode simulations by CMIP5 models
Received date: 2020-03-28
Request revised date: 2020-04-19
Online published: 2020-04-24
Supported by
National Key Research and Development Program of China(2018YFA0605700)
National Natural Science Foundation of China(41975092)
Copyright
Based on the Pre-industrial Control (picontrol) experiments from 24 Coupled Model Intercomparison Project (CMIP5) models, we assessed these models’ capability in simulating the eastern Pacific ITCZ dipole (EPID) mode and its linkage with models’ climatological simulation capability. The main results are as follows. (1) Most of the CMIP5 models cannot well reproduce the spatial pattern of the EPID mode in February-April (FMA), because of the common biases of modeled Intertropical Convergence Zone (ITCZ), which is mainly located south of the equator during FMA. (2) After seasonal adjustment according to the highest skillscore of EPID mode, the spatial distribution of the EPID mode in most models is more consistent with that in observations. The models with skillscore above 0.7 can simulate the "double ITCZ" climatological precipitation feature during the EPID season. Additionally, the error of the multi-model ensemble (MME) is smaller than that of most CMIP5 models.
Key words: Eastern Pacific ITCZ dipole mode; CMIP5 models; double ITCZ bias
LI Fuzi , ZHENG Xiaotong . Assessment of eastern Pacific ITCZ dipole mode simulations by CMIP5 models[J]. Journal of Tropical Oceanography, 2021 , 40(1) : 44 -57 . DOI: 10.11978/2020034
图1 2—4月热带东太平洋降水异常EOF结果及与ENSO的关系a. 第一主模态空间场(解释方差为54%); b. EPID模态空间场(解释方差为20%); c. PC1与同期标准化ENSO序列; d. PC2与同期标准化ENSO序列; e. PC1、PC2与同期ENSO序列相关系数。图a、b中的等值线表示同期海温异常回归至标准化PC, 间隔为0.2℃, 加粗实线为0℃, 正负异常值分别用实线和虚线表示; 填色和矢量分别为同期降水量(单位: mm·d-1)和海表面风场(单位: m·s-1)异常回归至标准化PC, 蓝色箭头表示异常西风, 红色箭头表示异常东风 Fig. 1 EOF modes of FMA precipitation anomaly over the eastern tropical Pacific and the relationships between PCs and concurrent ENSO. Regressions of precipitation (mm·d-1; shading), SST (contour at interval of 0.2℃, zero contour thickened and negative dashed), and surface wind velocity (m·s-1; vector) against (a) the standardized PC1 (54% variance) and (b) the standardized PC2 (20% variance), blue (red) arrows indicate westerly (easterly) wind anomalies. Standardized PCs and concurrent ENSO indices are plotted in (c) and (d), and correlations between standardized PCs and concurrent ENSO indices are plotted in (e) |
表1 选取的CMIP5模式Tab. 1 CMIP5 models used in this study |
| 气候模式 | 研发国家 | 气候模式 | 研发国家 |
|---|---|---|---|
| ACCESS1-0 | 澳大利亚(Australia) | IPSL-CM5A-LR | 法国(France) |
| ACCESS1-3 | 澳大利亚(Australia) | IPSL-CM5A-MR | 法国(France) |
| BCC-CSM1-1 | 中国(China) | IPSL-CM5B-LR | 法国(France) |
| BNU-ESM | 中国(China) | MIROC5 | 日本(Japan) |
| CanESM2 | 加拿大(Canada) | MIROC-ESM | 日本(Japan) |
| CMCC-CM | 意大利(Italy) | MIROC-ESM-CHEM | 日本(Japan) |
| GFDL-CM3 | 美国(USA) | MPI-ESM-LR | 德国(Germany) |
| GFDL-ESM2G | 美国(USA) | MPI-ESM-MR | 德国(Germany) |
| GFDL-ESM2M | 美国(USA) | MPI-ESM-P | 德国(Germany) |
| GISS-E2-H | 美国(USA) | MRI-CGCM3 | 日本(Japan) |
| GISS-E2-R | 美国(USA) | NorESM1-M | 挪威(Norway) |
| INM-CM4 | 俄罗斯(Russia) | NorESM1-ME | 挪威(Norway) |
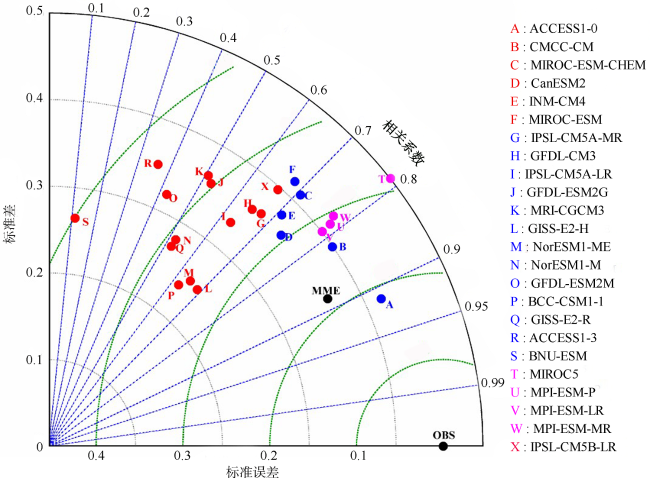
图2 CMIP5模式2—4月降水异常EOF第一模态空间分布图等值线表示同期海温异常回归至标准化PC1, 间隔为0.2℃, 加粗实线为0℃, 正负异常值分别用实线和虚线表示; 填色和矢量分别为同期降水量(单位: mm·d-1)和海表面风场(单位: m·s-1)异常回归至标准化PC1, 蓝色和红色箭头分别表示异常西风和东风。各子图下方的数值、字符串和百分数分别表示EPID模态的技巧评分(无此项的为非EPID模态)、模式名称和解释方差, 其中MME为多模式集合 Fig. 2 First EOF mode of FMA precipitation anomaly over the eastern tropical Pacific in CMIP5 models. Regressions of precipitation (mm·d-1; shading), SST (contour at interval of 0.2℃, zero contour thickened and negative dashed), and surface wind velocity (m·s-1; vector) against the concurrent standardized PC1, blue (red) arrows indicate westerly (easterly) wind anomalies. The skillscore of EPID mode, model name and variance are marked at the bottom left, bottom and bottom right of each subgraph, respectively |
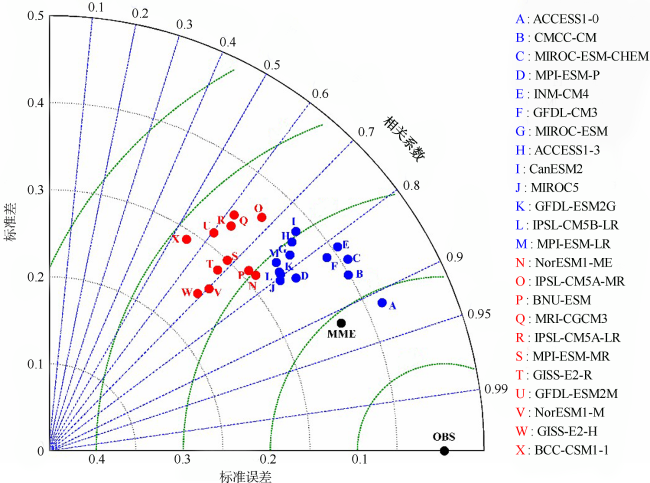
图3 CMIP5模式2—4月降水异常EOF第二模态空间分布图等值线表示同期海温异常回归至标准化PC2, 间隔为0.2℃, 加粗实线为0℃, 正负异常值分别用实线和虚线表示; 填色和矢量分别为同期降水量(单位: mm·d-1)和海表面风场(单位: m·s-1)异常回归至标准化PC2, 蓝色和红色箭头分别表示异常西风和东风。各子图下方的数值、字符串和百分数分别表示EPID模态的技巧评分(无此项的为非EPID模态)、模式名称和解释方差, 其中MME为多模式集合 Fig. 3 Same as |
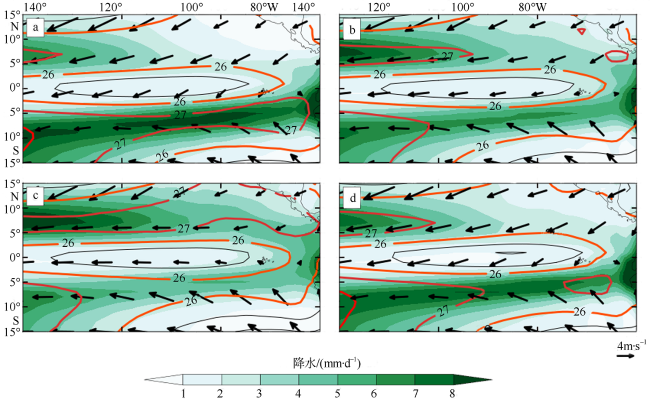
图5 2—4月的气候态空间分布图a. 观测场; b. 第一组模式; c. 第二组模式; d. 第三组模式。图中等值线及标值为海温(单位: ℃), 填色为降水量(单位: mm·d-1), 箭头为海表面风场(单位: m·s-1) Fig. 5 Climatology of SST (℃; contour), precipitation (mm·d-1; shading) and surface wind velocity (m·s-1; vector) in FMA: (a) Observations; (b) in group 1; (c) in group 2; and (d) in group 3 |
图6 季节调整后CMIP5模式降水异常的EOF第一模态空间分布图等值线表示同期海温异常回归至标准化PC1, 间隔为0.2℃, 加粗实线为0℃, 正负异常值分别用实线和虚线表示; 填色和矢量分别为同期降水量(单位: mm·d-1)和海表面风场(单位: m·s-1)异常回归至标准化PC1, 蓝色和红色箭头分别表示异常西风和东风。各子图下方的大写字母、字符串和百分数分别表示季节、模式名称和解释方差, 其中DJF表示December-January- February, JFM表示January-February-March, FMA表示February-March-April, MAM表示March-April-May, AMJ表示April-May-June, MME为多模式集合 Fig. 6 First EOF mode of precipitation anomaly over the eastern tropical Pacific after seasonal adjustment in CMIP5 models. Regressions of precipitation (mm·d-1; shading), SST (contour at interval of 0.2℃, zero contour thickened and negative dashed), and surface wind velocity (m·s-1; vector) against the concurrent standardized PC1, blue (red) arrows indicate westerly (easterly) wind anomalies. The season, model name and variance are marked at the bottom left, bottom and bottom right of each subgraph, respectively DJF: December-January-February; JFM: January-February-March; FMA: February-March-April; MAM: March-April-May; AMJ: April-May-June; MME: multi-model ensemble |
图7 季节调整后CMIP5模式降水异常的EOF第二模态空间分布图等值线表示同期海温异常回归至标准化PC1, 间隔为0.2℃, 加粗实线为0℃, 正负异常值分别用实线和虚线表示; 填色和矢量分别为同期降水量(单位: mm·d-1)和海表面风场(单位: m·s-1)异常回归至标准化PC2, 蓝色箭头表示异常西风, 红色箭头表示异常东风。各子图下方的数值、字符串和百分数分别表示技巧评分、模式名称和解释方差, 其中MME为多模式集合 Fig. 7 Same as |
图9 CMIP5 模式的气候态空间分布图a. 2—4月的多模式平均场; b. 季节调整后的多模式平均场; c. 第四组模式; d. 第五组模式。图中等值线及标值为海温(单位: ℃), 填色为降水量(单位: mm·d-1), 箭头为海表面风场(单位: m·s-1) Fig. 9 Multi-model ensemble mean climatology of SST (℃; contour), precipitation (mm·d-1; shading) and surface wind velocity (m·s-1; vector): (a) during FMA; (b) for seasonal adjustment; (c) in group 4; and (d) in group 5 |
图10 季节调整后EPID模态在热带东太平洋(140°—80°W)的演变图图中填色为降水量(单位: mm·d-1); 等值线为SST(单位: ℃), 其间隔为0.2℃, 加粗实线为零值线, 正、负异常值分别用实线和虚线表示; 箭头为风场(单位: m·s-1), 其中蓝色箭头表示异常西风, 红色箭头表示异常东风; 棕色虚线为热带东太平洋纬向平均气候态降水的重心纬度, 黑色竖线为季节调整后的EPID模态出现的月份, 横轴数字为月份, 括号内1表示季节调整后月份当年, 0表示前一年。 Fig. 10 Evolution of second EOF mode of precipitation anomaly over the eastern tropical Pacific after seasonal adjustment in CMIP5 models. Regressions of precipitation (mm·d-1; shading), SST (contour at interval of 0.2℃, zero contour thickened and negative dashed), and surface wind velocity (m·s-1; vector) with increased (decreased) speed in blue (red). All zonally averaged in 140°-80°W upon the standardized PC2 of precipitation EOF are shown as a function of calendar month and latitude. The brown dashed line is the centroid of tropical climatological precipitation. The black vertical line is the central month of EPID after seasonal adjustment. The number on the horizontal axis is month, 1 in bracket indicates the current year of the month after seasonal adjustment, and 0 represents the previous year. |
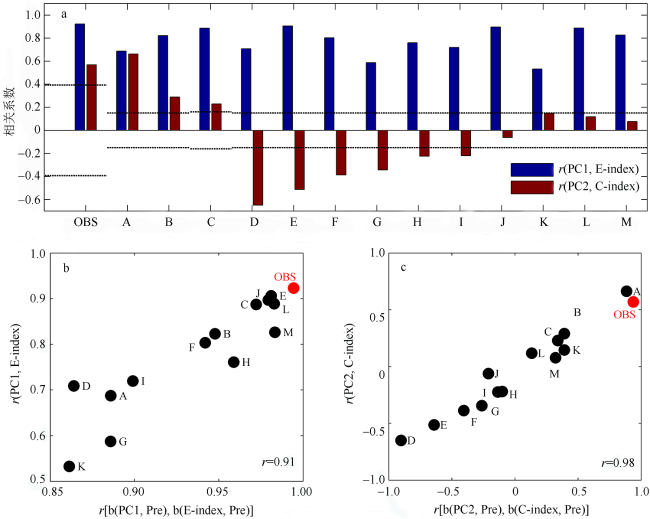
图11 第四组模式对热带东太平洋降水异常模拟的EOF结果与ENSO的关系a. 降水异常EOF时间序列PC与同期ENSO的相关系数直方图, 虚线为95%置信度的临界值; b. PC1与E-index时间序列相关系数(纵轴)和EOF1与E-index对热带东太平洋降水异常回归场空间相关系数(横轴)的模式间散点图; c. PC2与C-index时间序列相关系数和EPID模态与C-index对热带东太平洋降水异常回归场空间相关系数的模式间散点图。OBS为实际观测; 各大写字母代表不同的模式: A为IPSL-CM5B-LR, B为MIROC-ESM, C为MIROC-ESM-CHEM, D为INMCM4, E为ACCESS1-3, F为ACCESS1-0, G为GFDL-CM3, H为GFDL-ESM2G, I为CanESM2, J为MPI-ESM-P, K为MIROC5, L为MPI-ESM-LR, M为CMCC-CM。图b中, b(PC1, Pre)表示降水异常EOF第一模态空间场, b(E-index, Pre)表示E-index与同期热带东太平洋降水异常的回归场; 图c中, b(PC2, Pre)表示EPID模态空间场, b(C-index, Pre)表示C-index与同期热带东太平洋降水异常的回归场 Fig. 11 The relationships between EOF modes of precipitation anomaly over the eastern tropical Pacific and concurrent ENSO in group 4 (a) Correlation coefficient histogram of PC in EOF results and concurrent ENSO, dashed lines mean the 95% confidence level. (b)Scatterplots with correlation coefficients of PC1 and E-index and spatial correlation coefficients of EOF1 and precipitation anomaly regression field of E-index. (c)Scatterplots with correlation coefficients of PC2 and C-index and spatial correlation coefficients of EPID mode and precipitation anomaly regression field of C-index b(PC1, Pre): EOF first mode; b(E-index, Pre): regression field of E-index and concurrent precipitation anomaly over the eastern tropical Pacific; b(PC2, Pre)EPID mode; b(C-index, Pre): regression field of C-index and concurrent precipitation anomaly over the eastern tropical Pacific OBS: observation; A: IPSL-CM5B-LR; B: MIROC-ESM; C: MIROC-ESM-CHEM; D: INMCM4; E: ACCESS1-3; F: ACCESS1-0; G: GFDL-CM3; H: GFDL-ESM2G; I: CanESM2; J: MPI-ESM-P; K: MIROC5; L: MPI-ESM-LR; M: CMCC-CM |
| [1] |
|
| [2] |
|
| [3] |
|
| [4] |
|
| [5] |
|
| [6] |
|
| [7] |
|
| [8] |
|
| [9] |
|
| [10] |
|
| [11] |
|
| [12] |
|
| [13] |
|
| [14] |
|
| [15] |
|
| [16] |
|
/
| 〈 |
|
〉 |


