
Journal of Tropical Oceanography >
A method of tropical cyclone wave height calculation based on Artificial Neural Network
Received date: 2019-09-17
Request revised date: 2020-03-14
Online published: 2020-07-27
Supported by
Foundation item: National Key Research and Development Program of China(2017YFC1404700)
Copyright
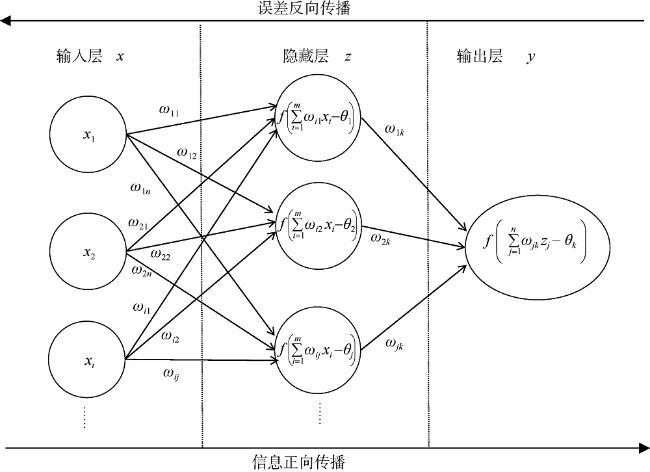
Based on the wave height observation data of five buoys and parameters from the CMA Tropical Cyclone Database for the South China Sea from 2010 to 2017, fast calculation models of tropical cyclone-generated wave height are established by using Forward Feedback Back Propagation (FFBP) Artificial Neural Network (ANN). The results show that significant wave height calculated by the ANN model based on the tropical cyclone central location, minimum sea level pressure (MSLP), maximum sustained wind (MSW), the distance and azimuth between tropical cyclone center and buoy can well fit the observations. The root mean square errors between the calculation and observation of significant wave height are less than 0.3 m, the average relative errors are between 5.78% and 7.23%, and the correlation coefficients are greater than 0.9. Test results show that the model calculation of the maxima of significant wave height basically coincides with the observation, the relative errors being between -31.06% and 0.98%; however, when the calculated maxima of significant wave height appear is not in agreement with observation during tropical cyclone Mangkhut ( International number ID: 1822). The method introduced in this paper can be applied to calculating the maximum of significant wave height during tropical cyclone for ocean engineering and marine forecast.
ZHOU Shuihua , Hong Xiao , LIANG Changxia , JIANG Lifang . A method of tropical cyclone wave height calculation based on Artificial Neural Network[J]. Journal of Tropical Oceanography, 2020 , 39(4) : 25 -33 . DOI: 10.11978/2019089
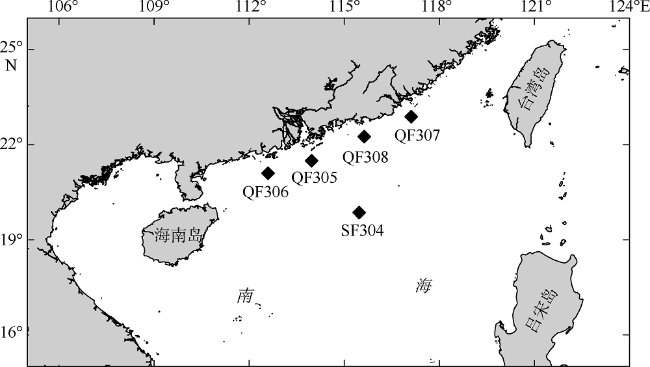
表1 用于开展人工神经网络模型建模的样本数据概况Tab. 1 Data used for Artifical Neural Network |
| QF305 | QF306 | QF307 | QF308 | SF304 | ||
|---|---|---|---|---|---|---|
| 观测时长(年份) | 2010—2017 | 2010—2017 | 2015—2017 | 2010—2017 | 2010—2017 | |
| 热带气旋数/个 | 超强台风 | 11 | 10 | 8 | 13 | 11 |
| 强台风 | 11 | 8 | 3 | 14 | 9 | |
| 台风 | 4 | 3 | 2 | 5 | 4 | |
| 强热带风暴 | 7 | 9 | 4 | 11 | 10 | |
| 热带风暴 | 7 | 6 | 5 | 13 | 7 | |
| 热带低压 | 4 | 3 | 1 | 2 | 5 | |
| 合计 | 44 | 39 | 23 | 58 | 46 | |
| 波高阈值/m | 2.5 | 2.5 | 2.5 | 2.5 | 2.5 | |
| 样本数/个 | 1573 | 1395 | 701 | 1623 | 1700 | |
表2 神经网络模型训练方案Tab. 2 Training cases used for Artifical Neural Network |
| 训练方案 | 输入层输入因子 | 输出层期望值 | |||||||
|---|---|---|---|---|---|---|---|---|---|
| C0 | P0 | W0 | R1 | R0 | (1010-P0) | V0 | Hs | ||
| CASE1 | √ | √ | √ | ||||||
| CASE2 | √ | √ | √ | √ | |||||
| CASE3 | √ | √ | √ | √ | √ | ||||
| CASE4 | √ | √ | √ | √ | |||||
| CASE5 | √ | √ | √ | √ | √ | ||||
| CASE6 | √ | √ | √ | √ | √ | ||||
| CASE7 | √ | √ | √ | √ | |||||
| CASE8 | √ | √ | √ | √ | √ | √ | |||
注: “√”表示参与训练, 空白表示不参与训练 |
表3 不同训练方案的结果对比Tab. 3 Comparation of training cases |
| 浮标名称 | 指标 | CASE1 | CASE2 | CASE3 | CASE4 | CASE5 | CASE6 | CASE7 | CASE8 |
|---|---|---|---|---|---|---|---|---|---|
| QF305 | num | 421 | 321 | 9 | 31 | 12 | 9 | 11 | 9 |
| err | 0.202 | 0.155 | 0.109 | 0.130 | 0.149 | 0.107 | 0.166 | 0.145 | |
| r | 0.884 | 0.912 | 0.939 | 0.927 | 0.916 | 0.940 | 0.905 | 0.915 | |
| QF306 | num | 381 | 406 | 10 | 8 | 13 | 14 | 8 | 10 |
| err | 0.211 | 0.226 | 0.113 | 0.110 | 0.120 | 0.124 | 0.107 | 0.056 | |
| r | 0.893 | 0.886 | 0.944 | 0.945 | 0.940 | 0.940 | 0.947 | 0.963 | |
| QF307 | num | 13 | 13 | 9 | 8 | 11 | 9 | 8 | 10 |
| err | 0.141 | 0.146 | 0.116 | 0.083 | 0.095 | 0.075 | 0.063 | 0.078 | |
| r | 0.888 | 0.884 | 0.924 | 0.936 | 0.926 | 0.942 | 0.952 | 0.954 | |
| QF308 | num | 12 | 61 | 12 | 8 | 12 | 10 | 26 | 11 |
| err | 0.153 | 0.136 | 0.163 | 0.111 | 0.131 | 0.100 | 0.124 | 0.127 | |
| r | 0.871 | 0.886 | 0.862 | 0.909 | 0.891 | 0.900 | 0.897 | 0.909 | |
| SF304 | num | 23 | 10 | 10 | 8 | 14 | 10 | 17 | 10 |
| err | 0.158 | 0.156 | 0.110 | 0.138 | 0.159 | 0.108 | 0.157 | 0.134 | |
| r | 0.879 | 0.880 | 0.918 | 0.895 | 0.880 | 0.920 | 0.880 | 0.926 | |
| 平均 | num | 170.0 | 162.2 | 10.0 | 12.6 | 12.4 | 10.4 | 14.0 | 10.0 |
| err | 0.173 | 0.164 | 0.122 | 0.114 | 0.131 | 0.103 | 0.123 | 0.108 | |
| r | 0.883 | 0.890 | 0.917 | 0.922 | 0.911 | 0.928 | 0.916 | 0.933 |
注: 表中num代表训练次数, num值越小, 说明收敛速度越快; err代表测试误差的平方; r代表模型结果与观测值的相关系数 |
表4 各浮标神经网络模型训练结果Tab. 4 Training result of ANN for buoys |
| 浮标名 | 样本数/个 | 偏差的平方/m2 | 相关系数R | 均方根误差/m | 平均相对偏差/% | 热带气旋数/个 |
|---|---|---|---|---|---|---|
| QF305 | 1573 | 0.109 | 0.94 | 0.33 | 7.23 | 44 |
| QF306 | 1395 | 0.079 | 0.96 | 0.28 | 6.00 | 39 |
| QF307 | 701 | 0.072 | 0.95 | 0.27 | 5.89 | 23 |
| QF308 | 1623 | 0.097 | 0.92 | 0.31 | 6.58 | 58 |
| SF304 | 1700 | 0.072 | 0.95 | 0.27 | 5.78 | 46 |
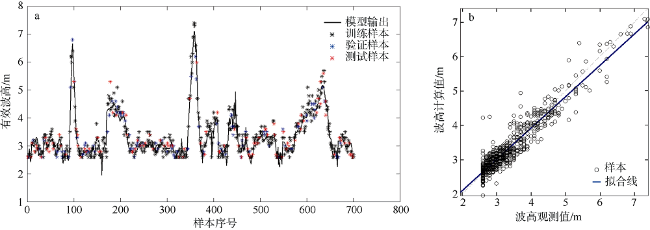
图3 QF307浮标计算值与观测值对比图(a)和计算值与观测值相关分析图(b)Fig. 3 Comparation of simulation and observation (a), and correlation between simulation and observation (b) of buoy QF307 |
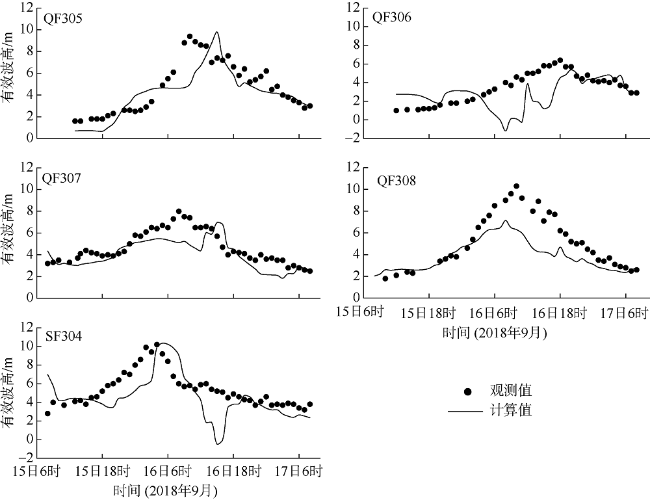
表5 “山竹”影响期间各浮标最大有效波高模型计算值与观测值对比Tab. 5 Comparation of the maxima of wave height between simulation and observation during Tropical Cyclone Mangkhut |
| QF305 | QF306 | QF307 | QF308 | SF304 | |
|---|---|---|---|---|---|
| 观测值/m | 9.4 | 6.4 | 8.0 | 10.3 | 10.2 |
| 模型计算值/m | 9.8 | 5.4 | 7.0 | 7.1 | 10.3 |
| 误差/m | 0.4 | -1.0 | -1.0 | -3.1 | 0.1 |
| 相对误差/% | 4.26 | -15.63 | -12.50 | -31.06 | 0.98 |
注: 误差=模型计算值–观测值; 相对误差=(误差÷观测值)×100 |
| [1] |
陈鹏超, 李瑞杰, 李玉婷, 等, 2017. 不同风场模式下“灿鸿”台风浪数值模拟及应用[J]. 水道港口, 38(6):567-573.
|
| [2] |
陈希, 李妍, 沙文钰, 等, 2003. 人工神经网络技术在台风浪预报中的应用[J]. 海洋科学, 27(2):63-67.
|
| [3] |
丰鉴章, 李元智, 孙书敏, 等, 1987. 海岸工程中的海浪推算方法[M]. 北京: 海洋出版社: 89-153(in Chinese).
|
| [4] |
胡克林, 丁平兴, 朱首贤, 等, 2004. 江口附近海域台风浪的数值模拟——以鹿沙台风和森拉克台风为例[J]. 海洋学报, 26(5):23-33.
|
| [5] |
梁连松, 李瑞杰, 丰青, 等, 2014. 舟山海域台风浪数值模拟[J]. 水道港口, 35(6):582-588.
|
| [6] |
唐建, 史剑, 李训强, 等, 2013. 基于台风风场模型的台风浪数值模拟[J]. 海洋湖沼通报, (2):24-30.
|
| [7] |
王文娟, 梁昌霞, 李广敏, 等, 2011. 0915号台风“巨爵”不同风场资料对比研究[J]. 海洋预报, 28(2):9-17.
|
| [8] |
王锡侯, 宋有强, 1982. 台风波浪推算方法——计算推算点深水最大风浪要素的建议方法[J]. 海洋通报, ( 3):9-16 (in Chinese).
|
| [9] |
闻斌, 汪鹏, 万雷, 等, 2008. 中国近海海域台风浪模拟试验[J]. 海洋通报, 27(3):1-6.
|
| [10] |
闻斌, 薛彦广, 赵建宇, 2014. 基于模型风场的台风浪数值模拟[J]. 海洋预报, 31(2):14-19.
|
| [11] |
文圣常, 余宙文, 1985. 海浪理论与计算原理[M]. 北京: 科学出版社: 430-473(in Chinese).
|
| [12] |
许林之, 许富祥, 1989. 几种台风浪计算方法的比较[J]. 海洋预报, 6(3):66-71 (in Chinese).
|
| [13] |
杨万康, 尹宝树, 伊小飞, 等, 2017. 基于HOLLAND风场的台风浪数值计算[J]. 水利水运工程学报, (4):28-34.
|
| [14] |
张志旭, 齐义泉, 施平, 等, 2003. 最优化插值同化方法在预报南海台风浪中的应用[J]. 热带海洋学报, 22(4):34-41.
|
| [15] |
中华人民共和国交通部, 1998. JTJ213-1998 海港水文规范[S]. 北京: 人民交通出版社: 16-25(in Chinese).
|
| [16] |
周水华, 李远芳, 冯伟忠, 等, 2010. “0601”号台风控制下的广东近岸浪特征[J]. 海洋通报, 29(2):130-134.
|
| [17] |
|
| [18] |
|
| [19] |
|
| [20] |
|
| [21] |
|
/
| 〈 |
|
〉 |
