
Journal of Tropical Oceanography >
Comparative analysis of four global ocean water vapor data products*
Copy editor: YIN Bo
Received date: 2020-05-29
Request revised date: 2020-07-22
Online published: 2020-08-20
Supported by
National Natural Science Foundation of China(41830538)
National Natural Science Foundation of China(41525019)
Chinese Academy of Sciences(XDA15020901)
Chinese Academy of Sciences(133244KYSB20190031)
Chinese Academy of Sciences(ZDRW-XH-2019-2)
State Oceanic Administration of China(GASI-IPOVAI-02)
Southern Marine Science and Engineering Guangdong Laboratory (Guangzhou)(GML2019ZD0303)
Southern Marine Science and Engineering Guangdong Laboratory (Guangzhou)(2019BT2H594)
Southern Marine Science and Engineering Guangdong Laboratory (Guangzhou)(GML2019ZD0306)
Copyright
We compare four observations and reanalysis datasets (SSM/I&SSMIS, RSS V7R01, ERA5, and MERRA-2) in terms of climate states of global water vapor. The variation and long-term trend of total column water vapor (TCWV) of different scales are also explored. The results indicate that the spatial distribution, seasonal cycle and interannual variability of the four datasets are consistent. From 1988 to 2018, the TCWV had an increasing trend in the tropical oceans. The interannual changes of the TCWV are significant and highly correlated with the El Niño-Southern Oscillation (ENSO). The datasets of ERA5 and MERRA-2 should be used with caution when analyzing TCWV trend in a short period (e.g., 1991—1997). When studying the long-term water vapor trend in the tropical regions, MERRA-2 data should be used carefully because the long-term trend is different from other datasets.
Key words: total column water vapor; SSM/I&SSMIS; RSS; ERA5; MERRA-2
CAI Yinan , DU Yan , CHEN Zesheng . Comparative analysis of four global ocean water vapor data products*[J]. Journal of Tropical Oceanography, 2021 , 40(2) : 17 -26 . DOI: 10.11978/2020059
表1 大气柱水汽总量(TCWV)数据介绍Tab. 1 Introduction of total column water vapor (TCWV) datasets |
| TCWV数据 | SSM/I&SSMIS | RSS V7R01 | ERA5 | MERRA-2 | |||
|---|---|---|---|---|---|---|---|
| 时间 | 天、3天、周、月 | 月 | 小时、月 | 小时、3小时、天、月 | |||
| 空间分辨率 | 0.25°×0.25° | 1°×1° | 0.25°×0.25° | 0.625°×0.5° | |||
| 覆盖时间 | 1987.07—至今 | 1988.01—至今 | 1979.01—至今 | 1979.01—至今 | |||
| 覆盖空间 | 90°N—90°S、 180°W—180°E, 海洋 | 60°N—60°S、 180°W—180°E, 海洋 | 90°N—90°S、 180°W—180°E, 全球 | 90°N—90°S、 180°W—180°E, 全球 | |||
| 数据来源/ 同化方案 | SSM/I (F08~F15)、SSMIS (F16~F17) | SSM/I (F08~F15)、SSMIS (F16~F17)、AMSR-E、AMSR-2和WindSat | 欧洲中期天气预报综合预报系统(ECMWF-IFS, CY41R2)的4维变量同化 | 戈达德地球观测系统大气数据同化系统(GEOS ADAS)融合全球统计插值(GIS)方案 | |||
| 数据提供方 | 遥感系统(RSS) | 美国国家航空航天局(NASA)全球水文资源中心(GHRC) | 欧洲中期天气预报中心(ECMWF) | 美国国家航空航天局(NASA) |
注: SSM/I&SSMIS为卫星专用传感器微波成像仪/探测仪数据; RSS V7R01为遥感系统数据集; ERA5为欧洲中期天气预报中心第5代再分析数据; MERRA-2为现代回顾分析的研究与应用第2版数据 |
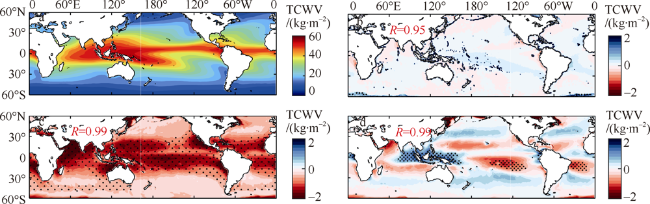
图1 全球多年平均大气柱水汽总量(TCWV)的分布a. RSS V7R01; b、c、d分别为SSM/I&SSMIS、ERA5、MERRA-2和RSS V7R01的差值(单位:kg·m-2)。R是对应的数据和RSS V7R01的相关系数, 打点处是经过95% t-检验的差异显著区 Fig. 1 Distribution of global mean TCWV (a) RSS V7R01; (b), (c), and (d) are differences between SSM/I&SSMIS and RSS V7R01, ERA5 and RSS V7R01, MERRA-2 and RSS V7R01, respectively (units: kg·m-2). R is the correlation coefficient between RSS V7R01 and other datasets Stippling indicates significant at the 95% confidence level using t-test |
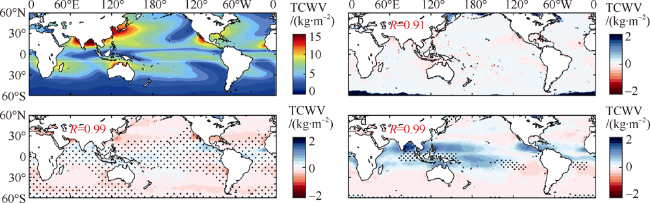
图2 月平均大气柱水汽总量(TCWV)数据的标准差分布a. RSS V7R01; b、c、d分别为SSM/I&SSMIS、ERA5、MERRA-2和RSS V7R01的差值(单位:kg·m-2)。R是对应的数据和RSS V7R01的相关系数, 打点处是经过95% t-检验的差异显著区 Fig. 2 Standard deviation (STD) of monthly mean TCWV (a) RSS V7R01; (b), (c), and (d) are differences between SSM/I&SSMIS and RSS V7R01, ERA5 and RSS V7R01, MERRA-2 and RSS V7R01, respectively (units: kg·m-2). R is the correlation coefficient between RSS V7R01 and other datasets. Stippling indicates significant at the 95% confidence level using t-test |
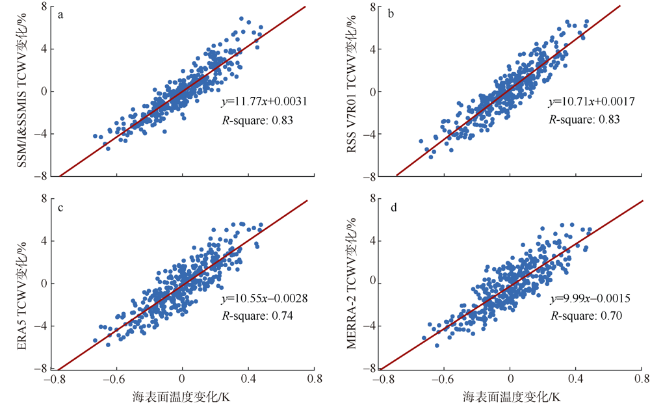
图3 大气柱水汽总量(TCWV)变率和海表温度(SST)变化的散点图a. SSM/I&SSMIS; b. RSS V7R01; c. ERA5; d. MERRA-2。红线是最小二乘法拟合曲线; R-square是判定系数; 公式是回归方程 Fig. 3 Scatter diagrams of TCWV anomalies and SST anomalies (a), (b), (c), and (d) are SSM/I&SSMIS, RSS V7R01, ERA5, and MERRA-2, respectively. The red line represents the curve fitting. R-square and the regression equation are presented |
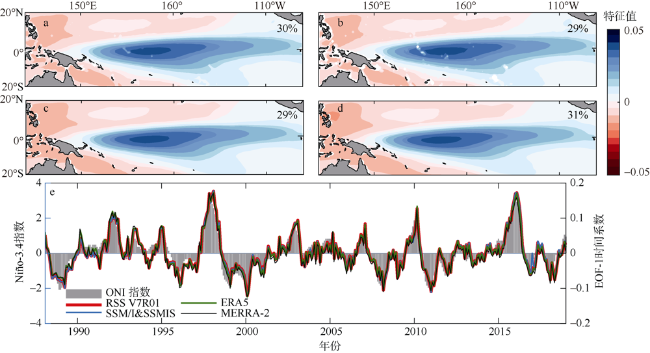
图6 赤道太平洋大气柱水汽总量(TCWV)的经验正交函数分析(EOF)a. SSM/I&SSMIS; b. RSS V7R01; c. ERA5; d. MERRA-2。填色是EOF第一模态的空间分布, 右上角百分比代表第一主成分的方差贡献率; e. 第一模态的时间系数和Niño-3.4指数(ONI指数) Fig. 6 EOF analysis of TCWV in the tropical Pacific (a), (b), (c), and (d) are SSM/I&SSMIS, RSS V7R01, ERA5, and MERRA-2, respectively. Shading indicates the structure of the first mode, numbers at the upper right corner are the variance contributions of the first principal components. e shows the time coefficient of the first mode and Niño-3.4 index (ONI index) |
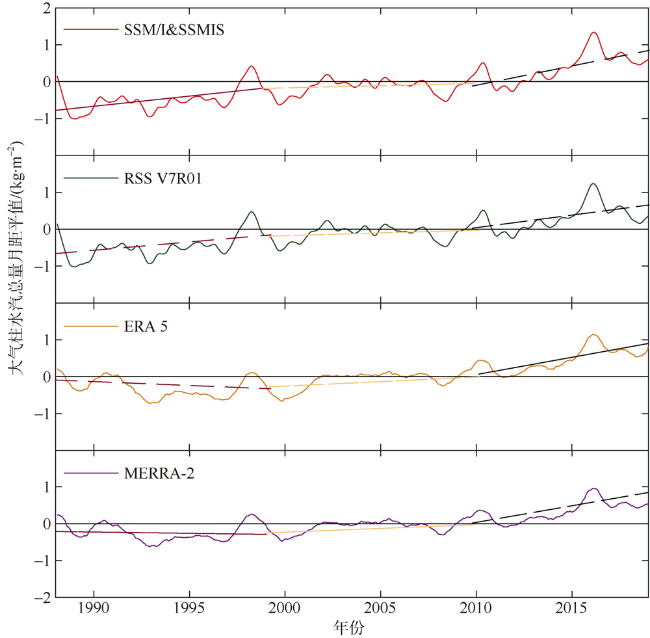
图7 1988—2018年全球大洋大气柱水汽总量(TCWV)月距平的时间序列(十一点滑动平均)及线性拟合趋势图各图中的棕色、黄色和黑色虚线分别代表1988—1998、1999—2008、2009—2018的相应趋势 Fig. 7 Time series (11-month running smoother applied) and the linear fitting trend of global ocean TCWV anomalies from 1988 to 2018 Red, yellow, and black lines represent the linear trends of 1988—1998, 1999—2008, and 2009—2018, respectively |
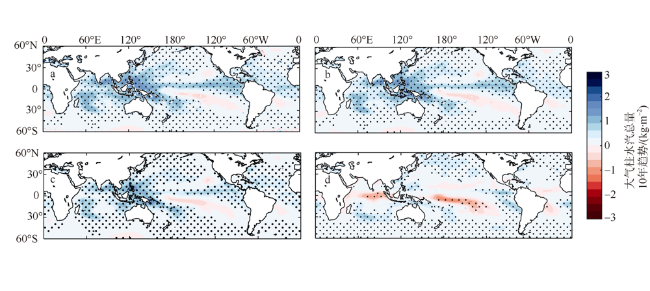
图9 全球海洋大气柱水汽总量(TCWV)的长期趋势的空间分布(1988—2018年)a. SSM/I&SSMIS; b. RSS V7R01; c. ERA5; d. MERRA-2。黑点代表置信度水平超过95% F检验的区域 Fig. 9 Spatial distribution of long-term trend of global ocean TCWV (1988—2018) (a), (b), (c), and (d) are SSM/I&SSMIS, RSS V7R01, ERA5, and MERRA-2, respectively. Shading indicates long-term trend. Stippling indicates significant at the 95% confidence level using F-test |
| [1] |
|
| [2] |
|
| [3] |
|
| [4] |
|
| [5] |
|
| [6] |
|
| [7] |
|
| [8] |
|
| [9] |
|
| [10] |
|
| [11] |
|
| [12] |
|
| [13] |
|
| [14] |
|
| [15] |
|
| [16] |
|
| [17] |
|
| [18] |
|
| [19] |
|
| [20] |
|
| [21] |
|
| [22] |
|
| [23] |
|
| [24] |
|
| [25] |
|
| [26] |
|
| [27] |
|
| [28] |
|
| [29] |
|
| [30] |
|
| [31] |
|
| [32] |
|
| [33] |
|
| [34] |
|
/
| 〈 |
|
〉 |
