
Journal of Tropical Oceanography >
Deep thermal state in the Nansha Trough of South China Sea and its tectonic implications
Copy editor: YAO Yantao
Received date: 2020-07-21
Revised date: 2020-09-01
Online published: 2020-09-20
Supported by
National Natural Science Foundation of China(41776078)
National Natural Science Foundation of China(42076075)
Key Special Project for Introduced Talents Team of Southern Marine Science and Engineering Guangdong Laboratory (Guangzhou)(GML2019ZD0104)
Copyright
The Nansha Trough is a key region where the Proto-South China Sea subducted southward below the Borneo, and the Nansha Block collided with Borneo. Its tectonic evolution contains important evolutional information of previous and present South China Sea region. To further understand the deep thermal state in the Nansha Trough, which has a great effect on its tectonic deformation, with a numerical model of the thermal diffusion equation, we first analyzed the thermal blanketing effect of rapid accumulation of sediment on observed heat flow in the deep-water region of the Nansha Trough, and then calculated the Curie depths in the study area with a magnetic spectrum analysis technique. The results show that due to the thermal blanketing of rapid accumulation of the Brunei Landslide, the observed seafloor heat flow is just 60%~77% of the deep background heat flow in the deep-water region, which is about 77~98 mW·m-2. The Curie depth in the trough region is generally less than 16 km, which is smaller than the Curie depth (18~24 km) in the Nansha Islands and Reefs. Further analyses show that the trough region is of high background heat flow, and the high thermal state in the study area is in accord with its greatly thinned crustal thickness, which is the result of continental rifting of the southern margin of South China, and the evolution of the South China Sea.
Key words: heat flow; thermal state; Curie depth; Nansha Trough; Nansha Block
REN Ziqiang , SHI Xiaobin , WANG Xiaofang , ZHAO Peng , SHEN Yongqiang . Deep thermal state in the Nansha Trough of South China Sea and its tectonic implications[J]. Journal of Tropical Oceanography, 2021 , 40(4) : 98 -109 . DOI: 10.11978/2020074
图1 南沙海槽位置及热流值该图基于中国地质调查局广州海洋地质调查局编制出版的南海晕渲地形图制作, 审图号为JS(2015)02-107, 底图无修改。图中洋红色曲线为3000m等深线, 黄色曲线为南沙海槽区域2000m等深线, 黑色方框为 Fig. 1 Location of the Nansha Trough, showing observed heat flow sites |
图2 南沙地块地壳结构图a地壳结构据丘学林等(2011), 图b地壳结构据Franke等(2008); 图中红色曲线为居里面深度; 剖面位置见 Fig. 2 Crustal structure profiles in the Nansha Block |
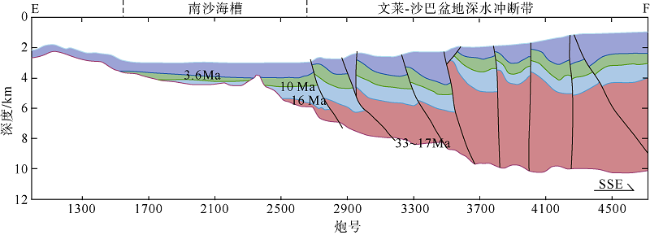
图3 南沙海槽深水冲断带地震剖面[修改自Franke等(2008)]图中黑色线为逆冲断层, 紫色线为冲断带的主滑脱面, 各地层界面年龄据Franke等(2008)。剖面位置见 Fig. 3 Seismic profile showing the deep-water thrust zone in the Nansha Trough |
图4 文莱滑坡区热流点分布(a)及南沙海槽深水区滑坡体分布(b)[修改自Gee等(2007)]图a为文莱滑坡区地形, 位置如 Fig. 4 (a) Heat flow stations in the Brunei Landslide and (b) landslide units in the deep-water area of the Nansha Trough |
表1 南沙海槽区域海底热流值Tab. 1 Heat flow in the Nansha Trough |
| 站位 | 纬度 | 经度 | 水深/m | 地温梯度/(℃·km-1) | 热导率1 /(μW·m-3) | 热导率2 /(μW·m-3) | 热流1 /(mW·m-2) | 热流2 /(mW·m-2) |
|---|---|---|---|---|---|---|---|---|
| A176 | 6°34′54″N | 113°50′30″E | 2350 | 92 | 0.707 | 0.85 | 65 | 78 |
| A177 | 6°46′18″N | 114°15′18″E | 2863 | 80 | 0.700 | 0.85 | 56 | 68 |
| A178 | 6°58′18″N | 114°39′42″E | 2882 | 92 | 0.696 | 0.85 | 64 | 78 |
| A179 | 7°7′42″N | 115°7′E | 2844 | 83 | 0.699 | 0.85 | 58 | 71 |
| C182 | 6°N | 114°1′E | 2305 | 30 | 0.909 | × | 27 | × |
| C183 | 7°27′N | 114°32′60″E | 1476 | × | × | × | 14 | × |
注: 原始数据来自Sclater等(1976), 其中C183站位曾因刊印错误而被北移至北纬9.45°(Taylor et al, 1983); 1为原始数据, 2为以西南次海盆及南沙岛礁区海底沉积物热导率平均值改正后的数据; ×表示无有效数据 |
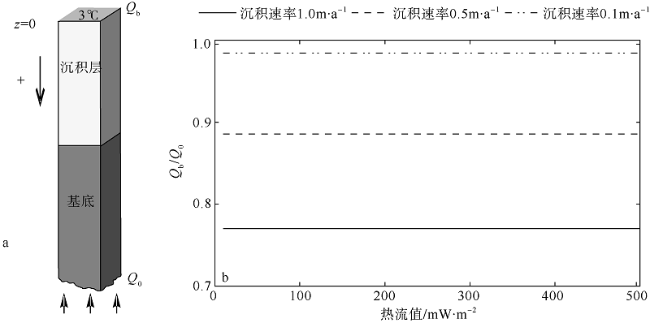
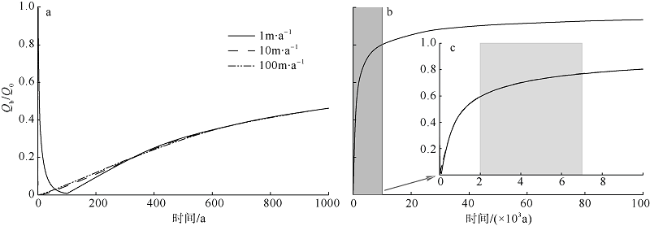
图5 沉积物热披覆效应计算模型示意图(a)[修改自Hutnak等(2007)]和模型顶、底热流比值随底边界热流值的变化(b)图a中加号和向下箭头表示沉积层向下增厚。图b中不同直线表示为图a中模型在不同沉积速率下持续沉积100a, 之后沉积作用结束7000a后顶、底边界热流比值随底边界热流值的变化 Fig. 5 (a) Schematic diagram of sediment thermal blanketing model, and (b) ratio of heat flow at the top and bottom of the model versus the bottom boundary conditions |
表2 滑坡体热披覆效应影响分析模型的参数与取值Tab. 2 Parameters and values used in the landslide thermal blanketing model |
| 参数 | 取值 | |
|---|---|---|
| 水 | 砂质沉积物骨架 | |
| 密度/(kg·m-3) | 1030* | 2650* |
| 比热/(J·kg-1·K-1) | 4183* | 1088* |
| 热导率/(W·m-1·K-1) | 0.67 | 4.18* |
| 初始孔隙度 | × | 0.63# |
| 压实因子/m-1 | × | 0.51×10⁻³# |
注: *引自Hutchison (1985), #引自王丽芳等(2020); ×表示无数据 |
图6 南沙及其邻近区域的磁异常分布(a)和计算获得的居里面深度分布(b)该图基于中国地质调查局广州海洋地质调查局编制出版的南海晕渲地形图制作, 审图号为JS(2015)02-107, 底图无修改。图a中磁异常数据来源于Meyer等(2017); 图b中洋红色曲线为3000m等深线, 蓝色虚线为南沙海槽区2000m等深线, 红色实线为区域断裂, 黑色直线为 Fig. 6 (a) Map of total field magnetic anomalies, and (b) Curies depth in Nansha and its adjacent area |
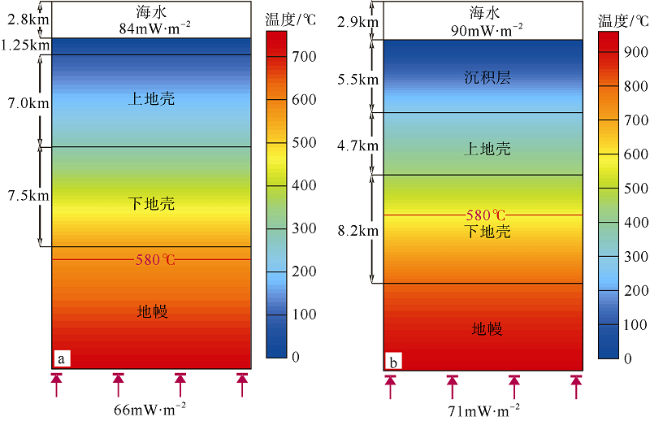
图8 ODP1143井(a)和南沙海槽区域(b)的一维稳态地温场一维模型的顶边界为定温度边界, 温度为3℃, 底边界为热流边界。图中红色线为580℃温度线 Fig. 8 One-dimensional steady state temperature field at (a) ODP 1143 drill and (b) in the Nansha Trough |
表3 一维地温场计算参数值Tab. 3 Parameter values used for 1D temperature calculation |
| 参数 | 值 |
|---|---|
| 沉积层生热率 | 1.21µW·m-3& |
| 沉积层热导率 | 1.3W·m-1·K-1†或1.7W·m-1·K-1‡ |
| 上地壳生热率 | 1.8µW·m-3# |
| 上地壳热导率 | λ-1=0.33+0.33×10⁻³T* |
| 下地壳生热率 | 0.5µW·m-3# |
| 下地壳热导率 | λ-1=0.41+0.29×10⁻³T* |
| 地幔热导率 | 3.4W·m-1·K-1 |
注: *据Buntebarth(1984), #据施小斌等(2020), &据徐行等(2017)。†为ODP1143钻井区域沉积层热导率, ‡为南沙海槽区沉积层热导率[据施小斌等(2015)]; 因ODP1143钻井区沉积层较薄, 沉积物压实作用较小, 故其沉积层热导率取值也较小。上地壳热导率和下地壳热导率公式中的λ为热导率, T为以℃为单位的地壳温度 |
| [1] |
陈爱华, 徐行, 罗贤虎, 等, 2017. 南海北康盆地热流分布特征及其构造控制因素探讨[J]. 地质学报, 91(8):1720-1728.
|
| [2] |
陈波, 2013. 中国及邻区岩石圈有效弹性厚度及其动力学意义[D]. 武汉: 中国地质大学(武汉).
|
| [3] |
韩冰, 朱本铎, 万玲, 等, 2015. 南沙海槽东南缘深水逆冲推覆构造[J]. 地质论评, 61(5):1061-1067.
|
| [4] |
李家彪, 丁巍伟, 吴自银, 等, 2012. 南海西南海盆的渐进式扩张[J]. 科学通报, 57(20):1896-1905.
|
| [5] |
马辉, 许鹤华, 施小斌, 等, 2011. 南沙海槽前陆盆地热流变结构[J]. 地球科学(中国地质大学学报), 36(5):939-948.
|
| [6] |
丘学林, 赵明辉, 敖威, 等, 2011. 南海西南次海盆与南沙地块的OBS探测和地壳结构[J]. 地球物理学报, 54(12):3117-3128.
|
| [7] |
任金锋, 孙鸣, 韩冰, 2011. 南海南沙海槽大型海底滑坡的发育特征及成因机制[J]. 地球科学, 46(3):1058-1071.
|
| [8] |
任自强, 施小斌, 杨小秋, 等, 2021. 南海礼乐盆地礁体水热循环及其对地温场的影响[J]. 地球物理学报, 64(2):612-627.
|
| [9] |
施小斌, 王振峰, 蒋海燕, 等, 2015. 张裂型盆地地热参数的垂向变化与琼东南盆地热流分布特征[J]. 地球物理学报, 58(3):939-952.
|
| [10] |
施小斌, 王丽芳, 任自强, 等, 2020. 南海礼乐盆地新生代构造热演化特征及其影响因素[J]. 地球物理学报, 63(7):2682-2696.
|
| [11] |
唐武, 赵志刚, 张功成, 等, 2018a. 文莱—沙巴盆地深水褶皱冲断带构造变形特征及成因机制[J]. 地球物理学报, 61(10):4281-4295.
|
| [12] |
唐武, 赵志刚, 谢晓军, 等, 2018b. 西北婆罗洲深水褶皱冲断带相关褶皱构造样式[J]. 地球科学, 43(2):491-501.
|
| [13] |
王丽芳, 施小斌, 任自强, 等, 2020. 南海南部礼乐盆地礁体发育区的构造热演化特征[J]. 地球物理学报, 63(8):3050-3062.
|
| [14] |
熊莉娟, 李三忠, 索艳慧, 等, 2012. 南海南部新生代控盆断裂特征及盆地群成因[J]. 海洋地质与第四纪地质, 32(6):113-127.
|
| [15] |
徐行, 王先庆, 彭登, 等, 2018a. 南海西北次海盆及其邻区的地热流特征与研究[J]. 地球科学, 43(10):3391-3398.
|
| [16] |
徐行, 姚永坚, 彭登, 等, 2018b. 南海西南次海盆的地热流特征与分析[J]. 地球物理学报, 61(7):2915-2925.
|
| [17] |
张健, 董淼, 吴时国, 等, 2017. 南沙海槽岩石圈热-流变结构与动力学演化分析[J]. 地学前缘, 24(3):27-40.
|
| [18] |
赵长煜, 宋海斌, 杨振武, 等, 2014. 南海南部边缘沉积盆地构造-热演化历史[J]. 地球物理学报, 57(5):1543-1553.
|
| [19] |
赵斐宇, 姜素华, 李三忠, 等, 2017. 曾母拉分盆地的油气成藏规律: 廷贾-西巴兰线断裂的控制[J]. 海洋地质与第四纪地质, 37(4):209-220.
|
| [20] |
|
| [21] |
|
| [22] |
|
| [23] |
|
| [24] |
|
| [25] |
|
| [26] |
|
| [27] |
|
| [28] |
|
| [29] |
|
| [30] |
|
| [31] |
|
| [32] |
|
| [33] |
|
| [34] |
|
| [35] |
|
| [36] |
|
| [37] |
|
| [38] |
|
| [39] |
|
| [40] |
|
| [41] |
|
| [42] |
|
| [43] |
|
| [44] |
|
| [45] |
|
| [46] |
|
| [47] |
|
| [48] |
|
| [49] |
|
| [50] |
|
| [51] |
|
| [52] |
|
| [53] |
|
| [54] |
|
/
| 〈 |
|
〉 |


