
Journal of Tropical Oceanography >
Distribution of Pearl-River diluted water and its ecological characteristics during spring monsoon transitional period in 2016*
Copy editor: YIN Bo
Received date: 2020-09-16
Request revised date: 2021-01-13
Online published: 2021-01-07
Supported by
National Key Research and Development Program of China(2016YFC0301202)
National Key Research and Development Program of China(2016YFA0601203)
National Natural Science Foundation of China(41676108)
Key Special Project for Introduced Talents Team of Southern Marine Science and Engineering Guangdong Laboratory(Guangzhou)(GML2019ZD0305)
Copyright
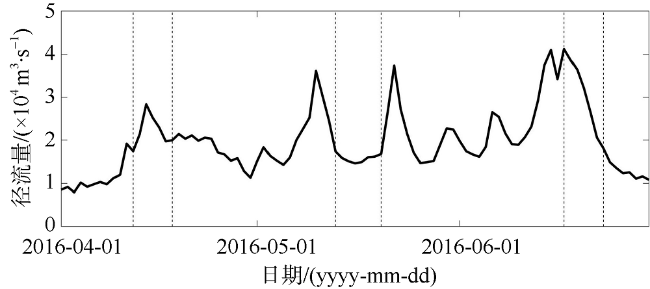
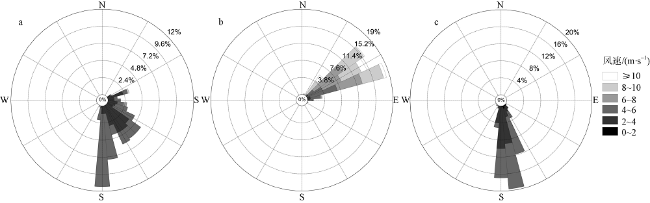
Based on in situ physical and biological observations and remote sensing data, we analyzed the distribution characteristics of wind, diluted water and its ecological response in the Pearl River Estuary (PRE) during the spring monsoon transitional period (April — June) in 2016. The results showed that non-unidirectional wind prevailed in the PRE and its adjacent area from April to May, and weak southwest monsoon prevailed in June. Meanwhile, the Pearl-River discharge flux increased over time. Influenced by wind and Pearl-River runoff, the diluted water expanded westward alongshore in April and offshore in May, with a maximum distance of more than 70 km away from the coast. The diluted water expanded both eastward and westward in June. The westward diluted water was restricted, and formed an estuarine front with significant salinity and turbidity gradient outside the mouth of the estuary when encountered the southerly monsoon and background currents. The estuarine front extended offshore and formed a large plume in eastward offshore regions. Furthermore, the distribution of fluorescent and oxygen were mainly influenced by diluted water and showed similar patterns. In the vertical direction, the process of hypoxia formation was observed in the PRE. Seawater stratification and the formation of stable water column together with biodegradation process jointly led to low dissolved oxygen at the bottom of the PRE. The distribution of turbidity was mainly influenced by suspended sediments carried by river discharge, and showed strong negative correlation with salinity.
SHUAI Yiping , CHEN Yinchao , LIU Zijia , GE Zaiming , MA Mengzhen , ZHANG Yuanfang , LI Qian . Distribution of Pearl-River diluted water and its ecological characteristics during spring monsoon transitional period in 2016*[J]. Journal of Tropical Oceanography, 2021 , 40(5) : 63 -71 . DOI: 10.11978/2020107
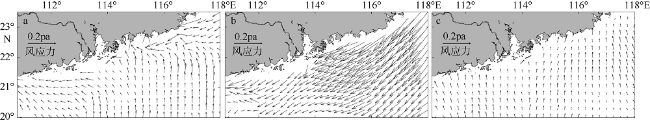
图3 珠江口2016年4—6月采样期间表层风场分布特征及变化情况a. 2016年4月; b. 2016年5月; c. 2016年6月 Fig. 3 Distribution of surface wind stress during our investigation period in 2016. (a) April; (b) May; (c) June |
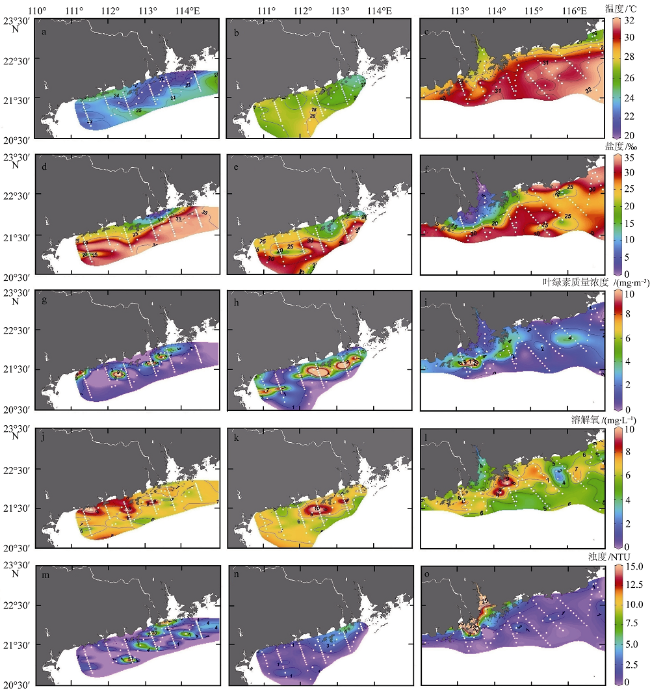
图5 珠江口2016年4、5、6月温度(a~c)、盐度(d~f)、叶绿素质量浓度(g~i)、溶解氧(j~l)以及浊度(m~o)的表层分布a, d, g, j, m为2016年4月; b, e, h, k, n为2016年5月; c, f, i, l, o为2016年6月。图中数据为水下1m的CTD值, 白色圆点为实测值, 插值方式采用了海洋数据视图软件的数据插值变分分析方法 Fig. 5 Surface distributions of temperature (a~c), salinity (d~f), fluorescence (g~i), oxygen (j~l), and turbidity (m~o) during our investigation period of April — June 2016 in the Pearl River Estuary and its adjacent area. Here, the CTD data were 1 m below the surface. The white dots indicate sampling stations. Data-Interpolation variational analysis (DIVA) supplied by Ocean Data View (ODV) was adopted as our interpolating method |
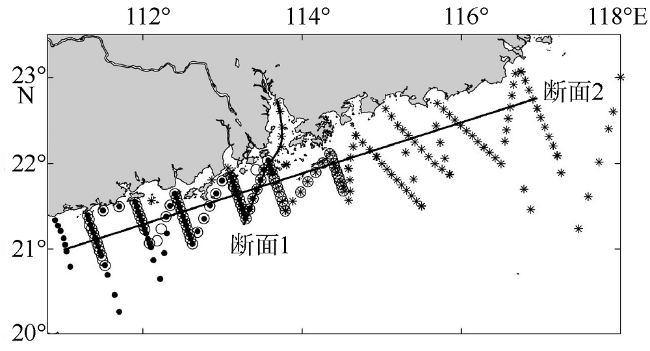
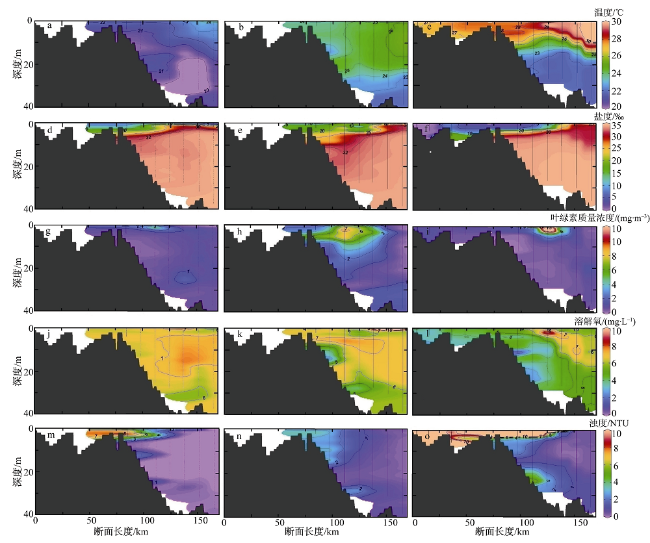
图6 2016年4、5、6月珠江口断面1的温度(a~c)、盐度(d~f)、叶绿素质量浓度(g~i)、溶解氧(j~l)以及浊度(m~o)分布a, d, g, j, m为2016年4月; b, e, h, k, n为2016年5月; c, f, i, l, o为2016年6月。图中黑色圆点为CTD采样数据, 采用了ODV的加权平均插值法 Fig. 6 Vertical distributions of temperature (a~c), salinity (d~f), fluorescence (g~i), oxygen (j~l), and turbidity (m~o) in section 1 during our investigation period of April — June 2016. Section 1 was located along the Pearl River. The black dots are CTD sampling data. Weight-averaged gridding method was used for horizontal interpolation |
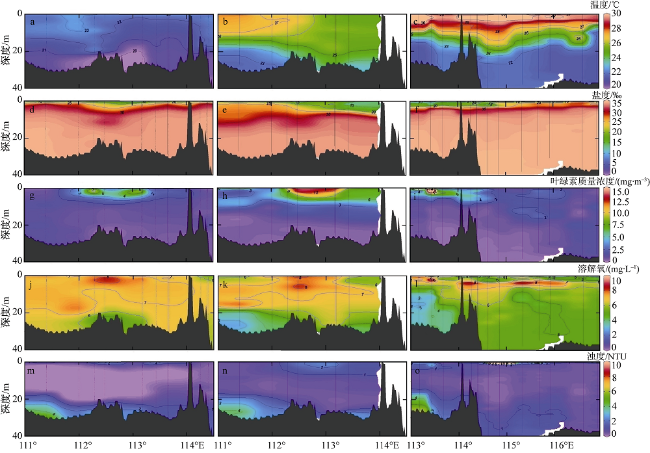
图7 2016年4、5、6月珠江口断面2的温度(a~c)、盐度(d~f)、叶绿素质量浓度(g~i)、溶解氧(j~l)以及浊度(m~o)分布a, d, g, j, m为2016年4月; b, e, h, k, n为2016年5月; c, f, i, l, o为2016年6月。图中黑色圆点为CTD采样数据, 采用了ODV的加权平均插值法 Fig. 7 Vertical distributions of temperature (a~c), salinity (d~f), fluorescence (g~i), oxygen (j~l), and turbidity (m~o) in section 1 during our investigation period of April — June 2016. Section 2 was parallel to the coast. The black dots are CTD sampling data. Weight-averaged gridding method was used for horizontal interpolation |
| [1] |
胡辉, 胡方西, 1995. 长江口的水系和锋面[J]. 中国水产科学, 2(1):81-90.
|
| [2] |
贾国东, 彭平安, 傅家谟, 2002. 珠江口近百年来富营养化加剧的沉积记录[J]. 第四纪研究, 22(2):158-165.
|
| [3] |
罗琳, 李适宇, 王东晓, 2008. 珠江河口夏季缺氧现象的模拟[J]. 水科学进展, 19(5):729-735.
|
| [4] |
毛汉礼, 甘子钧, 蓝淑芳, 1963. 长江冲淡水及其混合问题的初步探讨[J]. 海洋与湖沼, 5(3):183-206.
|
| [5] |
宁修仁, 刘子琳, 蔡昱明, 2000. 我国海洋初级生产力研究二十年[J]. 东海海洋, 18(3):13-20.
|
| [6] |
薛惠洁, 柴扉, 徐丹亚, 等, 2001. 南海沿岸流特征及其季节变化[G]//中国海洋学文集. 北京: 海洋出版社, 13:64-75.
|
| [7] |
叶安乐, 李凤岐, 1992. 物理海洋学[M]. 青岛: 青岛海洋大学出版社: 251-259(in Chinese).
|
| [8] |
叶丰, 2011. 珠江河口溶解氧的关键控制因素及底层缺氧的历史记录[D]. 广州: 中国科学院南海海洋研究所: 1-106.
|
| [9] |
赵焕庭, 1990. 珠江河口演变[M]. 北京: 海洋出版社: 357-360(in Chinese).
|
| [10] |
|
| [11] |
|
| [12] |
|
| [13] |
|
| [14] |
|
| [15] |
|
| [16] |
|
| [17] |
|
| [18] |
|
| [19] |
|
| [20] |
|
| [21] |
|
| [22] |
|
| [23] |
|
| [24] |
|
| [25] |
|
| [26] |
|
| [27] |
|
| [28] |
|
| [29] |
|
/
| 〈 |
|
〉 |
