
Journal of Tropical Oceanography >
Identification and quantitative analysis of key controlling factors of water quality response to human activities in the Daya Bay, China
Copy editor: YAO Yantao
Received date: 2022-05-25
Revised date: 2022-07-06
Online published: 2022-07-06
Supported by
National Natural Science Foundation of China(41806132)
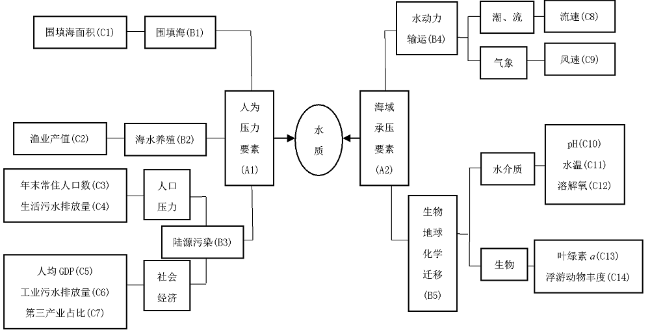
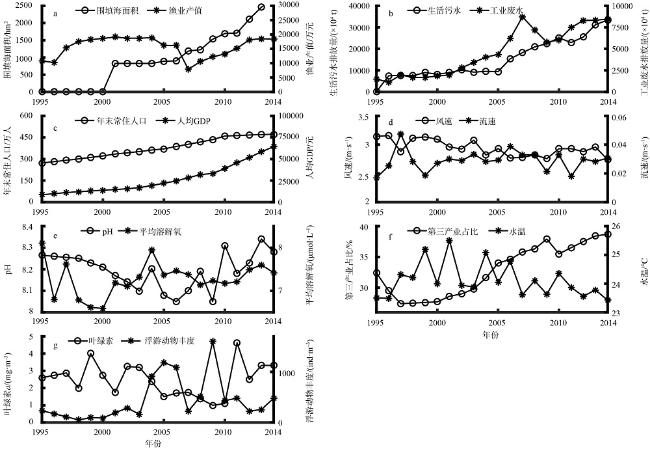
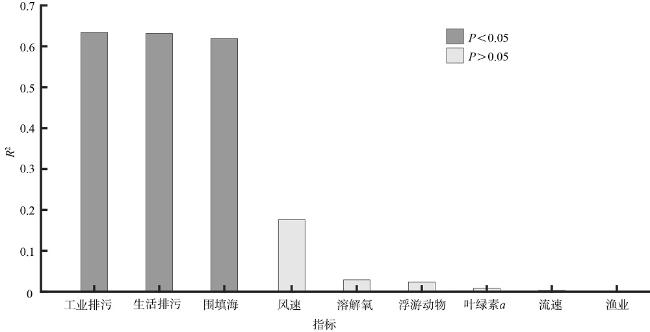
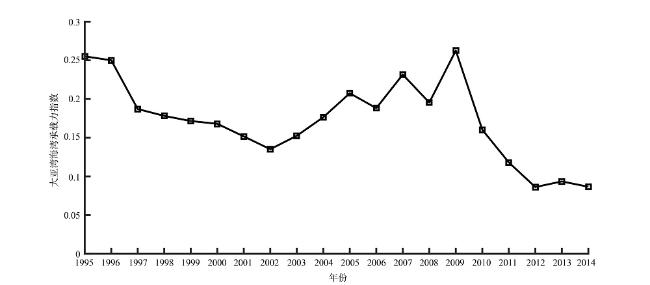
With the rapid development of economy and population in coastal areas, the water quality of the main bays around the world has been affected by human activities which results in the deterioration of the ecological environment. Based on the survey and statistical data from 1995 to 2014 in the Daya Bay, Guangdong Province, China, coefficient of variation method, bivariate correlation analysis, principal component analysis and linear regression analysis were used to identify the key controlling indicators from the anthropogenic pressure indicators and coastal carrying indicators, which have significant impact on the water quality of the Daya Bay. The proportion of the carrying capacity of each important controlling factor was used to quantify the water quality effect. The results showed that the key controlling indicators contained three anthropogenic pressure indicators, including land reclamation, domestic sewage discharge and industrial wastewater discharge. The key controlling indicators had remarkable variation and greater loading values, and they were significantly correlated to the CDIN which was the main pollutant in the Daya Bay. The quantitative assessment results showed that the carrying capacity of key controlling indicators (land reclamation, domestic sewage discharge and industrial wastewater discharge) were 6.19%, 5.07% and 17.51%, respectively, of which the proportion of industrial wastewater discharge is the highest and has the greatest impact on the Daya Bay. Therefore, human activities were the main cause for the deterioration of water quality in the Daya Bay. These results illustrated that the control of land-based pollution and the regulation of the coastline should be implemented to promote the sustainable development of social economy around the Daya Bay.
JIANG Xun , WU Wen , SONG Dehai . Identification and quantitative analysis of key controlling factors of water quality response to human activities in the Daya Bay, China[J]. Journal of Tropical Oceanography, 2023 , 42(1) : 182 -191 . DOI: 10.11978/2022120
表1 Pearson相关性分析结果Tab. 1 Result of the pearson correlation analysis |
| 指标 | 围填海(C1) | 渔业(C2) | 人口(C3) | 生活污水(C4) | 人均GDP(C5) | 工业废水(C6) | 第三产业(C7) | 流速(C8) | 风速(C9) | DO(C12) | 叶绿素a (C13) | 浮游动物(C14) |
|---|---|---|---|---|---|---|---|---|---|---|---|---|
| 围填海(C1) | 1 | |||||||||||
| 渔业(C2) | 0.104 | 1 | ||||||||||
| 人口(C3) | 0.955** | 0.021 | 1 | |||||||||
| 生活污水(C4) | 0.941** | 0.008 | 0.948** | 1 | ||||||||
| 人均GDP(C5) | 0.962** | 0.09 | 0.937** | 0.966** | 1 | |||||||
| 工业废水(C6) | 0.891** | -0.158 | 0.930** | 0.892** | 0.889** | 1 | ||||||
| 第三产业(C7) | 0.874** | -0.28 | 0.890** | 0.846** | 0.868** | 0.916** | 1 | |||||
| 流速(C8) | -0.033 | -0.08 | -0.023 | -0.074 | 0.007 | -0.127 | 0.083 | 1 | ||||
| 风速(C9) | 0.635* | -0.101 | 0.659** | 0.611** | 0.551** | 0.726** | 0.650** | -0.416 | 1 | |||
| DO(C12) | -0.289 | 0.089 | -0.181 | -0.087 | -0.216 | -0.297 | -0.397 | 0.172 | -0.398 | 1 | ||
| 叶绿素a (C13) | 0.004 | 0.396 | -0.066 | 0.003 | 0.114 | -0.087 | -0.183 | 0.308 | -0.35 | 0.088 | 1 | |
| 浮游动物(C14) | -0.282 | 0.129 | -0.357 | -0.218 | -0.187 | -0.304 | -0.482* | -0.06 | -0.596** | 0.27 | 0.476* | 1 |
注: *表示在0.05水平相关性显著; **表示在0.01水平相关性显著 |
表2 主成分分析的解释总方差Tab. 2 Total variance for explanation |
| 成分 | 初始特征值 | 旋转载荷平方和 | ||||
|---|---|---|---|---|---|---|
| 总计 | 方差百分比/% | 累积/% | 总计 | 方差百分比/% | 累积/% | |
| 1 | 3.776 | 41.952 | 41.952 | 3.366 | 37.402 | 37.402 |
| 2 | 1.754 | 19.488 | 61.44 | 1.797 | 19.971 | 57.373 |
| 3 | 1.162 | 12.912 | 74.353 | 1.528 | 16.98 | 74.353 |
| 4 | 0.926 | 10.288 | 84.641 | |||
| 5 | 0.832 | 9.245 | 93.886 | |||
| 6 | 0.341 | 3.786 | 97.672 | |||
| 7 | 0.115 | 1.275 | 98.947 | |||
| 8 | 0.071 | 0.793 | 99.741 | |||
| 9 | 0.023 | 0.259 | 100 | |||
表3 主成分矩阵及综合载荷数Tab. 3 Principal component matrix and sum loading |
| 指标 | 主成分 | Fsum | ||
|---|---|---|---|---|
| F1 | F2 | F3 | ||
| 围填海(C1) | 0.972 | 0.03 | -0.07 | 0.951 |
| 渔业(C2) | 0.044 | 0.742 | -0.2 | 0.593 |
| 生活污水(C4) | 0.953 | 0.025 | -0.018 | 0.909 |
| 工业废水(C6) | 0.935 | -0.151 | -0.116 | 0.910 |
| 流速(C8) | 0.024 | -0.084 | 0.925 | 0.863 |
| 风速(C9) | 0.678 | -0.358 | -0.526 | 0.865 |
| 溶解氧(C12) | -0.258 | 0.203 | 0.41 | 0.276 |
| 叶绿素a (C13) | 0.078 | 0.767 | 0.389 | 0.746 |
| 浮游动物(C14) | -0.323 | 0.677 | 0.134 | 0.581 |
注: Fsum为综合载荷数 |
| [1] |
黄小平, 黄良民, 宋金明, 等, 2019. 营养物质对海湾生态环境影响的过程与机理[M]. 北京: 科学出版社. (in Chinese)
|
| [2] |
柯东胜, 李秀芹, 彭晓鹃, 等, 2010. 大亚湾生态环境问题及其调控策略[J]. 生态科学, 29(2): 186-191.
|
| [3] |
李纯厚, 林琳, 徐姗楠, 等, 2013. 海湾生态系统健康评价方法构建及在大亚湾的应用[J]. 生态学报, 33(6): 1798-1810.
|
| [4] |
李纯厚, 徐姗楠, 杜飞雁, 等, 2015. 大亚湾生态系统对人类活动的响应及健康评价[J]. 中国渔业质量与标准, 5(1): 1-10.
|
| [5] |
陆志强, 李吉鹏, 章耕耘, 等, 2015. 基于可变模糊评价模型的东山湾生态系统健康评价[J]. 生态学报, 35(14): 4907-4919.
|
| [6] |
罗先香, 杨建强, 2009. 海洋生态系统健康评价的底栖生物指数法研究进展[J]. 海洋通报, 28(3): 106-112.
|
| [7] |
彭云辉, 孙丽华, 陈浩如, 等, 2002. 大亚湾海区营养盐的变化及富营养化研究[J]. 海洋通报, 21(3): 44-49.
|
| [8] |
曲修齐, 刘淼, 李春林, 等, 2019. 生态承载力评估方法研究进展[J]. 气象与环境学报, 35(4): 113-119.
|
| [9] |
王聪, 林军, 陈丕茂, 等, 2009. 年平均风场作用下大亚湾水交换的数值模拟[J]. 上海海洋大学学报, 18(3): 351-358.
|
| [10] |
王淑萍, 2017. 青岛近海环境质量效控要素量化解析研究[D]. 青岛: 中国海洋大学.
|
| [11] |
王友绍, 王肇鼎, 黄良民, 2004. 近20年来大亚湾生态环境的变化及其发展趋势[J]. 热带海洋学报, 23(5): 85-95.
|
| [12] |
王友绍, 2014. 大亚湾生态环境与生物资源[M]. 北京: 科学出版社.
|
| [13] |
王肇鼎, 练健生, 胡建兴, 等, 2003. 大亚湾生态环境的退化现状与特征[J]. 生态科学, 22(4): 313-320.
|
| [14] |
翁骏超, 袁琳, 张利权, 等, 2015. 象山港海湾生态系统综合承载力评估[J]. 华东师范大学学报(自然科学版), (4): 110-122.
|
| [15] |
谢艳辉, 李涛, 简伟军, 等, 2015. 海水升温对大亚湾浮游植物群落结构和光合活性的影响[J]. 热带海洋学报, 34(2): 24-31.
|
| [16] |
杨进, 李纯厚, 贾晓平, 等, 2011. 大亚湾杨梅坑人工鱼礁区生态系统健康评价[J]. 生态科学, 30(4): 399-405, 410.
|
| [17] |
杨文超, 黄道建, 陈继鑫, 等, 2020. 大亚湾海域2009—2015年氮、磷营养盐时空分布及富营养化评价[J]. 南方水产科学, 16(2): 54-61.
|
| [18] |
|
| [19] |
|
| [20] |
|
| [21] |
|
| [22] |
|
| [23] |
|
| [24] |
|
| [25] |
|
| [26] |
|
| [27] |
|
| [28] |
|
| [29] |
|
| [30] |
|
| [31] |
|
| [32] |
|
| [33] |
|
| [34] |
|
| [35] |
|
| [36] |
|
| [37] |
|
| [38] |
|
| [39] |
|
| [40] |
|
| [41] |
|
/
| 〈 |
|
〉 |
