
Journal of Tropical Oceanography >
Mangrove species classification in the Hainan Bamen Bay based on GF optics and fully polarimetric SAR
Copy editor: YIN Bo
Received date: 2022-05-03
Revised date: 2022-07-05
Online published: 2022-07-11
Supported by
National Natural Science Foundation of China(42106179)
Natural Resources Satellite Remote Sensing Operational Service System(121168000000190033)
High Resolution Marine Resources and Environment Remote Sensing Information Processing and Business Application Demonstration System (Phase Ⅱ)(41-Y30F07-9001-20/22)
A Reasonable interspecific composition structure of mangrove is the premise of effectively bringing into play the ecological value of mangrove wetland, and clear information of interspecific distribution of mangrove is an effective basis for mangrove ecosystem management and planning. For the mangrove wetland in the Hainan Bamen bay, based on GF-3 fully polarimetric Synthetic Aperture Radar (SAR) and GF-6 multi-spectral remote sensing data, 35 mangrove remote sensing features were extracted, and the importance ranking, feature screening and inter-species classification of mangrove were carried out using eXtreme Gradient Bo3osting (XGBoost) algorithm. The accuracy of XGBoost was compared with the traditional Support Vector Machine (SVM) and Random Forest (RF) machine learning algorithms, and the classification accuracy of three feature combination methods (preferred feature, multispectral feature and full polarization SAR feature) is compared based on the XGBoost algorithm.The purpose is to explore the applicability of XGBoost to mangrove interspecific classification and the ability of optical and fully polarized SAR data for mangrove interspecific classification. The results showed that: 1) The dominant features of mangrove species identification were multi-spectral spectral bands, polarization decomposition parameters, spectral vegetation index, and only the first eight (G, B, Ys, NIR, EVI, RVI, NDVI, Fs) were used to achieve high classification accuracy. 2) XGBoost has the highest overall classification accuracy of 86.16%, and Kappa has 0.836. The classification accuracy of this algorithm is 3% ~ 8% higher than SVM and RF. The accuracy of mangrove interspecific classification using multispectral and fully polarimetric SAR was 10% ~ 12% higher than that used multispectral or fully polarimetric SAR alone. 3) The total area of mangroves in the Bamen bay was 797.58 hm2, and there were 9 dominant true mangrove species, Avicennia marina, Bruguiera sexangular, Rhizophora stylosa, Sonneratia alba, Rhizophoraceae, Bruguiera gymnorrhiza, Lumnitzera racemosa Willd, Rhizophora apiculate, and Excoecaria agallocha Linn. The area of Sonneratia alba and Lumnitzera racemosa Willd were larger, accounting for 45.46% and 21.21% of the total mangrove area, respectively. In this paper, the interspecific classification of mangroves in the Bamen bay, Hainan province was studied based on high-resolution optics and fully-polarimetric SAR, which can provide data support and technical support for the protection and management of mangrove ecosystem.
ZHANG Chengfei , REN Guangbo , WU Peiqiang , HU Yabin , MA Yi , YAN Yu , ZHANG Jingrui . Mangrove species classification in the Hainan Bamen Bay based on GF optics and fully polarimetric SAR[J]. Journal of Tropical Oceanography, 2023 , 42(2) : 153 -168 . DOI: 10.11978/2022096
图1 研究区地理位置(a)、研究区GF-6影像(b)、研究区内不同极化方式的GF-3影像(c)基于标准地图服务网(http://bzdt.ch.mnr.gov.cn)下载的审图号为GS(2019)3266的标准地图制作, 底图无修改。图a中黑色方框为图b和图c各图位置。HH表示水平发射水平接收, HV表示水平发射垂直接收, VH表示垂直发射水平接收, VV表示垂直发射水平接收 Fig. 1 Geographical location of the study area (a), GF-6 image of the study area (b), Gf-3 images of different polarization modes in the study area (c). HH indicates horizontal transmission and horizontal reception, HV reveals horizontal transmission and vertical reception, VH indicates vertical transmission and horizontal reception, and VV indicates vertical transmission and horizontal reception |
表1 遥感数据参数介绍Tab. 1 Parameters of remote sensing data |
| 卫星 | 传感器 | 成像时间 | 波段信息 | 空间分辨率/m | 幅宽/km |
|---|---|---|---|---|---|
| 高分六号 | 全色/多光谱相机 | 2021年5月21日 | 红(0.63 ~ 0.69μm)/绿(0.52 ~ 0.60μm)/蓝(0.45 ~ 0.52μm)/近红外(0.76 ~ 0.90μm) | 8 | >90 |
| 全色(0.45 ~ 0.90μm) | 2 | ||||
| 高分三号 | 合成孔径雷达 | 2021年3月23日 | 水平发射水平接收/水平发射垂直接收/垂直发射水平接收/垂直发射垂直接收 | 8 | 30 |
表2 红树林类型及遥感影像解译描述Tab. 2 Mangrove types and interpretation of remote sensing images |
| 红树种类 | 现场照片 | GF-6影像 | GF-3影像 | 红树属性及影像特征 |
|---|---|---|---|---|
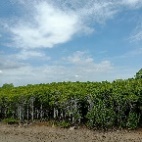
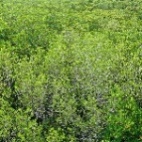
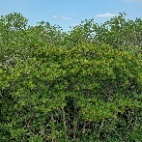
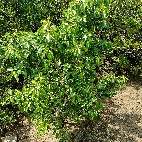
| 白骨壤(Avicennia marina) |  |  |  | 小叶、耐盐、耐淹、常绿灌木或小乔木、常分布于淡水注入较少的海湾区域。影像纹理略粗糙, 色调较均一, GF-6影像为暗红色, GF-3影像为紫色 |
| 海莲(Bruguiera sexangula) |  |  |  | 木榄属乔木或灌木, 生于滨海盐滩或潮水到达的沼泽地。影像纹理较平滑, 色调较均一, GF-6影像为亮红色, GF-3影像为白色 |
| 红海榄(Rhizophora stylosa Griff) |  |  |  | 支柱根、常绿乔木或灌木、较耐盐、多分布于河口外侧盐度较高的红树林内滩。影像纹理粗糙, 色调略杂乱, GF-6影像为暗红色, GF-3影像为紫色 |
| 杯萼海桑(Sonneratia alba Sm) |  |  |  | 海桑属灌木或乔木, 生于滨海泥滩和河流两侧而潮水到达的红树林群落中。影像纹理粗糙, 色调较均一, GF-6影像为暗红色中掺杂白色斑点, GF-3影像为灰绿色 |
| 角果木(Ceriops tagal) |  |  |  | 灌木或乔木, 耐盐性较强, 生于潮涨时仅淹没树干基部的泥滩和海湾内的沼泽地。影像纹理平滑细腻, 色调均一, GF-6影像为暗红色, GF-3影像浅红色 |
| 木榄(Bruguiera gymnorrhiza) |  |  |  | 常绿乔木或灌木, 耐淹能力较差、多分布于红树林内滩。影像纹理略粗糙, 色调较均一, GF-6影像为亮红色, GF-3影像为灰绿色 |
| 榄李(Lumnitzera racemosa Willd) |  |  |  | 使君子科、榄李属常绿灌木或小乔木, 喜生于中潮滩或高潮滩。影像纹理较平滑, 色调均一, GF-6影像为暗红色, GF-3影像为浅紫色 |
| 正红树(Rhizophora apiculata Bl) |  |  |  | 常绿小乔木或灌木, 分布于海浪平静、淤泥松软的浅海盐滩或海湾内的沼泽地。影像纹理平滑, 色调均一, GF-6影像为深红色, GF-3影像为蓝色 |
| 海漆(Excoecaria agallocha Linn) |  |  |  | 大戟科海漆属植物, 常绿乔木, 生于海陆交错区的高潮带或超高潮带的盐碱地上。影像纹理略粗糙, 色调较均一, GF-6影像为浅红色, GF-3影像为蓝绿色 |
表3 GF-6多光谱特征Tab. 3 Multispectral characteristics of GF-6 |
| 遥感特征 | 名称 | 公式 | 出处 |
|---|---|---|---|
| 光谱波段反射率 | B1 ~ B4 | — | |
| 植被指数 | 归一化植被指数(NDVI) | Rouse等(1974) | |
| 增强型植被指数(enhanced vegetation index, EVI) | Liu等(1995) | ||
| 比值植被指数(ratio vegetation index, RVI) | Pearson等(1972) | ||
| 纹理参数 | 相关性(correlation) | Haralick等(1973) | |
| 同质性(homogeneity) | |||
| 对比度(contrast) | |||
| 标准偏差(standard deviation) | |||
| 二阶矩阵(second moment) | |||
| 相异性(dissimilarity) | |||
| 均值(mean) | |||
| 信息熵(entropy) |
注: 分别为多光谱蓝、绿、红、近红外波段的反射率; Pi,j为第i行第j列处像元的亮度值占窗口中所有像元亮度值的比例; N为计算纹理特征时窗口的大小; ME为均值; Var为方差 |
表4 GF-3全极化SAR特征Tab. 4 SAR characteristics of GF-3 |
| 遥感特征 | 名称 | 公式 | 出处 | |
|---|---|---|---|---|
| 极化图像波段特征 | HH/HV/VH/VV | / / / | Souyris等(1995) | |
| 极化相关特征 | 共极化相干因子(polcoe) | Henderson等(1998) | ||
| HH与HV相关系数 (ρHH-HV) | Souyris等(1995) | |||
| VV与HV相关系数 (ρVV-HV) | Souyris等(1995) | |||
| 归一化圆极化基相关系数(NCCC) | 杨杰等(2012) | |||
| 极化分解特征 | Freeman分解 | 体散射分量 (Freeman_vol, Fv) | Freeman等(1998) | |
| 二次散射分量(Freeman_dbl, Fd) | ||||
| 面散射分量 (Freeman_surf, Fs) | ||||
| 雷达植被指数(RVI_Freeman) | ||||
| Yamaguchi分解 | 体散射分量(Yamaguchi_vol, Yv) | Yamaguchi等(2011) | ||
| 二次散射分量(Yamaguchi_dbl, Yd) | ||||
| 面散射分量(Yamaguchi_surf, Ys) | ||||
| 螺旋散射分量(Yamaguchi_cir, Yc) | ||||
| H/A/ 分解 | 极化熵H (entropy) | Cloude等(1996) | ||
| 极化各向异性A (anisotropy) | ||||
| 极化散射角 (alpha) | ||||
| Van雷达植被指数(RVI_Van) | Zyl等(2016) | |||
注: C为协方差矩阵, T为相干矩阵, S为极化散射矩阵; α、β为Freeman基于相干差矩阵分解的参数; λi、ei为Cloud基于相干矩阵分解的特征值和特征向量 |
图6 红树林种间分类结果a. XGBoost+优选特征; b. SVM+优选特征; c. XGBoost+多光谱特征; d. RF+优选特征; e. XGBoost+全极化SAR特征; f. 现场样本 Fig. 6 Results of interspecific classification of mangroves. (a) XGBoost + preferred features; (b) SVM + preferred features; (c) XGBoost + multispectral features; (d) RF + preferred features; (e) XGBoost + fully polarimetric SAR features; (f) field samples |
表5 分类精度评价Tab. 5 Classification accuracy evaluation % |
| 支持向量机 | 随机森林 | 极端梯度提升树 | ||||||||
|---|---|---|---|---|---|---|---|---|---|---|
| 优选特征 | 优选特征 | 优选特征 | 多光谱特征 | 全极化SAR特征 | ||||||
| PA/% | UA/% | PA/% | UA/% | PA/% | UA/% | PA/% | UA/% | PA/% | UA/% | |
| 白骨壤 | 76.47 | 65.00 | 100.00 | 83.33 | 94.74 | 90.00 | 66.67 | 50.00 | 85.71 | 85.71 |
| 海莲 | 84.93 | 69.66 | 86.25 | 75.82 | 82.47 | 89.89 | 87.38 | 63.22 | 79.01 | 74.42 |
| 红海榄 | 64.86 | 63.16 | 83.33 | 65.79 | 84.38 | 71.05 | 76.67 | 50.00 | 71.05 | 62.79 |
| 杯萼海桑 | 85.71 | 80.95 | 86.51 | 85.83 | 90.60 | 84.13 | 83.78 | 80.17 | 64.23 | 69.91 |
| 角果木 | 82.19 | 88.24 | 95.00 | 98.70 | 95.59 | 95.59 | 88.16 | 89.33 | 83.16 | 90.80 |
| 榄李 | 72.73 | 74.32 | 80.55 | 83.82 | 85.48 | 86.89 | 68.06 | 77.84 | 74.25 | 76.54 |
| 木榄 | 72.67 | 78.99 | 72.39 | 82.27 | 77.30 | 78.99 | 67.84 | 81.69 | 69.28 | 65.84 |
| 正红树 | 90.20 | 97.87 | 94.87 | 90.24 | 94.00 | 100.00 | 91.67 | 89.80 | 90.00 | 91.84 |
| 海漆 | 81.08 | 85.71 | 76.66 | 74.19 | 88.24 | 85.71 | 73.33 | 64.71 | 81.82 | 69.23 |
| 总体精度/% | 78.23 | 83.04 | 86.16 | 76.22 | 74.77 | |||||
| Kappa系数 | 0.7417 | 0.9800 | 0.8359 | 0.7174 | 0.7033 | |||||
表6 各组实验的算法参数Tab. 6 Algorithm parameters of each group of experiments |
| 实验组别 | 算法参数 |
|---|---|
| SVM+优选特征 | Kernel Type: 'RBF' Penalty=185; gamma=0.0001 |
| RF+优选特征 | n_estimators=120; max_depth=15; max_features=8 |
| XGBoost+优选特征 | learning_rate=0.06; n_estimators=252; max_depth=5; gamma=0.2 |
| XGBoost+多光谱特征 | learning_rate=0.09; n_estimators=10; max_depth=5; gamma=0.8 |
| XGBoost+全极化SAR特征 | learning_rate=0.09; n_estimators=10; max_depth=6; gamma=0.9 |
| [1] |
杜云艳, 周成虎, 1998. 水体的遥感信息自动提取方法[J]. 遥感学报, (4): 264-269.
|
| [2] |
范航清, 张云兰, 邹绿柳, 等, 2022. 中国红树林基准价值及其单株价值分配研究[J]. 生态学报, 42(4): 1262-1275.
|
| [3] |
何海军, 温家声, 张锦炜, 等, 2015. 海南红树林湿地生态系统服务价值评估[J]. 生态经济, 31(4): 145-149.
|
| [4] |
李森, 蔡厚才, 陈万东, 等, 2020. 海岸带生态恢复区不同林龄红树林对CH4和CO2排放通量的影响[J]. 生态环境学报, 29(12): 2414-2422.
|
| [5] |
林鹏, 2001. 中国红树林研究进展[J]. 厦门大学学报(自然科学版), (2): 592-603.
|
| [6] |
马云梅, 吴培强, 任广波, 等, 2019. 基于国产高分遥感的人工种植红树林种间分类方法研究——以广西茅尾海红树林为例[J]. 海洋技术学报, 38(4): 1-8.
|
| [7] |
马云梅, 吴培强, 任广波, 2021. 基于高分影像光谱特征的广西海岸带红树林精细分类与制图[J]. 地球信息科学学报, 23(12): 2292-2304.
|
| [8] |
农寿千, 杨小波, 李东海, 等, 2011. 清澜港红树林保护区植物特点研究[J]. 植物科学学报, 1(4): 459-466.
|
| [9] |
任广波, 周莉, 梁建, 等, 2021. “高分五号”高光谱互花米草遥感识别与制图研究[J]. 海洋科学进展, 39(2): 312-326.
|
| [10] |
邵永社, 韩阳, 吕倩利, 等, 2011. 4分量模型和散射参数的全极化雷达图像分类[J]. 同济大学学报(自然科学版), 39(9): 1345-1349.
|
| [11] |
苏岫, 赵冬至, 黄凤荣, 等, 2011. 基于高空间分辨率的红树林卫星遥感监测技术进展[J]. 热带海洋学报, 30(3): 38-45.
|
| [12] |
涂志刚, 吴瑞, 张光星, 等, 2015. 海南岛清澜港红树植物群落类型及其特征[J]. 热带农业科学, 35(11): 21-25.
|
| [13] |
徐晓然, 谢跟踪, 邱彭华, 2018. 1964—2015年海南省八门湾红树林湿地及其周边土地景观动态分析[J]. 生态学报, 38(20): 7458-7468.
|
| [14] |
杨杰, 赵伶俐, 李平湘, 等, 2012. 引入规范化圆极化相关系数的保持极化散射特性的分类算法[J]. 武汉大学学报(信息科学版), 37(8): 911-914.
|
| [15] |
杨众养, 薛杨, 宿少锋, 等, 2017. 文昌市八门湾红树林区植物群落特征调查[J]. 热带农业科学, 37(1): 48-52, 59.
|
| [16] |
郑德璋, 廖宝文, 郑松发, 等, 1995. 海南岛清澜港红树树种适应生境能力与水平分布[J]. 林业科学研究, 8(1): 67-72.
|
| [17] |
郑艺, 林懿琼, 周建, 等, 2019. 基于资源三号的雷州半岛红树林种间分类研究[J]. 国土资源遥感, 31(3): 201-208.
|
| [18] |
邹斌, 张腊梅, 孙德明, 等, 2009. PolSAR图像信息提取技术及应用的发展[J]. 遥感技术与应用, 24(3): 263-273.
|
| [19] |
|
| [20] |
|
| [21] |
|
| [22] |
|
| [23] |
|
| [24] |
|
| [25] |
|
| [26] |
|
| [27] |
|
| [28] |
|
| [29] |
|
| [30] |
|
| [31] |
|
| [32] |
|
| [33] |
|
| [34] |
|
| [35] |
|
| [36] |
|
| [37] |
|
| [38] |
|
| [39] |
|
| [40] |
|
| [41] |
|
| [42] |
|
| [43] |
|
| [44] |
|
| [45] |
|
| [46] |
|
| [47] |
|
| [48] |
|
| [49] |
|
| [50] |
|
| [51] |
|
| [52] |
|
| [53] |
|
| [54] |
|
/
| 〈 |
|
〉 |