
Journal of Tropical Oceanography >
Research on the multi-source satellite daytime sea fog detection technology based on cloud characteristics*
Copy editor: LIN Qiang
Received date: 2023-02-08
Revised date: 2023-03-11
Online published: 2023-03-23
Supported by
National Natural Science Foundation of China(41976165)
Advanced Program for FY Satellite Applications (2022)(FY-APP-2022.0610)
The separation of sea fog and low clouds is the current difficulty of sea fog monitoring, in order to improve the accuracy and real-time of daytime sea fog monitoring, a model of multi-satellite daytime sea fog detection based on cloud properties is established by analyzing the difference in the features of cloud properties, visible reflectance, brightness temperature, brightness temperature difference and texture features in the infrared bands between sea fog and cloud using the cloud and reflectivity products of MODIS (moderate resolution imaging spectroradiometer) on Terra/Aqua and VIIRS (visible infrared imaging radiometer suite) on S-NPP/NOAA-20 during eleven sea fog events from 2015 to 2020, which effectively separate low clouds from sea fog. Model precision was validated based on the true value of sea fog identified by CALIOP (cloud aerosol lidar with orthogonal polarization) backscattering and vertical feature mask products. The results showed that the highest probability of detection for MODIS(Terra), MODIS(Aqua), and VIIRS(S-NPP) sea fog identification were 0.97, 0.96, 0.89, respectively. There are more than 93.15% of the VIIRS(NOAA-20) sea fog detection images that show 80% consistency with VIIRS(S-NPP), indicating that the model can effectively monitor daytime sea fog. Meanwhile, based on the model presented in this paper, the consistency study of MODIS and VIIRS data is carried out, and the results show that the model has strong applicability and stability for different sensors and can realize the synergistic observation of the same sea fog process by multiple source satellites.
Key words: sea fog; cloud properties; cloud base height; MODSI; VIIRS
WANG Yu , HU Chenyue , QIU Zhongfeng , ZHAO Dongzhi , WU Daomao , LIAO Kuo . Research on the multi-source satellite daytime sea fog detection technology based on cloud characteristics*[J]. Journal of Tropical Oceanography, 2023 , 42(6) : 15 -28 . DOI: 10.11978/2023015
表1 用于日间海雾监测的卫星数据介绍Tab. 1 Introduction of satellite data used in daytime sea fog detection |
| 传感器 | 波段数目 | 空间分辨率/m | 时间分辨率 | 每日过境时当地时间 | 可获取时间段 |
|---|---|---|---|---|---|
| MODIS(Terra) | 36 | 1000 | 2次·d-1 | 10:30 | 2000-02-24至今 |
| MODIS(Aqua) | 36 | 1000 | 2次·d-1 | 13:30 | 2002-07-04至今 |
| VIIRS(NOAA-20) | 22 | 750 | 4h | 12:40 | 2018-01-05至今 |
| VIIRS(S-NPP) | 22 | 750 | 4h | 13:30 | 2012-01-19至今 |
表2 用于光谱辐射及云特性分析的海雾事件信息Tab. 2 Information of sea fog events used in the spectral radiance and cloud properties analysis |
| 序号 | 日期(年-月-日) | 区域 | 观测时间(UTC) | |||
|---|---|---|---|---|---|---|
| MODIS(Terra) | MODIS(Aqua) | VIIRS(S-NPP) | VIIRS(NOAA-20) | |||
| 1 | 2015-01-10 | 黄海 | 02:20 | 05:35 | 04:48, 04:54 | — |
| 2 | 2015-03-30 | 黄海 | 03:15 | — | 05:06, 03:30 | — |
| 3 | 2015-04-29 | 黄海、渤海 | — | 05:10 | 04:06, 04:29 | — |
| 4 | 2015-04-30 | 黄海 | 02:35 | — | 05:24 | — |
| 2015-05-01 | 黄海、东海 | 01:40, 03:15 | 04:55 | 05:06 | — | |
| 5 | 2015-06-09 | 黄海 | 03:20 | 05:00 | 04:36 | — |
| 6 | 2016-03-03 | 黄海 | 02:10 | 05:25 | 04:06, 05:48 | — |
| 2016-03-04 | 黄海、渤海 | 02:50 | 04:30 | 03:48, 05:30 | — | |
| 7 | 2018-03-24 | 黄海 | 03:05 | 04:40, 04:45 | 04:24 | 03:36, 05:12, 05:18 |
| 2018-03-25 | 黄海 | 02:10 | 05:25 | 04:06, 05:48 | 04:54, 05:00 | |
| 2018-03-26 | 黄海 | 02:50 | 04:30 | 03:48, 05:30 | — | |
| 8 | 2018-05-10 | 黄海 | 02:20 | 04:00, 05:35 | 04:42 | 03:54, 05:36 |
| 9 | 2020-02-12 | 渤海 | 02:50 | 04:30 | 03:48, 05:30 | — |
| 10 | 2020-05-16 | 黄海 | — | 04:40 | 04:24 | 05:18 |
| 11 | 2020-05-23 | 黄海 | 03:10 | 04:45 | 03:54 | 04:42 |
| 总计影像数 | 14景 | 15景 | 23景 | 9景 | ||
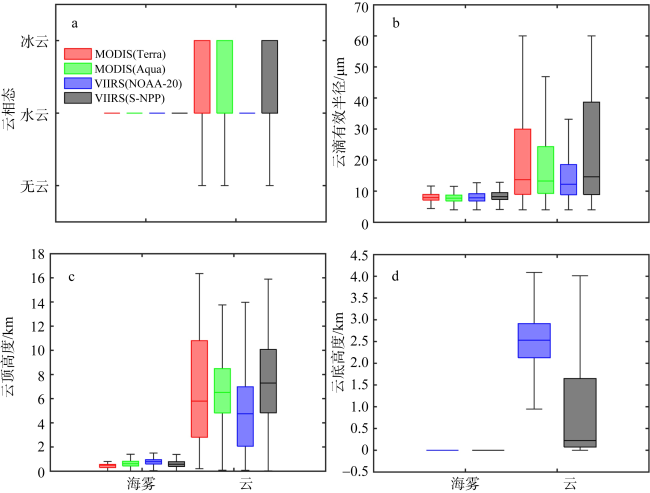
图1 渤海、黄海和东海内海雾及云的云相态(a)、云有效半径(b)、云顶高度(c)、云底高度(d)数据分布箱形图五条横线自上至下分别表示最大值、上四分位数、中位数、下四分位数及最小值, 竖线指示数据的变化范围 Fig. 1 Box plot of cloud phase(a); cloud effective radius(b); cloud top height(c); cloud base height(d) of sea fog and cloud in Bohai Sea, Yellow Sea and East China Sea. The five horizontal lines in box plot from top to bottom represent the maximum value, upper quartile, median, lower quartile, and minimum value, respectively, while the vertical lines indicate the range of data variation |
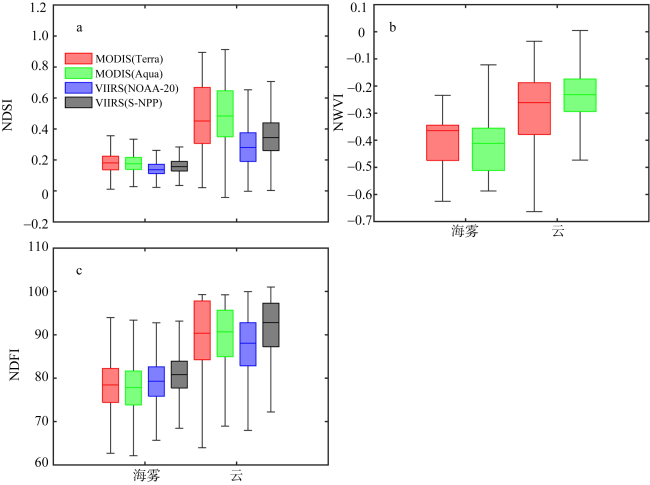
图2 渤海、黄海和东海内海雾及云的归一化积雪指数(a)、归一化水汽指数(b)和归一化雾指数(c)数据分布箱形图5条横线自上至下分别表示最大值、上四分位数、中位数、下四分位数及最小值, 竖线指示数据的变化范围 Fig. 2 Box plot of normalized difference snow index(a); normalized water vapor index(b); normalized difference fog index(c) of sea fog and cloud in Bohai Sea, Yellow Sea and East China Sea. The five horizontal lines in box plot from top to bottom represent the maximum value, upper quartile, median, lower quartile, and minimum value, respectively, while the vertical lines indicate the range of data variation |
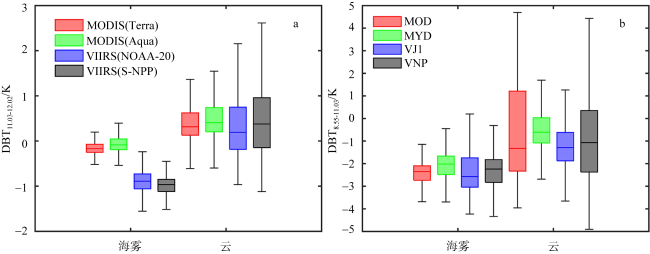
图3 渤海、黄海和东海内海雾及云的11.03和12.02μm波段的亮温差(a), 以及8.55和11.03μm波段的亮温差(b)数据分布箱形图五条横线自上至下分别表示最大值、上四分位数、中位数、下四分位数及最小值, 竖线指示数据的变化范围 Fig. 3 Box plot of brightness temperature difference between the bands of 11.03 and 12.02 μm (a); brightness temperature difference between the bands of 8.55 and 11.03 μm (b) of sea fog and cloud in Bohai Sea, Yellow Sea and East China Sea. The five horizontal lines in box plot from top to bottom represent the maximum value, upper quartile, median, lower quartile, and minimum value, respectively, while the vertical lines indicate the range of data variation |
图4 渤海、黄海和东海内海雾及云的热红外通道亮温的标准偏差分布箱形图五条横线自上至下分别表示最大值、上四分位数、中位数、下四分位数及最小值, 竖线指示数据的变化范围 Fig. 4 Box plot of the standard deviation of brightness temperature in thermal infrared channel of sea fog and cloud in Bohai Sea, Yellow Sea and East China Sea. The five horizontal lines in box plot from top to bottom represent the maximum value, upper quartile, median, lower quartile, and minimum value, respectively, while the vertical lines indicate the range of data variation |
表3 2022年5月20日4时45分MYD06与MVCM云产品的一致性Tab. 3 Consistency between the cloud product from MYD06 and MVCM on May 20th, 2022 at 4:45 |
| 相关系数 | 显著性 | |
|---|---|---|
| 云掩膜 | 0.95 | 1 |
| 云相态 | 0.92 | 1 |
| 云顶高度 | 0.84 | 1 |
| 云有效半径 | 0.99 | 1 |
表4 2015年5月1日MODIS(Aqua)与VIIRS(S-NPP)波段交叉校正参数Tab. 4 Cross-correction parameters between MODIS(Aqua) and VIIRS(S-NPP) on May 1st, 2015 |
| 校正数据 | MODIS波段 | MODIS中心波长/μm | VIIRS中心波长/μm | 拟合斜率 | 拟合截距 | 决定系数 |
|---|---|---|---|---|---|---|
| 反射率 | 1 | 0.645 | 0.672 | 1.03 | 0.01 | 0.87 |
| 3 | 0.469 | 0.488 | 1.01 | 0.01 | 0.87 | |
| 7 | 2.13 | 2.25 | 1.12 | 0.00 | 0.84 | |
| 辐亮度 | 20 | 3.75 | 3.70 | 0.99 | -0.03 | 0.72 |
| 亮温 | 29 | 8.55 | 8.55 | 0.85 | 39.90 | 0.72 |
| 31 | 11.03 | 10.763 | 0.86 | 39.70 | 0.72 | |
| 32 | 12.02 | 12.013 | 0.85 | 43.17 | 0.70 |
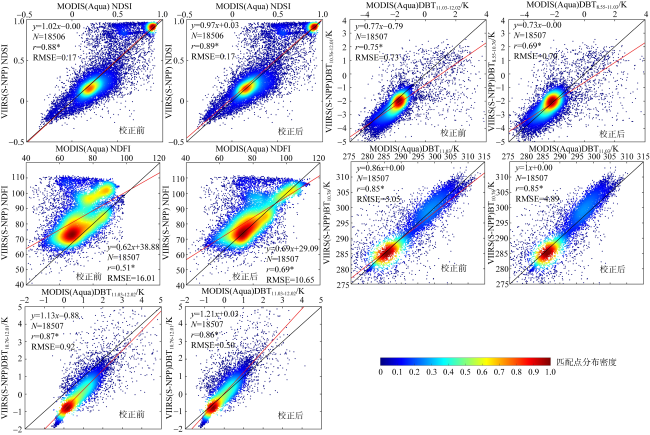
图5 校正前后MODIS(Aqua)与VIIRS(S-NPP)的归一化积雪指数、归一化雾指数、亮温差和热红外通道亮温对比图黑色实线为1:1线; 红色实线为回归线; *表示通过95%的显著性检验 Fig. 5 Normalized difference snow index, normalized water vapor index, brightness temperature difference and brightness temperature in thermal infrared channel before and after calibration, where the solid black line is the 1:1 line, the solid red line is the regression line, and the asterisk (*) indicates passing the 95% significance test |
图9 2021年3月25日04:54 VIIRS(S-NPP)彩色合成图与CALIOP提取海雾点(a)以及2021年3月25日CALIOP海雾监测结果(b)b中A为CALIOP直接测得的海雾, B为云下雾, C为由于CALIOP无法穿透较厚海雾而产生的误判点 Fig. 9 VIIRS (S-NPP) color-composite image with sea fog points extracted by CALIOP at 04:45 on March 25, 2021 (a) and sea fog detection result based on data of CALIOP on March 25, 2021(b). In figure (b), A is sea fog directly measured by CALIOP, B is sea fog under clouds, C is the misjudged points due to the inability to transmit through the thicker sea fog of CALIOP |
表5 基于CALIOP数据的日间海雾监测模型精度验证Tab. 5 Validation of daytime sea fog detection model based on CALIOP data |
| 卫星 | 评价指标 | 时间窗口/h | |||||
|---|---|---|---|---|---|---|---|
| 1.0 | 1.5 | 2.0 | 2.5 | 3.0 | 3.5 | ||
| MODIS(Terra) | 雾点数目 | 0 | 0 | 0 | 17 | 1855 | 1977 |
| 召回率 | 0 | 0 | 0 | 0 | 0.97 | 0.94 | |
| 准确度 | 0 | 0 | 1.00 | 0.94 | 0.93 | 0.90 | |
| MODIS(Aqua) | 雾点数目 | 98 | 1958 | 1994 | 1994 | 1994 | 1994 |
| 召回率 | 0.66 | 0.96 | 0.94 | 0.94 | 0.94 | 0.94 | |
| 准确度 | 0.86 | 0.89 | 0.89 | 0.89 | 0.89 | 0.89 | |
| VIIRS(S-NPP) | 雾点数目 | 2056 | 2081 | 2185 | 2185 | 2185 | 2185 |
| 召回率 | 0.89 | 0.88 | 0.84 | 0.84 | 0.84 | 0.84 | |
| 准确度 | 0.96 | 0.97 | 0.96 | 0.96 | 0.96 | 0.96 | |
| VIIRS(NOAA-20) | 雾点数目 | 210 | 211 | 327 | 327 | 327 | 327 |
| 召回率 | 0.49 | 0.48 | 0.57 | 0.57 | 0.57 | 0.57 | |
| 准确度 | 0.89 | 0.91 | 0.91 | 0.91 | 0.91 | 0.91 | |
注: 雾点数目为匹配像元中CALIPSO探测结果为海雾的像元数目 |
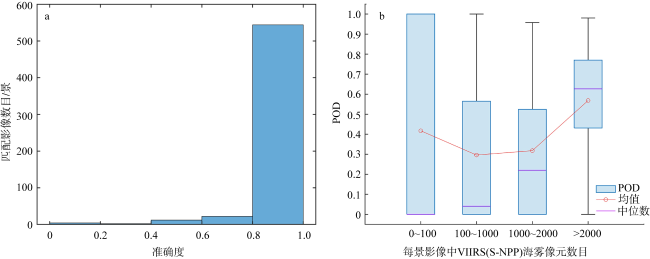
图10 VIIRS(NOAA-20)与VIIRS(S-NPP)匹配影像中VIIRS(NOAA-20)的海雾探测准确度分布(a)及每景匹配影像中VIIRS(S-NPP)海雾像元数目与召回率(POD)的分布箱形图(b)箱形图中的五条横线自上至下分别表示最大值、上四分位数、中位数、下四分位数及最小值, 竖线指示数据的变化范围 Fig. 10 Distribution of sea fog detection accuracy of VIIRS (NOAA-20) in matched images between VIIRS (NOAA-20) and VIIRS (S-NPP) (a) and the box plot of the distribution of the number of sea fog pixels with probability of detection (POD) of VIIRS (S-NPP) in each matched image (b). The five horizontal lines in box plot from top to bottom represent the maximum value, upper quartile, median, lower quartile, and minimum value, respectively, while the vertical lines indicate the range of data variation |
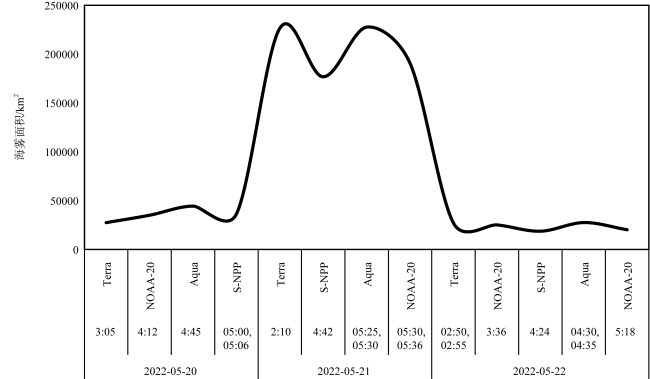
图11 2022年5月20~22日Terra、Aqua、S-NPP及NOAA-20彩色合成图及海雾检测结果红色区域表示海雾, 白色实线表示海陆分界线 Fig. 11 Color-composite images and sea fog detection results based on data of Terra, Aqua, S-NPP and NOAA-20 during May 20~22, 2022, with red areas indicating sea fog and white solid lines indicating the sea-land divide |
| [1] |
傅刚, 王菁茜, 张美根, 等, 2004. 一次黄海海雾事件的观测与数值模拟研究——以2004年4月11日为例[J]. 中国海洋大学学报(自然科学版), 34(5): 720-726, 926.
|
| [2] |
耿丹, 刘婷婷, 李超, 2022. 结合FY-4A卫星及随机森林的日间沿海海雾识别模型的研究[J]. 海洋预报, 39(3): 83-93.
|
| [3] |
郝姝馨, 郝增周, 黄海清, 等, 2021. 基于Himawari-8数据的夜间海雾识别[J]. 海洋学报, 43(11): 166-180.
|
| [4] |
胡晨悦, 丘仲锋, 廖廓, 等, 2022. 福建海雾的CALIOP遥感监测及基于Himawari-8的云下雾光谱特征分析[J]. 热带海洋学报: 1-10.
|
| [5] |
刘照民, 康琮, 2011. 琼州海峡船舶雾航安全管理[J]. 中国海事, (2): 28-30.
|
| [6] |
史得道, 黄彬, 吴振玲, 2018. 2016年春季一次黄渤海明显海雾过程的大气海洋特征分析[J]. 海洋预报, 35(5): 85-92.
|
| [7] |
苏婧, 2019. 基于主被动遥感的海雾探测方法研究[D]. 青岛: 中国石油大学(华东):19-21.
|
| [8] |
张苏平, 鲍献文, 2008. 近十年中国海雾研究进展[J]. 中国海洋大学学报(自然科学版), 38(3): 359-366.
|
| [9] |
|
| [10] |
|
| [11] |
|
| [12] |
|
| [13] |
|
| [14] |
|
| [15] |
|
| [16] |
|
| [17] |
|
| [18] |
|
| [19] |
|
| [20] |
|
| [21] |
|
| [22] |
|
| [23] |
|
/
| 〈 |
|
〉 |


