
Journal of Tropical Oceanography >
Study on comprehensive risk assessment of storm surges for Fujian Province from the perspective of resilience
Copy editor: SUN Cuici
Received date: 2023-04-13
Revised date: 2023-05-02
Online published: 2023-06-14
Supported by
Fujian Marine Disaster Basic Investigation and Assessment Project([3500]MZZJ[GK]2022003)
Fujian Academy of Social Science "Evaluation and Path Research of Fujian 'five in one' Coordinated Development" project
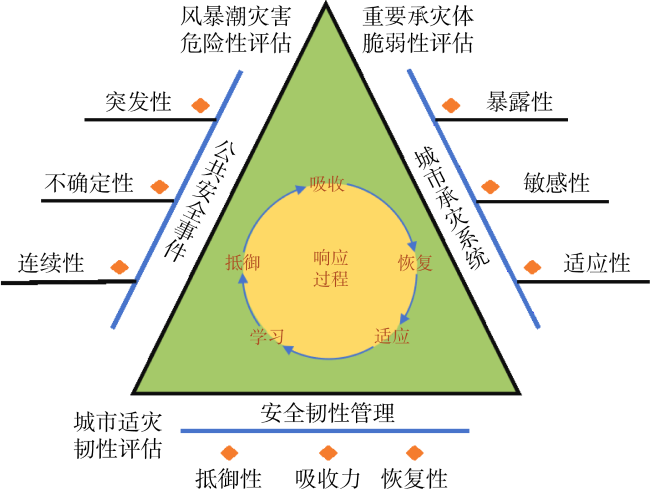
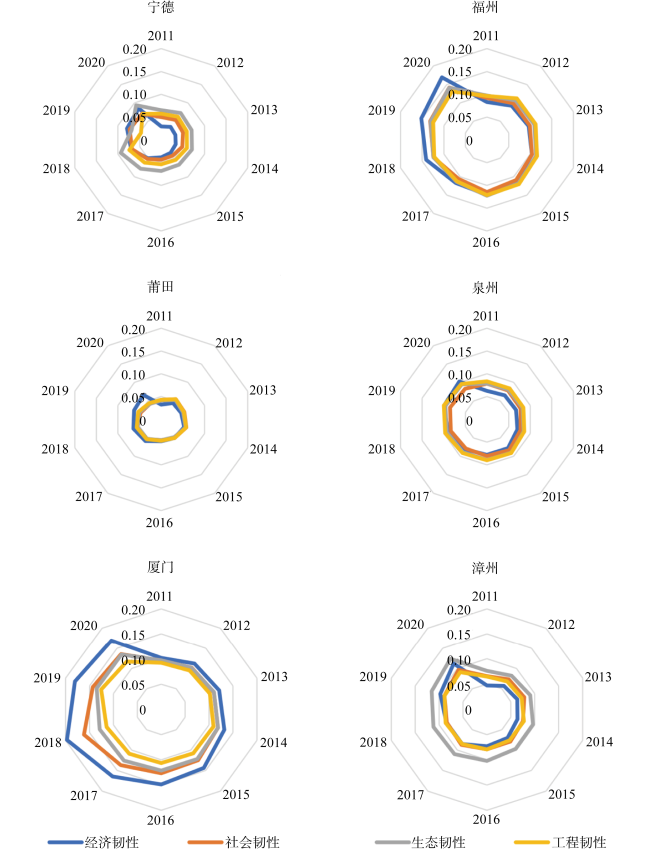
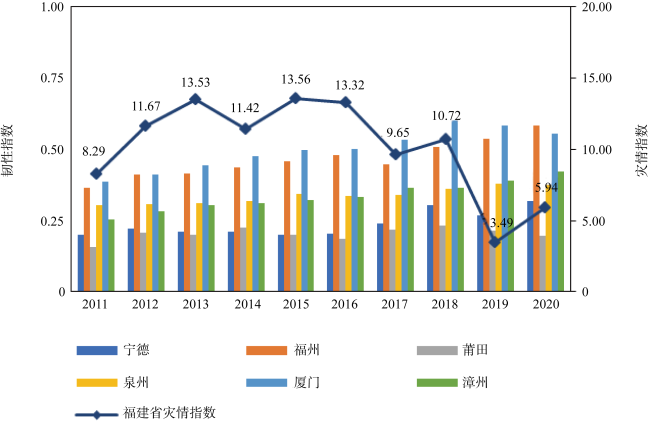
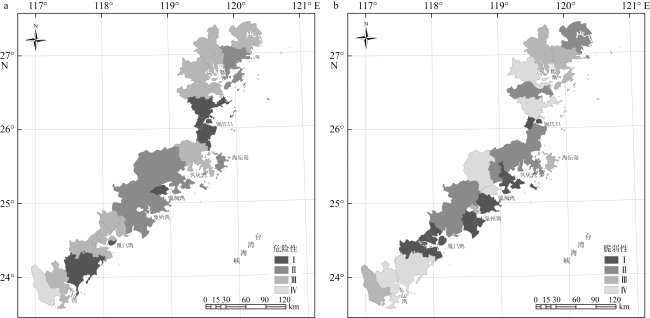
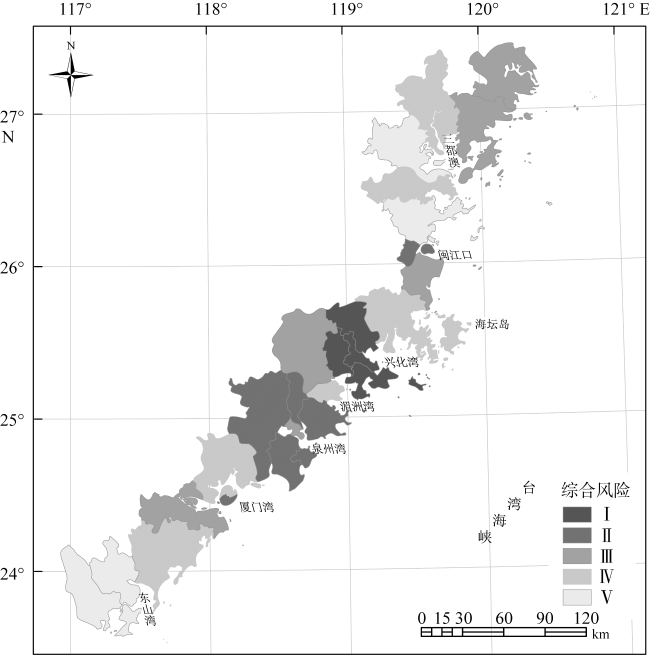
Based on the triangle model of urban safety resilience, this paper constructs a comprehensive risk assessment framework for storm surge disasters from the perspective of resilient cities. By using the data of 33 coastal districts in Fujian Province from 2011 to 2020, and through the urban resilience evaluation index system, this paper scientifically evaluates the spatial-temporal differentiation characteristics of urban resilience level in Fujian Province. With the help of geographic information analysis tools to evaluate hazard, vulnerability of storm surge disasters and urban resilience, the comprehensive risk assessment of storm surge disasters at the regional scale for Fujian Province is realized. The results show that: (1) the resilience level of coastal cities in Fujian Province in 2020 is at a descending order: Fuzhou, Xiamen, Zhangzhou, Quanzhou, Ningde, Putian; (2) with the improvement of urban resilience level, the storm surge disaster index of Fujian Province is showing a downward trend; (3) the comprehensive storm surge risk level I zone is mainly distributed along the Xinghua Bay and Meizhou Bay in Putian City; (4) we should pay attention to estuaries, trumpet shaped bays and other areas, focus on preventing typhoon storm surges along the northern and central routes, and formulate marine disaster prevention countermeasures and resilient city construction plans according to local conditions.
Key words: storm surge; urban resilience; disaster index; risk assessment
DING Yiting , DONG Dibo . Study on comprehensive risk assessment of storm surges for Fujian Province from the perspective of resilience[J]. Journal of Tropical Oceanography, 2024 , 43(1) : 126 -136 . DOI: 10.11978/2023048
表1 风暴潮灾害风险等级与危险性、脆弱性对应关系表Tab. 1 Relationship between storm surge disaster risk, hazard and vulnerability level |
| 脆弱性 危险性 | 低(Ⅳ级) [0.1, 0.3] | 中低(Ⅲ级) (0.3, 0.5] | 中高(Ⅱ级) (0.5, 0.8] | 高(I级) (0.8, 1] |
|---|---|---|---|---|
| 低(Ⅳ级) | 低风险 (V级) | 低风险 (V级) | 中低风险 (Ⅳ级) | 中低风险 (Ⅳ级) |
| 中低(Ⅲ级) | 低风险 (V级) | 中低风险 (Ⅳ级) | 中风险 (Ⅲ级) | 中风险 (Ⅲ级) |
| 中高(Ⅱ级) | 中低风险 (Ⅳ级) | 中风险 (Ⅲ级) | 中高风险 (Ⅱ级) | 中高风险 (Ⅱ级) |
| 高(I级) | 中低风险 (Ⅳ级) | 中风险 (Ⅲ级) | 中高风险 (Ⅱ级) | 高风险 (I级) |
表2 风暴增水等级划分标准(单位: 厘米)Tab. 2 Standard for classification of storm surge levels (cm) |
| 等级 | I (特强) | Ⅱ (强) | Ⅲ (较强) | Ⅳ(中等) | V (一般) |
|---|---|---|---|---|---|
| 风暴增水 | >250 | (200, 250) | (150, 200) | (100, 150) | (50, 100) |
表3 风暴潮超警戒等级划分等级Tab. 3 Classification of storm surge exceeding warning level |
| 等级 | I (特别严重) | Ⅱ (严重) | Ⅲ (较重) | Ⅳ(一般) |
|---|---|---|---|---|
| 超警戒级别 | 红 | 橙 | 黄 | 蓝 |
表4 单站风暴潮灾害危险性等级划分Tab. 4 Risk classification of single station storm surge disasters |
| 等级 | I | Ⅱ | Ⅲ | Ⅳ |
|---|---|---|---|---|
| ${{D}_{g}}$. | ≥7.0 | [3.5, 7.0) | [2.0, 3.5) | <2.0 |
表5 城市适灾韧性评价指标体系Tab. 5 Evaluation index system for urban disaster resilience |
| 子目标层 | 评价指标层 | 单位 | 性质 | 权重 |
|---|---|---|---|---|
| 经济韧性 | 人均GDP | 元·人−1 | + | 0.05325 |
| 人均固定资产投资 | 元·人−1 | + | 0.04125 | |
| 人均金融机构存款余额 | 元·人−1 | + | 0.03525 | |
| 第三产业占GDP比重 | % | + | 0.04950 | |
| 公共财政收入占GDP比重 | % | + | 0.02325 | |
| 教育支出占财政支出比重 | % | + | 0.02375 | |
| 科学支出占财政支出比重 | % | + | 0.02375 | |
| 社会韧性 | 城镇登记失业率 | % | − | 0.02550 |
| 卫生技术人数比重 | % | + | 0.04125 | |
| 公共管理和社会组织就业人数比重 | % | + | 0.03400 | |
| 人均医疗卫生机构床位数 | 张·人−1 | + | 0.04075 | |
| 人均保险保费 | 元·人−1 | + | 0.03925 | |
| 公共安全支出占财政支出比重 | % | + | 0.03550 | |
| 粮油物资储备支出占财政支出比重 | % | + | 0.03375 | |
| 生态韧性 | 人均绿地面积 | 公顷·人−1 | + | 0.05925 |
| 绿化覆盖率 | % | + | 0.03300 | |
| 污水处理率 | % | + | 0.02925 | |
| 生活垃圾无害化处理率 | % | + | 0.02950 | |
| 工业固体废物综合利用率 | % | + | 0.03150 | |
| 万元GDP工业废水排放总量 | 吨·万元−1 | − | 0.03400 | |
| 万元GDP工业废水中COD排放量 | 吨·万元−1 | − | 0.03350 | |
| 工程韧性 | 人均公路线路里程 | 千米·人−1 | + | 0.04325 |
| 人均生活用水量 | 吨·人−1 | − | 0.03300 | |
| 人均用电量 | 千瓦时·人−1 | − | 0.03175 | |
| 燃气普及率 | % | + | 0.02625 | |
| 互联网用户数比重 | % | + | 0.04550 | |
| 人均拥有公共汽电车辆数 | 辆·人−1 | + | 0.02575 | |
| 排水管道密度 | 千米·平方千米−1 | + | 0.04450 |
注: 表中“性质” 列中“+”表示该项指标为正向指标, 即指标值越大则评价越好; “−”表示该项指标为逆向指标, 即指标值越小则评价越好。 |
表6 2011—2020年风暴潮过程和福建沿海城市灾情等级指数Tab. 6 Storm surge process and disaster level index of Fujian coastal cities from 2011 to 2020 |
| 年份 | 风暴潮过程 | 宁德 | 福州 | 莆田 | 泉州 | 厦门 | 漳州 |
|---|---|---|---|---|---|---|---|
| 2011 | 1105(其他路径); 1109(北部路径); 1111(南部路径) | 7.824 | 4.268 | 5.160 | 0.000 | 0.000 | 3.327 |
| 2012 | 1205(其他路径); 1209(北部路径); 1214(其他路径) | 10.834 | 8.494 | 0.000 | 0.000 | 0.000 | 0.000 |
| 2013 | 1307(北部路径); 1312(北部路径); 1319(南部路径); 1323(北部路径) | 12.520 | 10.871 | 0.000 | 4.281 | 0.000 | 8.416 |
| 2014 | 1407(其他路径); 1410(中部路径); 1416(其他路径) | 8.697 | 9.010 | 8.301 | 2.861 | 0.615 | 9.105 |
| 2015 | 1509(北部路径); 1513(中部路径); 1521(中部路径) | 11.667 | 12.154 | 9.771 | 5.491 | 2.534 | 6.351 |
| 2016 | 1601(南部路径); 1614(南部路径); 1617(中部路径); 1622(南部路径) | 10.059 | 9.535 | 1.973 | 9.114 | 8.621 | 7.468 |
| 2017 | 1709(中部路径) | 8.356 | 8.674 | 3.409 | 0.000 | 0.000 | 4.648 |
| 2018 | 1808(北部路径); 1822(南部路径) | 9.900 | 9.134 | 0.002 | 0.000 | 0.000 | 2.026 |
| 2019 | 1911(南部路径); 1918(北部路径) | 2.916 | 0.007 | 0.000 | 0.000 | 0.000 | 2.860 |
| 2020 | 2006(南部路径) | 0.000 | 0.000 | 0.000 | 0.000 | 0.000 | 5.938 |
| [1] |
陈梦远, 2017. 国际区域经济韧性研究进展——基于演化论的理论分析框架介绍[J]. 地理科学进展, 36(11): 1435-1444.
|
| [2] |
陈晓红, 娄金男, 王颖, 2020. 哈长城市群城市韧性的时空格局演变及动态模拟研究[J]. 地理科学, 40(12): 2000-2009.
|
| [3] |
冯利华, 1993. 灾害损失的定量计算[J]. 灾害学, 8(2): 17-19.
|
| [4] |
郭文云, 安佰超, 裘诚, 等, 2021. 基于多源数据的台风风暴潮概率预报研究: 数值预报系统[J]. 海洋预报, 38(2): 1-11.
|
| [5] |
黄弘, 李瑞奇, 范维澄, 等, 2018. 安全韧性城市特征分析及对雄安新区安全发展的启示[J]. 中国安全生产科学技术, 14(7): 5-11.
|
| [6] |
李睿倩, 徐成磊, 李永富, 等, 2022. 国外海岸带韧性研究进展及其对中国的启示[J]. 资源科学, 44(2): 232-246.
|
| [7] |
罗紫元, 曾坚, 2021. 城市化品质、城市韧性与“台风-暴雨”灾害风险分析—以7个东南沿海省市为例[J]. 科技导报, 39(15): 124-134.
|
| [8] |
石婷婷, 2016. 从综合防灾到韧性城市:新常态下上海城市安全的战略构想[J]. 上海城市规划, (1): 13-18.
|
| [9] |
宋国煜, 郭文云, 葛建忠, 等, 2023. 基于多源数据的长江口概率风暴潮预报系统[J]. 海洋预报, 40(1): 10-20.
|
| [10] |
夏丽花, 邬惠明, 刘铭, 等, 2014. 热带气旋影响福建沿海风暴潮特征分析[J]. 热带海洋学报, 33(3): 40-45.
|
| [11] |
张明斗, 冯晓青, 2018. 中国城市韧性度综合评价[J]. 城市问题, (10): 27-36.
|
| [12] |
赵广生, 牛小静, 2022. 海南岛历史风暴潮模拟和灾害风险评估[J]. 水动力学研究与进展, 37(6): 831-836.
|
| [13] |
郑艳, 林陈贞, 2017. 韧性城市的理论基础与评估方法[J]. 城市, (6): 22-28. (in Chinese).
|
| [14] |
中华人民共和国自然资源部, (2022-04-08) [2022-04-08]. 2021年中国海平面公报[EB/OL]. http://gi.mnr.gov.cn/202205/t20220507_2735509.html
|
| [15] |
中华人民共和国自然资源部, (2022-04-08)[2023-04-10]. 2011—2020年中国海洋灾害公报[EB/OL]. https://www.mnr.gov.cn/sj/sjfw/hy/gbgg/zghyzhgb/
|
| [16] |
HY/T0273-2019. 2019-12-10. 海洋灾害风险评估和区划技术导则第1部分:风暴潮[S]. 北京: 中国标准出版社.
|
| [17] |
|
| [18] |
|
| [19] |
|
| [20] |
|
| [21] |
|
| [22] |
|
| [23] |
|
/
| 〈 |
|
〉 |
