
Journal of Tropical Oceanography >
Impacts of the anomalous southwest tropical Indian Ocean SST warming on Indo-Pacific climate from April to June based on the CESM model*
Copy editor: YIN Bo
Received date: 2023-07-24
Revised date: 2023-09-04
Online published: 2023-09-13
Supported by
National Key R&D Projects of China(2019YFA0606703)
Strategic Priority Research Program of the Chinese Academy of Sciences(XDB42010305)
National Natural Science Foundation of China(42175043)
Youth Innovation Promotion Association CAS(2022347)
Independent Research Project Program of State Key Laboratory of Tropical Oceanography(LTOZZ2102)
The thermocline depth in the southwest tropical Indian Ocean (TIO) is shallow, and thermocline variations are closely related to the sea surface temperature, making southwest TIO feature a unique ocean-atmosphere interaction. Based on the observation and model data, this study analyzed the climatic effects of the southwest TIO SST warming on the tropical Indo-Western Pacific from April to June. The results show that the local convective activities are enhanced by the warming of the southwest TIO from April to June, and the precipitation in the southwest TIO increases. In the lower troposphere of the tropical Indian Ocean, a “C-shaped” wind anomaly pattern appears with abnormal northeast winds north of the equator and abnormal northwest winds south of the equator. From May to June, abnormal north-easterly winds in the North Indian Ocean can weaken the Asian summer monsoon, reduce the latent heat release of the North Indian Ocean, and warm the North Indian Ocean. The climatic effect of the southwest TIO SST warming is not limited to the tropical Indian Ocean region. The warming can heat the tropospheric atmosphere and stimulate the eastward atmospheric Kelvin wave, and the easterly wind response in the lower troposphere of the tropical northwest Pacific Ocean can also trigger local positive ocean-atmosphere feedback under the background of trade winds. Both are conducive to the maintenance of anticyclonic wind anomaly at the lower troposphere of the tropical northwest Pacific. The anticyclonic wind anomaly can enhance the monsoon water vapor transport in May and June, which makes the rainfall increase significantly over the Yangtze River Valley in China. This study reveals that the heating anomaly in the southwest TIO could cause ocean-atmosphere interaction across the north Indian Ocean and tropical western North Pacific Ocean, which would provide a useful reference for the summer precipitation forecast in eastern China.
CHEN Zesheng , LI Zhenning , GUO Yuanyuan , WANG Teng , DU Yan . Impacts of the anomalous southwest tropical Indian Ocean SST warming on Indo-Pacific climate from April to June based on the CESM model*[J]. Journal of Tropical Oceanography, 2024 , 43(2) : 12 -20 . DOI: 10.11978/2023097
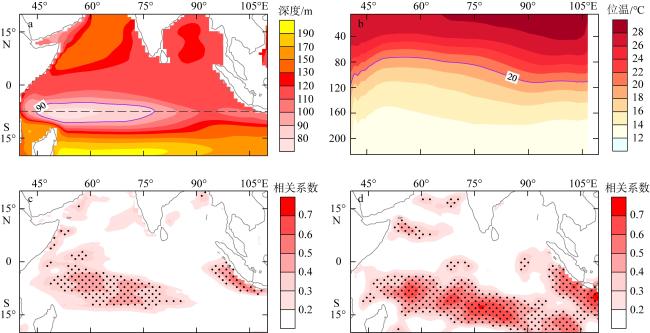
图1 热带西南印度洋独特的气候特征a. 热带印度洋年平均温跃层深度, 虚线表示7°30′S; b. 沿着7°30′S的海水位温的经度-深度横截面; c. 局地海表温度与平均温跃层深度的相关系数的空间分布; d. 4至6月平均的局地海表温度与降水的相关系数的空间分布。图c和d中黑点填充的区域表示该合成的异常值通过置信水平为90%的显著性检验。该图基于自然资源部标准地图服务网站下载的审图号为GS(2016)1665号标准地图制作, 底图无修改 Fig. 1 The unique climatic characteristics of the southwest tropical Indian Ocean. (a) Annual mean thermocline depth (D20) in the tropical Indian Ocean; (b) the longitude-depth cross section of sea water potential temperature along the 7°30′S; (c) the spatial pattern of point-to-point correlation between monthly SST and D20; (d) the spatial pattern of point-to-point correlation between SST and precipitation during April-May-June. |
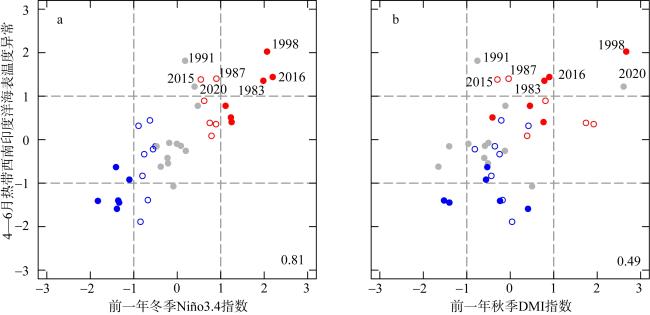
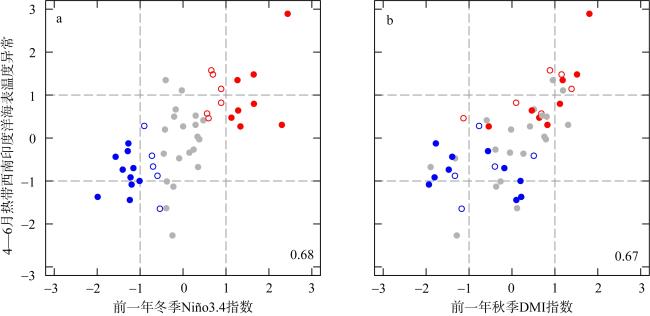
图3 热带西南印度洋(2°30′—12°30′S, 50°—80°E) 4—6月平均的海表温度异常与前一年冬季(前一年11月至次年1月) Niño3.4海表温度指数(a)和与前一年秋季(前一年9月至11月) DMI指数 (b)的散点图所有数据已做标准化处理。红色(蓝色)实心圆点表示前冬为强厄尔尼诺(拉尼娜), 红色(蓝色)空心圆点表示前冬为弱厄尔尼诺(拉尼娜), 灰色圆点表示正常年份, 圆点数字表示年份。图中右下角的数字表示相关系数 Fig. 3 Scatter plot of the April—June SST anomaly in the southwest tropical Indian Ocean (2°30′—12°30′S, 50°—80°E) versus the previous winter (November to January) Niño 3.4 SST index (a) and the previous autumn (September to November) DMI (b). All the data were standardized. A red (blue) solid dot denotes a strong El Niño (La Niña) in the previous winter, and a red (blue) hollow dot denotes a weak El Niño (La Niña) in the previous winter |
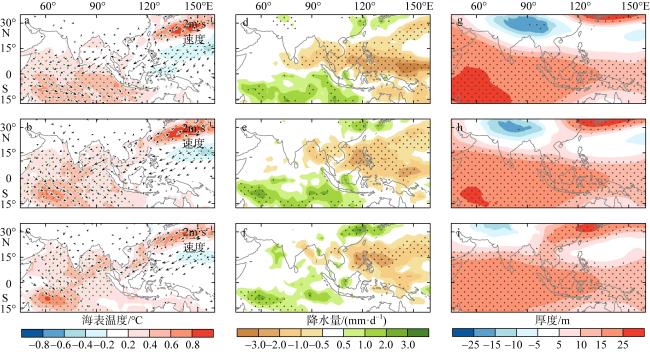
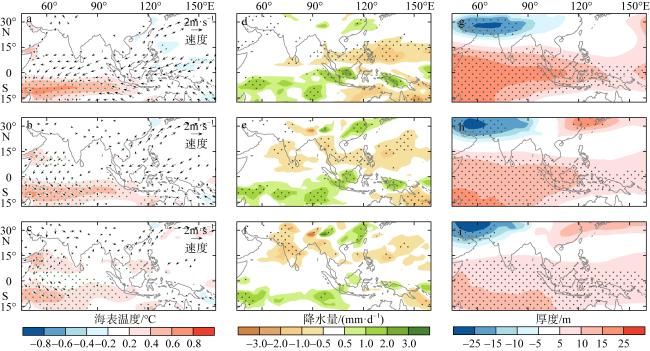
图4 热带西南印度洋4—6月平均海表温度异常偏暖时的海表温度、近地表风、降水和对流层厚度异常的合成图a~c. 4—6月的海表温度和近地表风; d~f. 4—6月的降水; g~i. 4—6月的对流层厚度。黑点填充的区域表示该合成的异常值通过置信水平为90%的显著性检验。该图基于自然资源部标准地图服务网站下载的审图号为GS(2016)1665号标准地图制作, 底图无修改 Fig. 4 Composited SST, surface wind, precipitation, and tropospheric thickness anomalies when strong April—June SST warming occurred in the southwest tropical Indian Ocean. (a) ~ (c) for SST and surface wind from April to June; (d) ~ (f) for precipitation from April to June; (g) ~ (i) for tropospheric thickness from April to June. Stippling denotes the composite anomalies passing the two-tailed Student’s t-test with a 90% significance level |
图5 CESM 控制实验中热带西南印度洋(2°30′—12°30′S, 50°—80°E) 4—6月平均的海表温度异常与前一年冬季(前一年11月至次年1月) Niño3.4海表温度指数(a)和与前一年秋季(前一年9月至11月) DMI指数 (b)的散点图所有数据已做标准化处理。红色(蓝色)实心圆点表示前冬为强厄尔尼诺(拉尼娜), 红色(蓝色)空心圆点表示前冬为弱厄尔尼诺(拉尼娜), 灰色圆点表示正常年份, 图中右下角的数字表示相关系数 Fig. 5 Scatter plot of the April—June SST anomaly in the southwest tropical Indian Ocean (2°30′—12°30′S, 50°—80°E) versus the previous winter (November to January) Niño3.4 SST index (a) and the previous autumn (September to November) DMI (b) in the CESM control experiment |
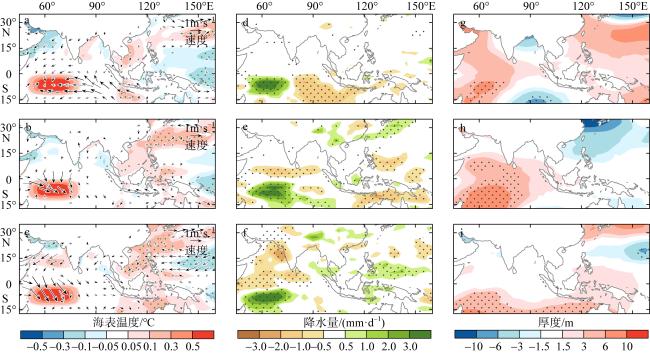
图6 CESM控制实验中热带西南印度洋4—6月平均海表温度异常偏暖时的海表温度、近地表风、降水和对流层厚度异常的合成图a~c. 4—6月的海表温度和近地表风; d~f. 4—6月的降水; g~i. 4—6月的对流层厚度。黑点填充的区域表示该合成的异常值通过置信水平为90%的显著性检验。该图基于自然资源部标准地图服务网站下载的审图号为GS(2016)1665号标准地图制作, 底图无修改 Fig. 6 Composite results of SST, surface wind, precipitation, and tropospheric thickness anomalies when anomalous April—June SST warming occurred in the southwest tropical Indian Ocean in the CESM control experiment |
图7 CESM热带西南印度洋异常增暖的敏感性实验与控制实验的差值a~c. 4—6月的海表温度和近地表风; d~f. 4—6月的降水; g~i. 4—6月的对流层厚度。黑点填充的区域表示该差值通过置信水平为80%的显著性检验。该图基于自然资源部标准地图服务网站下载的审图号为GS(2016)1665号标准地图制作, 底图无修改 Fig. 7 The difference between the CESM southwest tropical Indian Ocean warming sensitivity experiment and the controlling experiment. Stippling denotes the difference passing the two-tailed Student’s t-test with an 80% significance level |
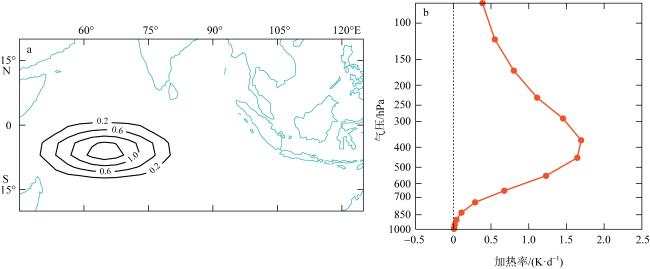
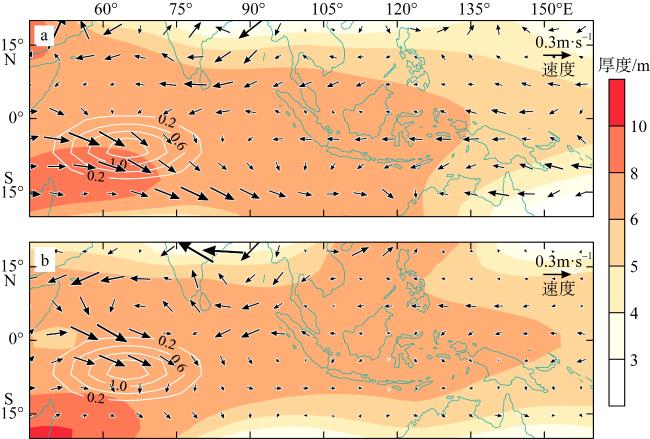
图8 LBM模式中4月(a)和5月(b)低层925hPa水平风场和对流层厚度对热带西南印度洋热源的响应图中等值线为大气加热率。该图基于自然资源部标准地图服务网站下载的审图号为GS(2016)1665号标准地图制作, 底图无修改 Fig. 8 Response of 925-hPa horizontal winds and tropospheric thickness to the heat source in the southwest tropical Indian Ocean in the LBM model for April (a) and May (b) |
| [1] |
|
| [2] |
|
| [3] |
|
| [4] |
|
| [5] |
|
| [6] |
|
| [7] |
|
| [8] |
|
| [9] |
|
| [10] |
|
| [11] |
|
| [12] |
|
| [13] |
|
| [14] |
|
| [15] |
|
| [16] |
|
| [17] |
|
| [18] |
|
| [19] |
|
| [20] |
|
| [21] |
|
| [22] |
|
| [23] |
|
| [24] |
|
| [25] |
|
| [26] |
|
| [27] |
|
| [28] |
|
/
| 〈 |
|
〉 |
