
Journal of Tropical Oceanography >
Ocean stratification in the Indonesian-Australian basin and its influencing factors
Copy editor: SUN Cuici
Received date: 2023-07-12
Revised date: 2023-08-15
Online published: 2023-10-10
Supported by
Special Project on Strategic Pioneering Science and Technology of Chinese Academy of Sciences(XDB42010000)
National Natural Science Foundation of China(42276023)
Coupled Initialization of Earth System Model of Chinese Academy of Sciences(ZDBS-LY-DQC010)
Based on ocean reanalysis system version 5 (ORAS5) and ECMWF reanalysis v5 (ERA5) data, the strength of oceanic stratification and its influencing factors in the Indonesian-Australian basin and its surrounding waters are revealed by using the buoyancy frequency of mixed layer bottom to characterize the oceanic stratification intensity. The results show that the oceanic stratification in this basin is stronger in the north and weaker in the south spatially, while stronger in the boreal spring and weaker in autumn temporally. The analysis of the factors influencing the changes of mixed layer temperature and mixed layer salinity in the basin highlights the significant contributions of surface flux and ocean advection. Particularly, zonal advection associated with the Indonesian Throughflow plays a crucial role in pycnocline stratification by affecting the density structure of the subsurface. Further analysis of the influence of the Indonesian Throughflow on the oceanic stratification in the basin indicates close relationships between the throughflow and thermohaline anomalies above and below the mixed layer interface of the basin; the salinity anomalies affect the seasonal variations in the oceanic stratification by influencing the vertical density gradient.
LIN Guihuan , YAN Youfang , LIU Ying . Ocean stratification in the Indonesian-Australian basin and its influencing factors[J]. Journal of Tropical Oceanography, 2024 , 43(4) : 57 -67 . DOI: 10.11978/2023096
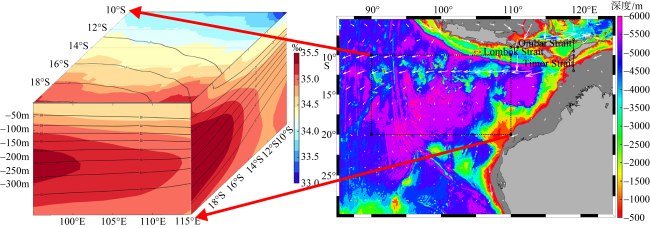
图1 东南印度洋的印度尼西亚—澳大利亚海盆位置(右图黑线框)、 海盆内温度(左图等值线)和盐度(左图填色)分布, 以及印尼贯穿流三个主要的流出海峡(龙目海峡、翁拜海峡和帝汶海峡)的位置(右图黑色实线)和水体流出的路径(矢量箭头)该图基于国家测绘地理信息局标准地图服务网站下载的审图号为GS(2021)5443号的标准地图制作 Fig. 1 Location of the Indonesian-Australian Basin in the southeast Indian Ocean (black box on the right panel), distribution of temperature (contours on the left panel) and salinity (filled color on the left panel) within the basin, and location of the three main outflow straits (Lombok Strait, Ombai Strait, and Timor Strait) of the Indonesia Throughflow (ITF) (solid black line on the right panel), and paths of outflow of the water (vector arrows) |
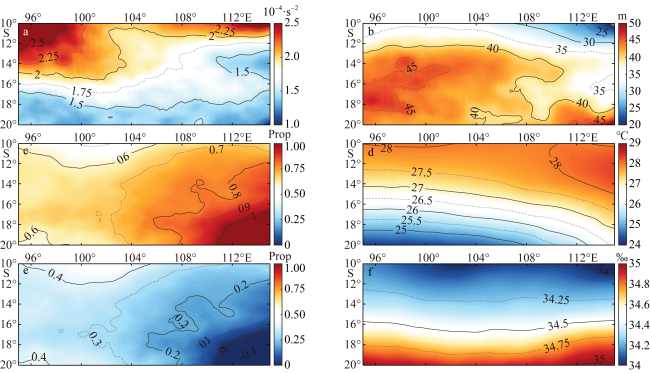
图2 左侧是气候态下海盆内密度跃层底的浮力频率(a)、及其温度(c)和盐度(e)分量的贡献比例; 右侧是气候态下IAB混合层深度(b)、混合层温度(d)和混合层盐度(f)Fig. 2 The left panel shows the buoyancy frequency (a), and the proportion (Prop) of the contribution of its temperature (c) and salinity (e) components at the bottom of pycnocline in the climatology; the right panel shows the IAB mixed layer depth (b), mixed layer temperature (d) and mixed layer salinity (f) in the climatology |
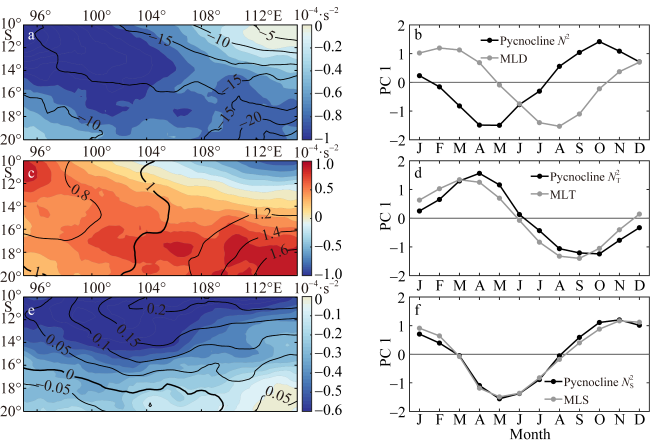
图3 左侧图是密度跃层底的浮力频率(a, 填色)、及其温度层结分量(c, 填色)和盐度层结分量(e, 填色)的季节气候态, 以及混合层深度(a, 等值线)、及混合层温度(c, 等值线)和混合层盐度(e, 等值线)的季节气候态, 通过EOF分析得到的季节变化空间模态; 右侧图是相关变量的第一主要时间模态(b, 浮力频率; d, 温度; f, 盐度), 解释方差分别为: (84%), (78%), (82%), MLD (89%), MLT (95%), MLS (58%)Fig. 3 The left panel shows the seasonal climate state of the buoyancy frequency (a, filled color), and its temperature component (c, filled color) and salinity component (e, filled color) at the bottom of the pycnocline, as well as the seasonal climatology of the mixed layer depth (a, contours), and mixed layer temperature (c, contours) and mixed layer salinity (e, contours), spatial modes of seasonal variation obtained by EOF analysis; the right panel shows the first principal temporal component of the variables of interest, with the explained variance, respectively: (84%), (78%), (82%), MLD(89%), MLT(95%), MLS(58%) |
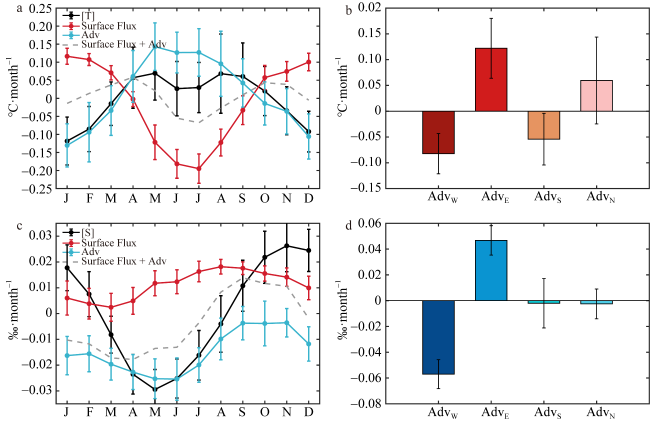
图4 海盆区域300米深度内体积平均得到的温度和盐度变化(黑色线), 以及影响IAB海盆内温度(a)和盐度(c)的海表通量(红色线)和平流过程(蓝色线), 灰色虚线是两项之和。(b)、(d)分别是温度和盐度的在四个边界上的平流贡献, 误差条为各分量的季节标准差Fig. 4 Variation in temperature and salinity obtained by volume averaging over the basin area at 300 m depth (black line), and sea surface fluxes (red line) and advective processes (blue line) affecting temperature (a) and salinity (b) within the basin, with the gray dashed line being the sum of the two; (b) and (d) are the advective contributions of temperature and salinity at the four boundaries, respectively, and the error bars are the seasonal standard deviations of each component |
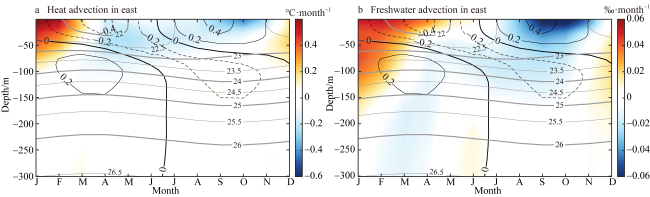
图5 在海盆东边界的由于平流引起的温度异常(a)和盐度异常(b)(填色部分)的季节变化灰色实线是海盆内平均的垂向位势密度廓线的季节变化, 黑色实线代表海盆内正的位势密度异常, 黑色虚线代表海盆内负的位势密度异常 Fig. 5 Seasonal variation of advection—induced temperature anomalies (a) and salinity anomalies (b) at the eastern boundary of the basin (filled part). The solid gray line is the seasonal variation of the mean vertical potential density profile in the basin, and the solid black line represents positive potential density anomalies in the basin and the dashed black line represents negative potential density anomalies in the basin |
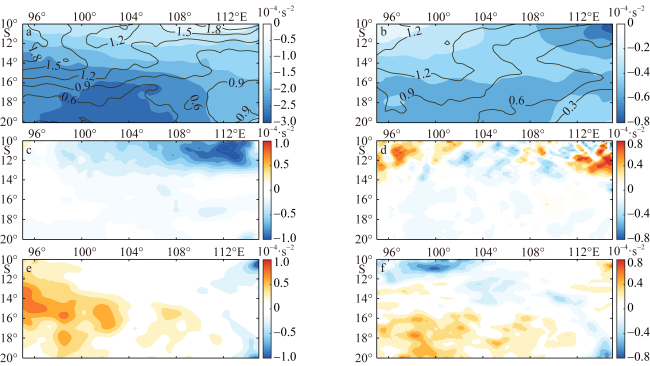
图6 在北半球夏季, 由于海表通量引起的混合层温度异常导致的层结异常(a, 填色)和混合层盐度异常导致的层结异常(b, 填色), 以及气候态下温度层结(a, 等值线)和盐度层结(b, 等值线)分布。同理c、d分别是由于纬向平流引起的混合层温盐异常导致的层结异常, e、f则分别是经向平流引起的混合层温盐异常导致的层结异常Fig. 6 In the climatological boreal summer, the distribution of buoyancy frequency anomalies due to mixed layer temperature anomalies (a, filled color) and mixed layer salinity anomalies (b, filled color) induced by sea surface fluxes, and the distribution of temperature buoyancy frequency (a, contours) and salinity buoyancy frequency (b, contours) in climatology. Similarly, (c) and (d) are the temperature and salinity anomalies induced by zonal advection respectively, while (e) and (f) are buoyancy frequency anomalies induced by meridional advection, respectively |
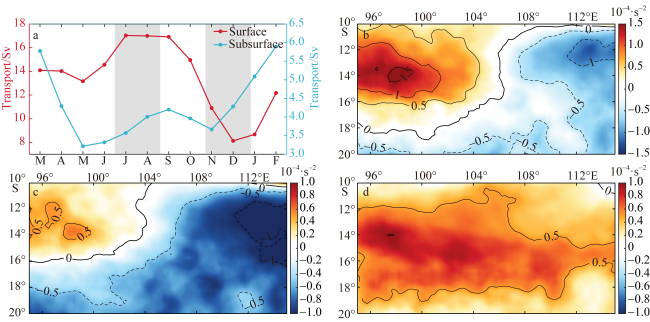
图7 印尼贯穿流在三个主要的出口海峡通量季节变化(a); (b)是通过表层强输运通量时期减去弱输运通量时期[a图中两个阴影部分的红线: JAS (7、8、9月)和NDJ(11、12、1月)]的密度跃层底的浮力频率, 得到的与印尼贯穿流变化相关的浮力频率异常; 由于跃层底温度垂向梯度引起的浮力频率分量(c)和盐度垂向梯度引起的浮力频率分量(d)的空间分布Fig. 7 The seasonal variation of the transport of the Indonesian Throughflow in the three main straits (a), (b) is the buoyancy frequency anomaly obtained by the buoyancy frequency from the period of the strong surface transport (red lines in the two shaded parts of the a figure: JAS—NDJ) at the bottom of pycnocline, and the horizontal distribution of the buoyancy frequency component due to the vertical gradient of temperature (c) and salinity(d), which are associated with the variation of the transport of Indonesian Throughflow (d) |
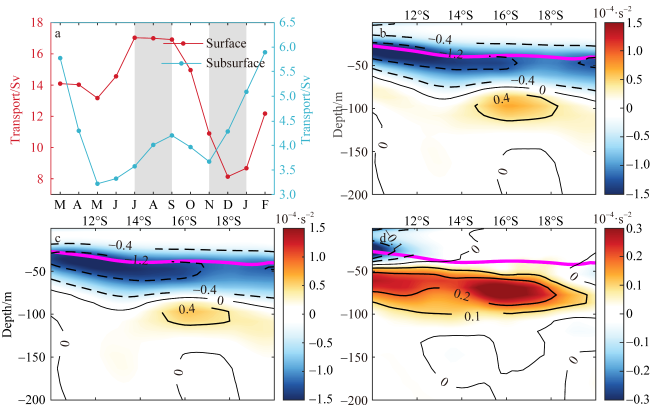
图8 印尼贯穿流在三个主要的出口海峡通量的季节变化(a); 在表层强输运通时期减去弱输运通量时期[a图中两个阴影部分的红线: JAS (7、8、9月)和NDJ(11、12、1月)]的浮力频率异常的纬向平均剖面(b); 由于温度垂向梯度引起的浮力频率分量(c)和盐度垂向梯度引起的浮力频率分量(d)的纬向平均剖面Fig. 8 The seasonal variation of the transport of the Indonesian Throughflow in the three main straits (a), (b) is the buoyancy frequency anomaly zonal profile obtained by the buoyancy frequency from the period of the strong surface transport(red lines in the two shaded parts of the a figure: JAS—NDJ) at the bottom of the mixed layer, and the vertical distribution of the buoyancy frequency component due to the vertical gradient of temperature (c) and salinity (d), which are associated with the variation of the transport of Indonesian Throughflow (d) |
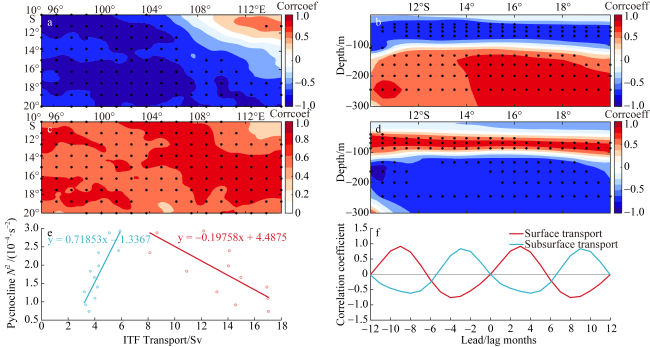
图9 气候态下, 印尼贯穿流海峡出流的通量在超前3个月与IAB跃层底的浮力频率的相关系数(correlation coefficient, Corrcoeff)的水平(a、c)和垂向(b、d)分布(a、b, 表层; c、d, 次表层); 以及将IAB区域平均的密度跃层底浮力频率与海峡通量的超前滞后相关系数变化(f), 和将海峡出流的表层(红色)与次表层通量(蓝色)回归到密度跃层底的浮力频率的线性系数(e), 圆点标记代表超过95%置信度的相关系数的海域Fig. 9 In the climatology, the horizontal (a, c) and vertical (b, d) distributions of the correlation coefficients between the surface (a, b) and subsurface (c, d) transport of Indonesian Throughflow in the straits (ahead 3 months) and the buoyancy frequency at the bottom of pycnocline in the IAB; as well as lead\lag correlation coefficient between the buoyancy frequency averaged over the IAB and the transport of Indonesian Throughflow (f), and the linear coefficients (e) that regress the surface (red) and subsurface transport (blue) of the straits transport to the buoyancy frequency at bottom of pycnocline. Marks represent the sea area of correlation coefficients above the 95% confidence level |
| [1] |
|
| [2] |
|
| [3] |
|
| [4] |
|
| [5] |
|
| [6] |
|
| [7] |
|
| [8] |
|
| [9] |
|
| [10] |
|
| [11] |
|
| [12] |
|
| [13] |
|
| [14] |
|
| [15] |
|
| [16] |
|
| [17] |
|
| [18] |
|
| [19] |
|
| [20] |
|
| [21] |
|
| [22] |
|
| [23] |
|
| [24] |
|
| [25] |
|
| [26] |
|
| [27] |
|
| [28] |
|
| [29] |
|
| [30] |
|
| [31] |
|
| [32] |
|
| [33] |
|
| [34] |
|
| [35] |
|
| [36] |
|
| [37] |
|
| [38] |
|
| [39] |
|
| [40] |
|
| [41] |
|
| [42] |
|
| [43] |
|
| [44] |
|
| [45] |
|
| [46] |
|
/
| 〈 |
|
〉 |
