
Journal of Tropical Oceanography >
Interannual variation of subsurface chlorophyll maximum in the northern South China Sea
Copy editor: LIN Qiang
Received date: 2020-12-24
Revised date: 2021-03-09
Online published: 2021-03-15
Supported by
National Natural Science Foundation(U1906215)
Copyright
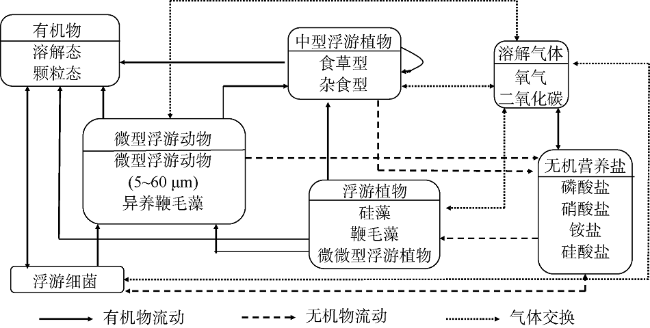
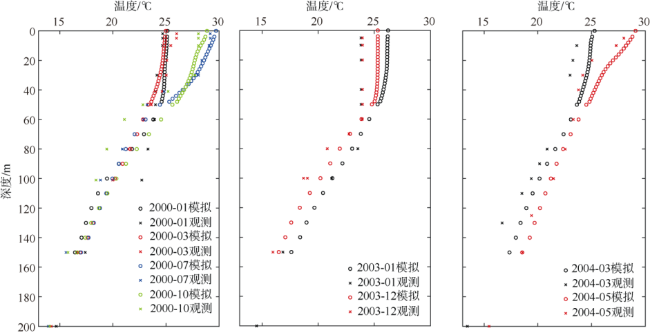
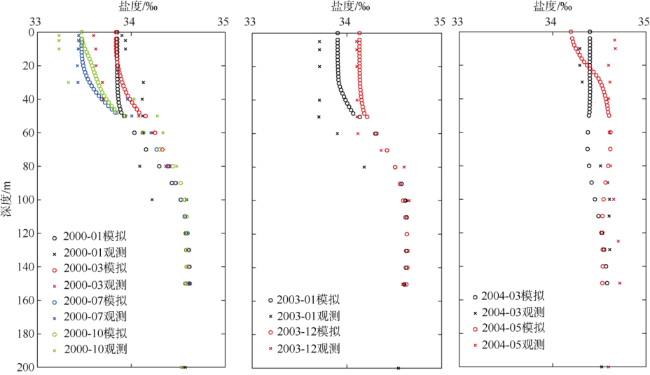
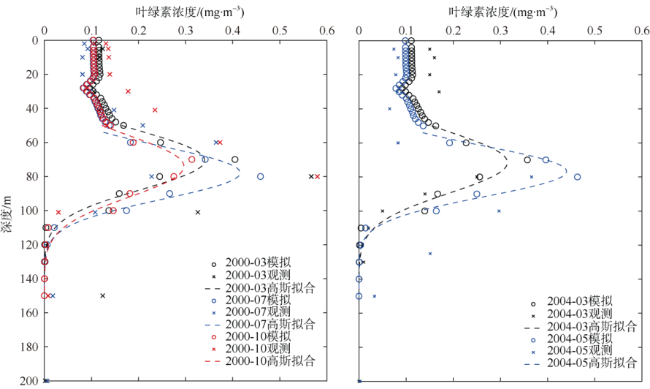
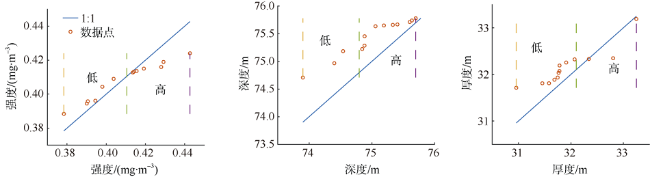
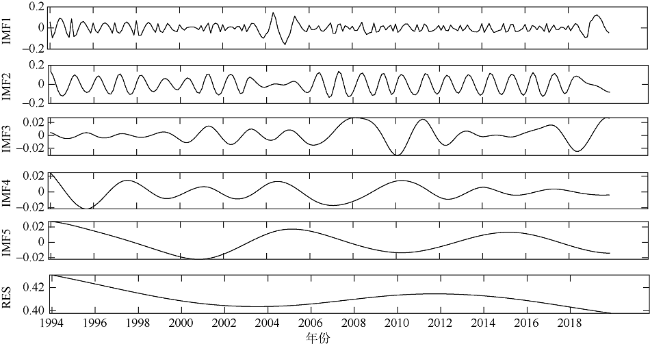
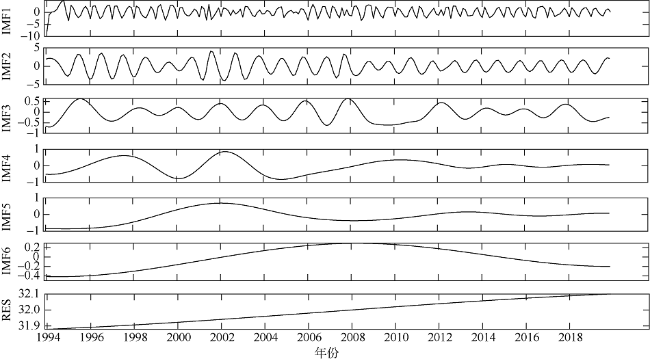
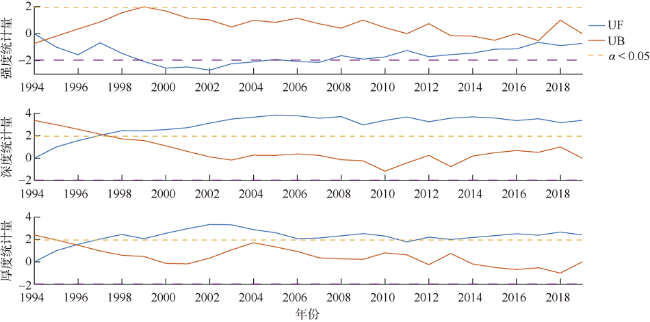
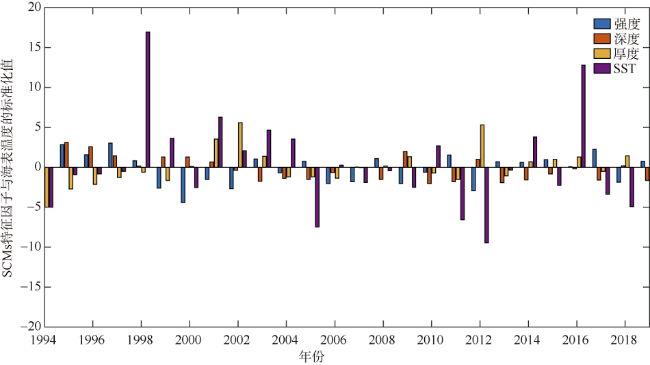
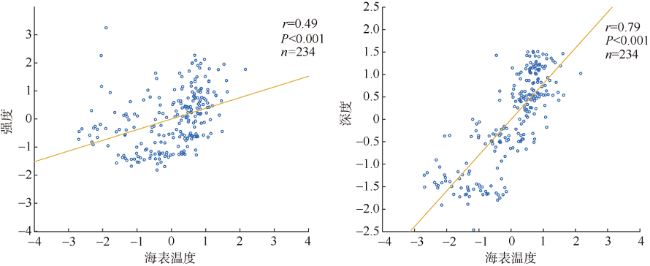
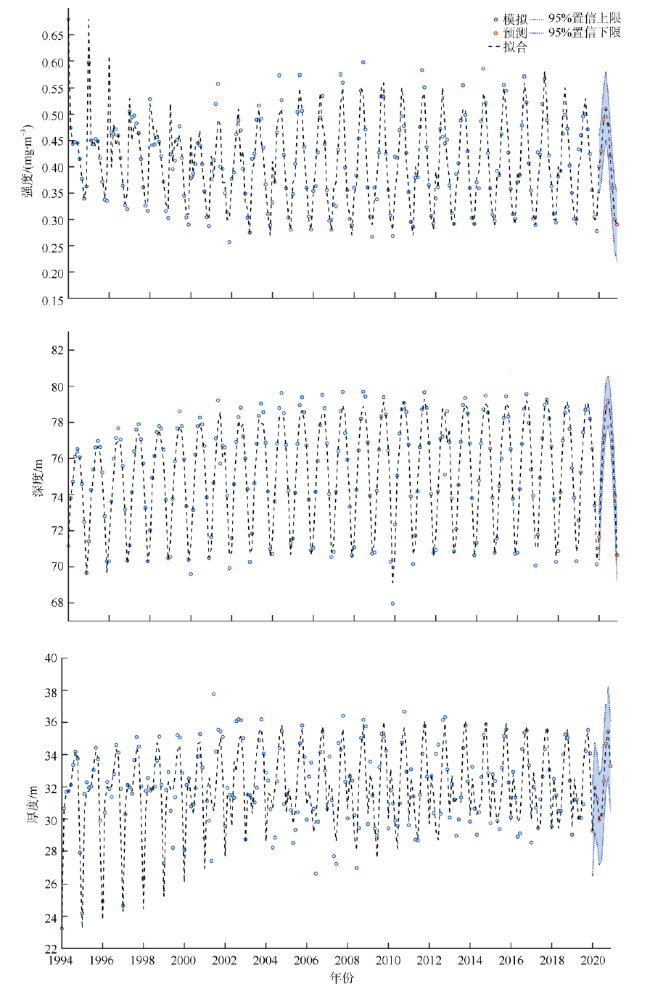
Subsurface chlorophyll maxima (SCMs) are widely found in the global oceans. The layer of SCM accounts for a great proportion of marine primary productivity and new productivity. Studying the interannual variation of SCMs can deepen our understanding of marine ecosystems under climatic change. In this study, a one-dimensional physical-biological coupled model (MEM-1D) was used to simulate the vertical distribution of ocean temperature, salinity, nutrients, and chlorophyll in the northern South China Sea from 1994 to 2019. Based on numerical modeling results, we analyzed the interannual variations of SCM characteristics (intensity, depth and thickness) using three statistical methods from different aspects, i.e., overall trend, different time scales and significant changes. In general, the intensity of SCMs from 1994 to 2019 shows a slightly decreasing trend (the trend slope S<0). Specifically, the SCM intensity decreased from 1994 to 2004 ( decreased significantly from 1999 to 2004), while it increased from 2005 to 2012 and then decreased until 2019. The depth of SCMs showed a deepening tendency between 1994 and 2019 (the trend slope S>0), gradually becoming deeper from 1994 to 2011, and then shoaling; but the changing trend was not significant. The thickness of SCMs increased as a whole, and it had increased significantly since 1999. Correlation analysis showed no relationship between annually averaged sea-surface temperature (SST) and the characteristics of SCMs (P>0.05). The influence of SST on SCMs was mainly on the seasonal scale, and the depth and intensity of SCMs changed consistently with SST. The seasonal, autoregressively integrated moving average model has a good fit for the three characteristics of SCMs, with the mean absolute percentage errors of 5.33% for intensity, 0.62% for depth and 2.49% for thickness, indicating that the model can be used to predict the trend of SCM characteristics.
WANG Renzheng , SHAN Zhengduo , MENG Siyu , GONG Xiang . Interannual variation of subsurface chlorophyll maximum in the northern South China Sea[J]. Journal of Tropical Oceanography, 2021 , 40(6) : 63 -75 . DOI: 10.11978/2020151
表1 ERSEM模型基本参数的取值Tab. 1 Values of basic parameters of ERSEM model |
| 参数 | 单位 | 取值 | 参考文献 |
|---|---|---|---|
| 光透射系数k | m-1 | 0.05 | Chen et al, 2004; Chen, 2005 |
| 温度系数Q10 | d-1 | 2.0 | Vichi et al, 2007 |
| Von Karman常数 | – | 0.4 | Vichi et al, 2007 |
| 科氏参数 | – | 5.592×10⁻⁵ | – |
| Redfield N:C | Mmol N·mg-1 C-1 | 0.0126 | Vichi et al, 2007 |
| Redfield P:C | mmol P·mg- C-1 | 0.768×10⁻³ | Vichi et al, 2007 |
注: “—”表示无单位或参考文献, |
表2 浮游植物参数的取值Tab. 2 Values of phytoplankton parameters |
| 参数 | 单位 | 取值 | |||
|---|---|---|---|---|---|
| 硅藻 | 鞭毛藻 | 微微型浮游植物 | 参考文献 | ||
| 最大生长率(10℃) | d-1 | 2.1 | 2.1 | 2.1 | Liu et al, 2002; Liu et al, 2007 |
| 呼吸率(10℃) | d-1 | 0.15 | 0.1 | 0.1 | Allen et al, 1998 |
| 排泄率 | – | 0.05 | 0.2 | 0.2 | Vichi et al, 2007 |
| 最小N:C | mmol N·mg-1 C-1 | 0.00687 | 0.00687 | 0.00687 | Vichi et al, 2007 |
| 最大N:C | mmol N·mg-1 C-1 | 0.0252 | 0.0252 | 0.0252 | Vichi et al, 2007 |
| 最小P:C | mmol P·mg-1 C-1 | 0.428×10⁻³ | 0.428×10⁻³ | 0.428×10⁻³ | Vichi et al, 2007 |
| 最大P:C | mmol P·mg-1 C-1 | 0.157×10⁻² | 0.157×10⁻² | 0.157×10⁻² | Vichi et al, 2007 |
| 对NO3的吸收速率 | mg-1 C-1·d-1 | 0.0025 | 0.0025 | 0.0025 | Vichi et al, 2007 |
| 对NH4的吸收速率 | mg-1 C-1·d-1 | 0.0025 | 0.01 | 0.02 | Vichi et al, 2007 |
| 对PO4的吸收速率 | mg-1 C-1·d-1 | 0.0025 | 0.0025 | 0.0025 | Vichi et al, 2007 |
| 沉降速率 | m·d-1 | 1.0 | 0.5 | 0.1 | Lu et al, 2010 |
| 最小溶解率 | d-1 | 0.05 | 0.05 | 0.05 | Vichi et al, 2007 |
| Si摄入常数 | mmol Si·m-3 | 0.3 | – | – | Vichi et al, 2007 |
| 标准Si:C | mmol Si·mg-1 C-1 | 0.03 | – | – | Vichi et al, 2007 |
| 叶绿素a的转换因子 | mg C·mg-1 Chl-a-1 | 25.0 | 50.0 | 50.0 | Vichi et al, 2007 |
表3 浮游动物参数的取值Tab. 3 Values of zooplankton parameters |
| 参数 | 单位 | 取值 | 参考文献 | ||
|---|---|---|---|---|---|
| 异养鞭毛藻 | 微型浮游动物 | 中型浮游动物 | |||
| 最大生长率(10℃) | d-1 | 1.0 | 0.5 | 1.0 | Liu et al, 2007; Vichi et al, 2007 |
| 同化作用效率 | – | 0.4 | 0.5 | 0.5 | Vichi et al, 2007 |
| 呼吸率(10℃) | d-1 | 0.02 | 0.02 | 0.02 | Vichi et al, 2007 |
| 排泄率 | – | 0.5 | 0.5 | 0.5 | Vichi et al, 2007 |
| 死亡率 | d-1 | 0.25 | 0.25 | 0.2 | Vichi et al, 2007 |
| 最大N:C | mmol N·mg-1 C-1 | 0.0167 | 0.0167 | – | Vichi et al, 2007 |
| 最大P:C | mmol P·mg-1 C-1 | 0.001 | 0.001 | – | Vichi et al, 2007 |
表4 细菌和碎屑参数的取值Tab. 4 Values of bacteria and debris parameters |
| 参数 | 单位 | 取值 | 参考文献 |
|---|---|---|---|
| 细菌最大生长率 | d-1 | 8.38 | Vichi et al, 2007 |
| 细菌呼吸率(10℃) | d-1 | 0.02 | Vichi et al, 2007 |
| 细菌磷元素摄入的m氏常数 | mmol P·m-3 | 0.05 | Vichi et al, 2007 |
| 细菌氮元素摄入的m氏常数 | mmol N·m-3 | 0.5 | Vichi et al, 2007 |
| 细菌氧限制的半饱和值 | – | 0.31 | Vichi et al, 2007 |
| 细菌死亡率 | d-1 | 0.05 | Vichi et al, 2007 |
| 碎屑分解率 | d-1 | 0.01 | Vichi et al, 2007 |
| 碎屑相对硝化率 | d-1 | 0.05 | Vichi et al, 2007 |
| 碎屑C:N(Redfield) | – | 6.62 | Vichi et al, 2007 |
图6 SCMs强度变化的经验模态分解Fig. 6 Variation of SCM intensity by empirical mode decomposition |
表5 SST与SCMs特征因子的相关性Tab. 5 Correlations between SST and SCM characteristics |
| 季节 | SCMs特征因子 | 与SST相关性参数 | |
|---|---|---|---|
| P | r | ||
| 春季 | 强度 | < 0.001 | 0.51* |
| 深度 | < 0.001 | 0.86* | |
| 厚度 | – | – | |
| 夏季 | 强度 | 0.06 | – |
| 深度 | 0.02 | 0.26* | |
| 厚度 | – | – | |
| 秋季 | 强度 | < 0.001 | 0.69* |
| 深度 | < 0.001 | 0.81* | |
| 厚度 | – | – | |
注: *表示显著相关, –表示不相关, |
表6 深层海温与SCMs特征因子的相关性Tab. 6 Correlations between deep-sea temperature and SCM characteristics |
| 位置 | SCMs特征因子 | 与海温相关性参数 | |
|---|---|---|---|
| P | r | ||
| 上边界处 | 强度 | 0.01 | -0.17* |
| 深度 | 0.02 | 0.16* | |
| 厚度 | 0.002 | 0.20* | |
| 深度处 | 强度 | 0.07 | – |
| 深度 | 0.24 | – | |
| 厚度 | 0.50 | – | |
| 下边界处 | 强度 | 0.30 | – |
| 深度 | 0.35 | – | |
| 厚度 | 0.44 | – | |
| [1] |
陈国鼎, 荆海晓, 李小宝, 等, 2018. 基于经验模态分解与传统水文分析法的降雨序列研究[J]. 水利水电技术, 49(11):8-14.
|
| [2] |
姜浩, 赵中阔, 樊伟, 等, 2018. 基于经验模态分解和小波分解估算海气通量涡相关计算中的截断时间尺度[J]. 海洋与湖沼, 49(6):1138-1150.
|
| [3] |
柯志新, 黄良民, 谭烨辉, 等, 2013. 2008年夏末南海北部叶绿素a的空间分布特征及其影响因素[J]. 热带海洋学报, 32(4):51-57.
|
| [4] |
乐凤凤, 宁修仁, 2006. 南海北部浮游植物生物量的研究特点及影响因素[J]. 海洋学研究, 24(2):60-69.
|
| [5] |
夏洁, 高会旺, 2006. 南黄海东部海域浮游生态系统要素季节变化的模拟研究[J]. 安全与环境学报, 6(4):59-65.
|
| [6] |
张冲, 史洁, 高会旺, 等, 2011. 南海北部浮游生态系统要素季节变化的模拟研究[J]. 中国海洋大学学报, 41(3):11-18.
|
| [7] |
张钒, 阮五崎, 黄邦钦, 2000. 台湾海峡南部叶绿素A最大值的研究[J]. 厦门大学学报(自然科学版), 39(5):664-668.
|
| [8] |
|
| [9] |
|
| [10] |
|
| [11] |
|
| [12] |
|
| [13] |
|
| [14] |
|
| [15] |
|
| [16] |
|
| [17] |
|
| [18] |
|
| [19] |
|
| [20] |
|
| [21] |
|
| [22] |
|
| [23] |
|
| [24] |
|
| [25] |
|
| [26] |
|
| [27] |
|
| [28] |
|
| [29] |
|
| [30] |
|
| [31] |
|
| [32] |
|
| [33] |
|
| [34] |
|
| [35] |
|
| [36] |
|
| [37] |
|
| [38] |
|
/
| 〈 |
|
〉 |

