
Journal of Tropical Oceanography >
Retrieval of typhoon precipitation rate over ocean surface based on FY-3D/MWRI Data*
Received date: 2023-10-17
Revised date: 2024-01-12
Online published: 2024-01-15
Supported by
National Natural Science Foundation of China(U2242212)
Using the first level brightness temperature data of the microwave radiation imager (MWRI) carried on the FY-3D (Fengyun-3D) satellite, combined with the second level (L2) precipitation orbit product, and based on the polarization corrected temperature and scattering index (PCT-SI) comprehensive method, two precipitation rate inversion models for the ascending and descending orbit ocean surfaces were established, the two models established in this study were also validated by multiple typhoon cases. The results show that there is little difference in the effectiveness of inversion of precipitation between the ascending orbit data and the descending orbit data, and the precipitation distribution area retrieved is slightly larger than that of the L2 product precipitation area; both models tend to overestimate the low value of precipitation and underestimate the high value of precipitation; the correlation coefficient, mean absolute error, and root mean square error of the ascending orbit inversion model are 0.72632, 2.3055 mm·h-1 and 2.7254 mm·h-1, respectively. The correlation coefficient, average absolute error, and root mean square error of the descending orbit inversion model are 0.73363, 1.9079 mm·h-1 and 2.3651 mm·h-1, respectively. This study has successfully inverted the distribution area of ocean surface precipitation and near surface precipitation rate, providing a reference for estimating the distribution of ocean surface typhoon precipitation and precipitation rate inversion using satellite borne microwave imaging data.
Key words: FY-3D/MWRI; typhoon; ocean surface; rain rate; inversion
SHANG Jie , WU Ying , ZOU Yike , MA Jingwen . Retrieval of typhoon precipitation rate over ocean surface based on FY-3D/MWRI Data*[J]. Journal of Tropical Oceanography, 2024 , 43(5) : 32 -40 . DOI: 10.11978/2023153
表1 基于两组(升/降轨)一级亮温数据分别对89.0GHz垂直极化亮温进行多元线性拟合得到的回归系数Tab. 1 Regression coefficients obtained by multivariate linear fitting of 89.0 GHz vertically polarized brightness temperature based on two sets (ascending/descending orbit) of L1 brightness temperature data |
| 数据类型 | ${{a}_{0}}$ | ${{a}_{1}}$ | ${{a}_{2}}$ | ${{a}_{3}}$ |
|---|---|---|---|---|
| 升轨洋面 | 244.1540 | 0.1674 | -1.2956 | 1.0746 |
| 降轨洋面 | 258.6989 | -0.0507 | -1.0842 | 0.9876 |
表2 基于两组(升/降轨)一级亮温数据和二级产品降雨率数据分别对降雨率进行多元线性拟合得到的回归系数Tab. 2 Regression coefficients obtained by multivariate linear fitting of rainfall intensity based on two sets (ascending/descending orbit) of L1 brightness temperature data and L2 product precipitation rate data, respectively |
| 数据类型 | ${{b}_{0}}$ | ${{b}_{1}}$ | ${{b}_{2}}$ |
|---|---|---|---|
| 升轨洋面 | 76.2498 | -0.2809 | -0.2040 |
| 降轨洋面 | 67.6256 | -0.2488 | -0.1592 |
表3 模型的显著性水平检验结果Tab. 3 The significance level test results of the two models |
| 轨道类型 | 判定系数(R2) | F统计量观测值 | 检验的p的值 | 误差方差估计 |
|---|---|---|---|---|
| 升轨 | 0.5275 | 131790 | 0 | 7.4280 |
| 降轨 | 0.5382 | 136910 | 0 | 5.5935 |
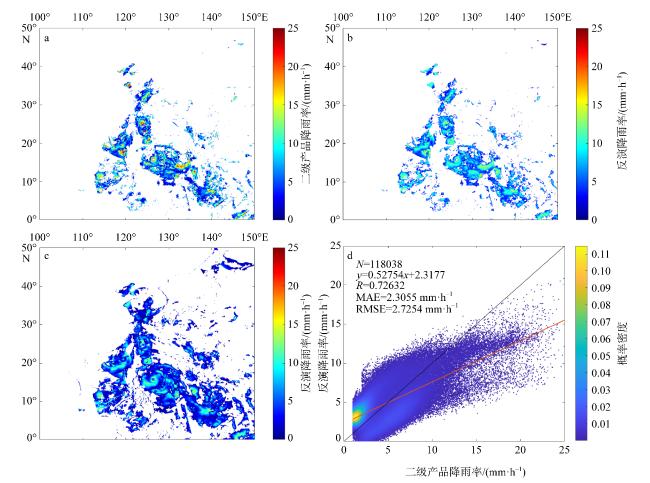
图 1 台风“梅花”和“杜苏芮”的升轨洋面a. 二级产品降雨率分布图; b. 反演降雨率分布图; c. 反演降雨率分布区域图; d. 二级产品降雨率与反演降雨率概率密度散点图。图d中的红色实线表示二级产品降雨率与反演降雨率的拟合直线 Fig. 1 Ocean surface of ascending orbits (Typhoon Muifa and Doksuri). (a) Distribution map of precipitation rate of L2 products; (b) inversion of precipitation rate distribution map; (c) inversion of regional map of precipitation rate distribution; (d) the probability density scatter-plot of the L2 product precipitation rate and the inversion precipitation rate |
表4 台风个例的二级产品降雨率与反演降雨率之间的R、MAE、RMSE (升轨)Tab. 4 R, RMSE and MAE between L2 product precipitation rate and inverted precipitation rate of the typhoon cases (ascending orbits) |
| 数据类型 | 台风个例 | 数据个数 | R | MAE/(mm·h-1) | RMSE/(mm·h-1) |
|---|---|---|---|---|---|
| 升轨洋面 | 梅花+杜苏芮 | 118038 | 0.72632 | 2.3055 | 2.7254 |
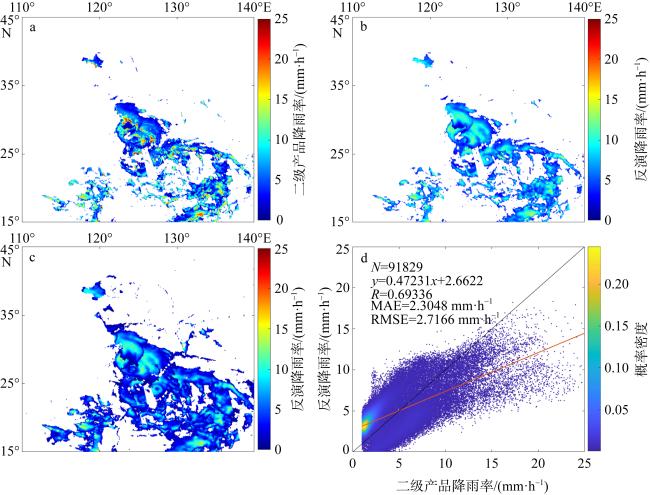
| 烟花 | 91829 | 0.69336 | 2.3048 | 2.7166 | |
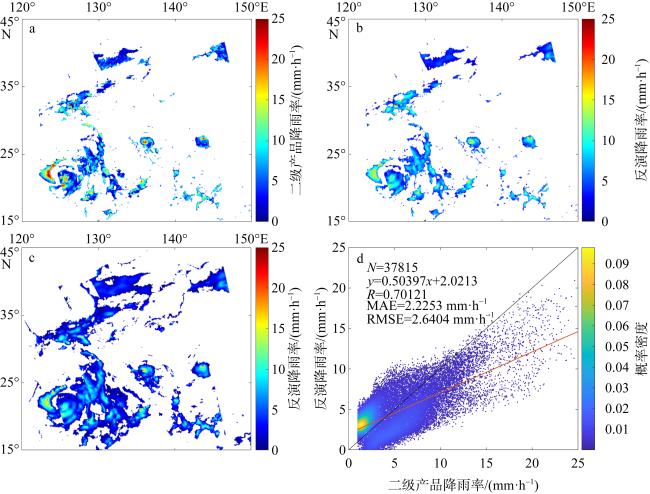
| 轩岚诺 | 37815 | 0.70121 | 2.2256 | 2.6404 |
注: R为相关系数, MAE为平均绝对误差, RMSE为均方根误差 |
表5 台风个例的二级产品降雨率与反演降雨率之间的R、RMSE、MAE (降轨)Tab. 5 R, RMSE and MAE between L2 product precipitation rate and inverted precipitation rate of the typhoon cases (descending orbits) |
| 数据类型 | 台风个例 | 数据个数 | R | MAE/(mm·h-1) | RMSE/(mm·h-1) |
|---|---|---|---|---|---|
| 降轨洋面 | 梅花+杜苏芮 | 117476 | 0.73363 | 1.9079 | 2.3651 |
| 烟花 | 52153 | 0.68845 | 1.9782 | 2.5495 | |
| 轩岚诺 | 43314 | 0.70847 | 2.0549 | 2.6255 |
注: R为相关系数, MAE为平均绝对误差, RMSE为均方根误差 |
图2 升轨洋面(2021年7月17日—2021年7月31日, 台风“烟花”)a. 二级产品降雨率分布图; b. 反演降雨率分布图; c. 反演降雨率分布区域图; d. 二级产品降雨率与反演降雨率概率密度散点图。图d中的红色实线表示二级产品降雨率与反演降雨率的拟合直线 Fig. 2 Ocean surface of ascending orbits (July 17, 2021 — July 31, 2021, Typhoon In-fa). (a) Distribution map of precipitation rate of L2 products; (b) inversion of precipitation rate distribution map; (c) inversion of regional map of precipitation rate distribution; (d) the probability density scatter-plot of the L2 product precipitation rate and the inversion precipitation rate |
图3 升轨洋面(2022年8月29日—2022年9月3日, 台风“轩岚诺”)a. 二级产品降雨率分布图; b. 反演降雨率分布图; c. 反演降雨率分布区域图; d. 二级产品降雨率与反演降雨率概率密度散点图。图d中的红色实线表示二级产品降雨率与反演降雨率的拟合直线 Fig. 3 Ocean surface of ascending orbits (August 29, 2022 — September 3, 2022, Typhoon Hinnamnor). (a) Distribution map of precipitation rate of L2 products; (b) inversion of precipitation rate distribution map; (c) inversion of regional map of precipitation rate distribution; (d) the probability density scatter-plot of the L2 product precipitation rate and the inversion precipitation rate |
| [1] |
邓欣柔, 吴莹, 2022. 基于GPM探测资料的台风降水水平结构分析[J]. 地球物理学进展, 37(5): 1799-1806.
|
| [2] |
高娜, 赵明利, 马毅, 等, 2023. 台风对珠江口风暴增水的影响分析[J]. 热带海洋学报, 42(1): 32-42.
|
| [3] |
李娜, 张升伟, 何杰颖, 2019. 基于FY-3C MWHTS的台风降水反演算法研究[J]. 遥感技术与应用, 34(5): 1091-1100.
|
| [4] |
李世伟, 赖格英, 盛盈盈, 等, 2015. PCT-SI综合指数法反演陆面雨强[J]. 气象与环境科学, 38(2): 102-107.
|
| [5] |
李万彪, 陈勇, 朱元竞, 等, 2001. 利用热带降雨测量卫星的微波成像仪观测资料反演陆地降水[J]. 气象学报, 59(5): 591-601.
|
| [6] |
李卓, 黎伟标, 张奡褀, 2022. 台风登陆前华南地区降水日变化特征分析[J]. 热带海洋学报, 41(2): 26-37.
|
| [7] |
刘瑜, 吴裕珍, 冯志州, 等, 2017. 多种卫星降水产品对中国极端降雨反演效果评估[J]. 热带地理, 37(3): 417-433.
|
| [8] |
沈菲菲, 闵锦忠, 李泓, 等, 2021. GPM微波成像仪资料同化对台风“麦德姆”路径预报的影响研究[J]. 海洋学报, 43(10): 124-136.
|
| [9] |
束艾青, 许冬梅, 李泓, 等, 2022. FY-3D卫星MWHS-2辐射率资料直接同化对台风“米娜”预报的影响[J]. 热带海洋学报, 41(5): 17-28.
|
| [10] |
唐飞, 陈凤娇, 诸葛小勇, 等, 2021. 利用卫星遥感资料分析台风“烟花”(202106)的影响过程[J]. 大气科学学报, 44(5): 703-716.
|
| [11] |
田城, 黎鑫, 杜洋, 等, 2023. 基于贝叶斯网络和GIS的热带气旋灾害风险评估[J]. 热带海洋学报, 42(5): 17-29.
|
| [12] |
杨虎, 李小青, 游然, 等, 2013. 风云三号微波成像仪定标精度评价及业务产品介绍[J]. 气象科技进展, 3(4): 136-143.
|
| [13] |
杨虎, 商建, 吕利清, 等, 2012. 星载微波辐射计通道分辨率匹配技术及其在FY-3卫星MWRI中的应用[J]. 上海航天, 29(1): 23-28, 51.
|
| [14] |
张软玉, 2019. 基于FY-3B星微波成像仪MWRI观测亮温的热带气旋降水反演研究[D]. 北京: 中国科学院大学(中国科学院国家空间科学中心).
|
| [15] |
张哲然, 胡俊洋, 周凯, 等, 2023. 不同类型台风气象场对深圳近海海域风暴潮模拟的比较研究——以台风“山竹”为例[J]. 热带海洋学报, 42(6): 1-14.
|
| [16] |
朱梅, 何君涛, 方勉, 等, 2018. GPM卫星资料在分析“杜苏芮”台风降水结构中的应用[J]. 干旱气象, 36(6): 997-1002.
|
| [17] |
|
| [18] |
|
| [19] |
|
| [20] |
|
| [21] |
|
| [22] |
|
| [23] |
|
| [24] |
|
/
| 〈 |
|
〉 |
