
Journal of Tropical Oceanography >
The genetic structure and connectivity of eight fish species in the Indo-Pacific Convergence Region
Copy editor: SUN Cuici
Received date: 2024-02-07
Revised date: 2024-03-13
Online published: 2024-03-29
Supported by
National Key Research and Development Program of China(2022YFC3102403)
National Natural Science Foundation of China(42276126)
National Key Research and Development Program of China(2023YFC3108800)
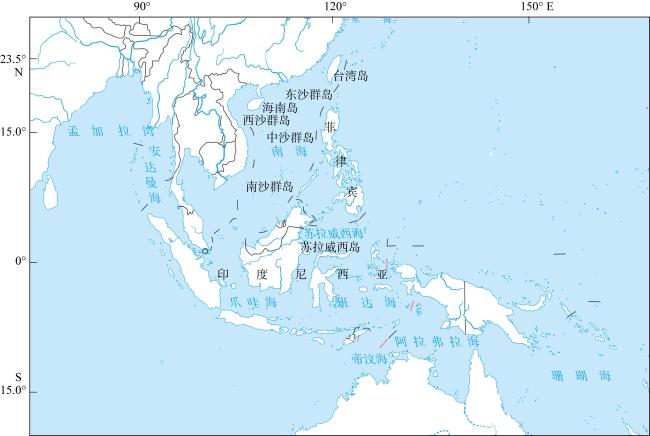
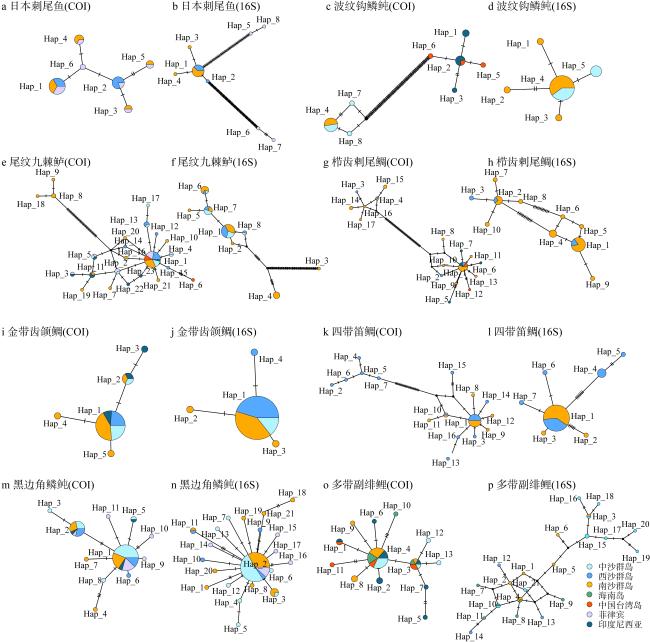
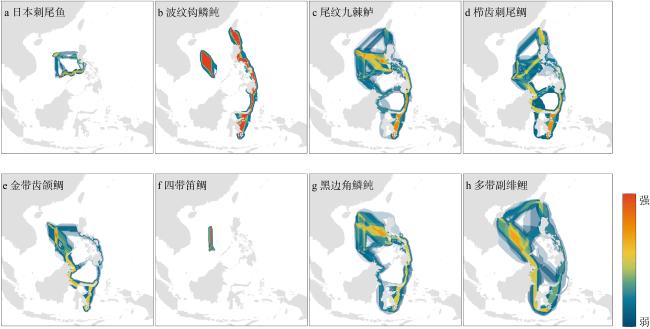
The Indo-Pacific Convergence Region is the center of the origin in marine biodiversity and has extremely high biodiversity. With the dramatic changes in global climate and human activities intensify, ecosystems are gradually fragmenting. In this context, marine fish play important ecological functions in connecting fragmented ecosystems and protecting biodiversity. Exploring the genetic structure and connectivity of typical fish species in the Indo-Pacific Convergence Region will clarify the genetic diversity patterns and diffusion paths among different populations, thereby providing scientific support for the protection of biological diversity. In this study, 8 fish species (Acanthurus japonicus, Balistapus undulatus, Cephalopholis urodeta, Ctenochaetus striatus, Gnathodentex aureolineatus, Lutjanus kasmira, Melichthys vidua and Parupeneus multifasciatus) were collected from 5 representative areas in the Indo-Pacific Convergence Region (Zhongsha Islands, Nansha Islands, Xisha Islands, Hainan Island, and the Philippines), totaling 309 samples, 515 mitochondrial COI genes and 16S sequences were obtained; To broaden the scope of the study, cytochrome C oxidase subunit I (COI ) gene sequences from the Taiwan Island in China and Indonesian were downloaded from GenBank, amounting to 86 sequences. Based on this, we analyzed the genetic diversity and genetic differentiation structure among different groups in the above seven study regions. The overall results show that 8 fish species have high levels of genetic diversity and low genetic differentiation, among which Parupeneus multifasciatus and Balistapus undulatus are the most obvious; Indonesia, Taiwan Island in China and South China Sea Island populations also have high genetic diversity. The study further developed the species distribution models and the least-cost paths model to explore the population connectivity. Based on this, distribution information for the eight fish species (collected from a total of 133, 047 points) was used to predict suitable distribution areas under current climate using the MaxEnt algorithm, and the connectivity between different populations was calculated using the ArcGis 10.2 software SDMtoolbox v2.5. Population connectivity reveals that the east coast of the Philippines-Sulawesi is an important dispersal path for the above eight typical fish species in the Indo-Pacific Convergence Region. The South China Sea Islands (Nansha, Zhongsha and Xisha Islands) connect Taiwan Island in China, the Philippines and Indonesia, and serve as connecting hubs for species spread. In summary, the Philippines, Indonesia, Taiwan Island in China, and the South China Sea should become priority protected areas for maintaining genetic diversity and protecting connectivity. When protecting biodiversity, population connectivity and genetic diversity should be comprehensively considered, and different research results reflected at the macro and micro levels should be combined to achieve more effective biodiversity conservation.
HUANG Hongwei , ZHANG Zhixin , ZHONG Jia , LIN Qiang , GUO Baoying , YAN Xiaojun . The genetic structure and connectivity of eight fish species in the Indo-Pacific Convergence Region[J]. Journal of Tropical Oceanography, 2025 , 44(1) : 9 -23 . DOI: 10.11978/2024043
表1 八种鱼类的样本数量和地理信息Tab. 1 Samples and geographical information of eight fish species |
| 物种 | 自中沙群岛尾数 | 自西沙群岛尾数 | 自南沙群岛尾数 | 自海南岛尾数 | 自菲律宾尾数 |
|---|---|---|---|---|---|
| 日本刺尾鱼 | - | 7 | 10 | - | 6 |
| 波纹钩鳞鲀 | 9 | - | 12 | - | - |
| 尾纹九棘鲈 | 10 | 18 | 23 | - | - |
| 栉齿刺尾鲷 | - | 18 | 20 | - | - |
| 金带齿颌鲷 | 6 | 20 | 17 | - | - |
| 四带笛鲷 | - | 19 | 17 | - | - |
| 黑边角鳞鲀 | 25 | 10 | 22 | - | 10 |
| 多带副绯鲤 | 10 | 7 | 7 | 6 | - |
表2 八种鱼类的地理分布数据(条)Tab. 2 Geographical distribution data of eight fish species |
| 物种 | 下载数据 | 调查数据 | 文献检索数据 | 总数据 | 分析数据 |
|---|---|---|---|---|---|
| 日本刺尾鱼 | 170 | 25 | 4 | 199 | 12 |
| 波纹钩鳞鲀 | 15217 | 46 | 24 | 15287 | 158 |
| 尾纹九棘鲈 | 16650 | 51 | 17 | 16718 | 112 |
| 栉齿刺尾鲷 | 41773 | 52 | 10 | 41835 | 239 |
| 金带齿颌鲷 | 3492 | 62 | 1 | 3555 | 61 |
| 四带笛鲷 | 15315 | 0 | 0 | 15315 | 2027 |
| 黑边角鳞鲀 | 14562 | 62 | 1 | 14625 | 73 |
| 多带副绯鲤 | 25414 | 42 | 57 | 25513 | 238 |
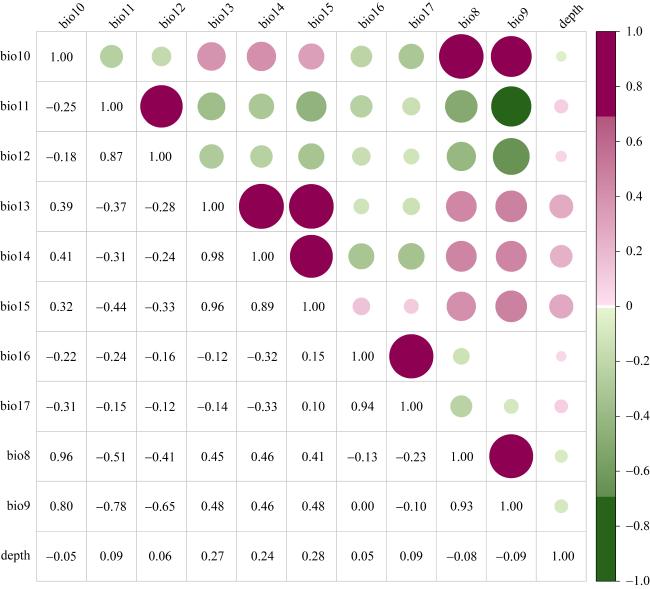
图2 11个海洋环境因子的共线性分析bio8: 海表年平均盐度; bio9: 盐度最小月的海表年平均盐度; bio10: 盐度最大月的海表年平均盐度; bio11: 海表年平均盐度范围; bio12: 海表年平均盐度方差; bio13: 海表年平均温度; bio14: 温度最低月的海表年平均温度; bio15: 温度最高月的海表年平均温度; bio16: 海表年平均温度范围; bio17: 海表年平均温度方差; depth: 深度 Fig. 2 Collinearity analysis of eleven marine layers. bio8: mean annual sea surface salinity; bio9: sea surface salinity of the freshest month; bio10: sea surface salinity of the saltiest month; bio11: annual range in sea surface salinity; bio12: annual variance in sea surface salinity; bio13: mean annual sea surface temperature; bio14: sea surface temperature of the coldest month; bio15: sea surface temperature of the warmest month; bio16: annual range in sea surface temperature; bio17: annual variance in sea surface temperature; depth: water depth |
表3 八种鱼类COI基因NCBI登录号Tab. 3 NCBI accession numbers of COI genes of eight typical fish species |
| 物种 | 群体 | NCBI 登录号 | 物种 | 群体 | NCBI 登录号 |
|---|---|---|---|---|---|
| 日本刺尾鱼 | 菲律宾 | KY570696.1 | 黑边角鳞鲀 | 印度尼西亚 | GU673788.1 |
| 菲律宾 | FJ582663.1 | 印度尼西亚 | GU673787.1 | ||
| 中国台湾岛 | KU944984.1 | 印度尼西亚 | GU673786.1 | ||
| 波纹钩鳞鲀 | 印度尼西亚 | GU674269.1 | 印度尼西亚 | JN312832.1 | |
| 印度尼西亚 | GU674268.1 | 多带副绯鲤 | 印度尼西亚 | GU673922.1 | |
| 印度尼西亚 | GU673764.1 | 印度尼西亚 | GU673921.1 | ||
| 印度尼西亚 | GU673727.1 | 印度尼西亚 | MN870573.1 | ||
| 印度尼西亚 | GU673724.1 | 印度尼西亚 | MN870495.1 | ||
| 印度尼西亚 | JN312867.1 | 印度尼西亚 | MN870185.1 | ||
| 中国台湾岛 | KU945199.1 | 印度尼西亚 | MN870017.1 | ||
| 中国台湾岛 | KU945198.1 | 印度尼西亚 | MN869966.1 | ||
| 中国台湾岛 | KT718610.1 | 印度尼西亚 | MN869947.1 | ||
| 菲律宾 | FJ582893.1 | 印度尼西亚 | MN869941.1 | ||
| 尾纹九棘鲈 | 印度尼西亚 | MN870605.1 | 印度尼西亚 | JN312859.1 | |
| 印度尼西亚 | MN870316.1 | 南沙群岛 | KY371927.1 | ||
| 印度尼西亚 | MN870305.1 | 南沙群岛 | KY371926.1 | ||
| 印度尼西亚 | MN870241.1 | 南沙群岛 | KY371925.1 | ||
| 印度尼西亚 | MN869950.1 | 中国台湾岛 | KU944153.1 | ||
| 印度尼西亚 | JN313107.1 | 中国台湾岛 | KU944152.1 | ||
| 印度尼西亚 | JN312862.1 | 中国台湾岛 | KU944146.1 | ||
| 菲律宾 | KU064518.1 | 中国台湾岛 | KU944145.1 | ||
| 菲律宾 | KU064517.1 | 中国台湾岛 | KU944144.1 | ||
| 菲律宾 | KU064516.1 | 中国台湾岛 | KU944142.1 | ||
| 菲律宾 | KF009579.1 | 金带齿颌鲷 | 印度尼西亚 | GU674368.1 | |
| 菲律宾 | KF009578.1 | 印度尼西亚 | GU674365.1 | ||
| 菲律宾 | KC970463.1 | 印度尼西亚 | MN870418.1 | ||
| 菲律宾 | FJ583015.1 | 印度尼西亚 | MN869944.1 | ||
| 菲律宾 | FJ583014.1 | 南沙群岛 | KY371565.1 | ||
| 菲律宾 | FJ583013.1 | 南沙群岛 | KY371564.1 | ||
| 菲律宾 | FJ583012.1 | 南沙群岛 | KY371563.1 | ||
| 中国台湾岛 | KU943492.1 | 南沙群岛 | KY371562.1 | ||
| 中国台湾岛 | KU943491.1 | 南沙群岛 | KY371561.1 | ||
| 中国台湾岛 | KU943459.1 | 南沙群岛 | KY371560.1 | ||
| 中国台湾岛 | KU892843.1 | 南沙群岛 | KY371559.1 | ||
| 栉齿刺尾鲷 | 印度尼西亚 | GU673965.1 | 四带笛鲷 | 南沙群岛 | KY371696.1 |
| 印度尼西亚 | MN870174.1 | 南沙群岛 | KY371695.1 | ||
| 印度尼西亚 | MN870008.1 | 南沙群岛 | KY371694.1 | ||
| 印度尼西亚 | GU673967.1 | 南沙群岛 | KY371693.1 | ||
| 印度尼西亚 | JN311616.1 | 南沙群岛 | KY371692.1 | ||
| 中国台湾岛 | KU944980.1 | 南沙群岛 | KY371691.1 | ||
| 中国台湾岛 | KU893059.1 | 南沙群岛 | KY371690.1 | ||
| 中国台湾岛 | KU892976.1 | 南沙群岛 | KY371689.1 |
表4 基于COI基因和16S序列的群体遗传多样性Tab. 4 Population genetic diversity based on COI gene and 16S sequences |
| 物种 | 群体 | 序列数(n) | 变异位点数目(S) | 单倍型数量(h) | 单倍型(基因) 多样性(Hd ) | 核苷酸多样性(π) | 核苷酸差异的平均数(K) | |||||||
|---|---|---|---|---|---|---|---|---|---|---|---|---|---|---|
| COI | 16S | COI | 16S | COI | 16S | COI | 16S | COI | 16S | COI | 16S | |||
| 日本 刺尾鱼 | 西沙群岛 | 7 | 6 | 2 | 1 | 2 | 2 | 0.571 | 0.333 | 0.002 | 0.001 | 1.143 | 0.333 | |
| 南沙群岛 | 7 | 10 | 6 | 2 | 4 | 3 | 0.810 | 0.378 | 0.004 | 0.001 | 2.381 | 0.400 | ||
| 菲律宾 | 8 | 4 | 6 | 112 | 6 | 4 | 0.893 | 1.000 | 0.004 | 0.135 | 2.071 | 74.000 | ||
| 整体 | 22 | 20 | 6 | 135 | 6 | 8 | 0.779 | 0.589 | 0.003 | 0.056 | 1.779 | 30.826 | ||
| 波纹 钩鳞鲀 | 中沙群岛 | 6 | 9 | 3 | 1 | 3 | 2 | 0.600 | 0.500 | 0.002 | 0.001 | 1.000 | 0.500 | |
| 南沙群岛 | 4 | 12 | 0 | 4 | 1 | 4 | 0.000 | 0.455 | 0.000 | 0.001 | 0.000 | 0.667 | ||
| 中国台湾岛 | 3 | - | 2 | - | 3 | - | 1.000 | - | 0.002 | - | 1.333 | - | ||
| 印度尼西亚 | 6 | - | 3 | - | 3 | - | 0.733 | - | 0.002 | - | 1.200 | - | ||
| 整体 | 19 | 21 | 113 | 5 | 8 | 5 | 0.795 | 0.486 | 0.105 | 0.001 | 57.924 | 0.638 | ||
| 尾纹 九棘鲈 | 中沙群岛 | 10 | 11 | 7 | 3 | 7 | 4 | 0.867 | 0.709 | 0.003 | 0.002 | 1.711 | 0.909 | |
| 西沙群岛 | 11 | 12 | 4 | 3 | 5 | 4 | 0.709 | 0.561 | 0.002 | 0.001 | 0.873 | 0.742 | ||
| 南沙群岛 | 19 | 23 | 50 | 88 | 11 | 7 | 0.830 | 0.806 | 0.030 | 0.024 | 15.930 | 13.024 | ||
| 菲律宾 | 10 | - | 5 | - | 5 | - | 0.756 | - | 0.003 | - | 1.489 | - | ||
| 中国台湾岛 | 4 | - | 5 | - | 2 | - | 0.500 | - | 0.005 | - | 2.500 | - | ||
| 印度尼西亚 | 7 | - | 5 | - | 6 | - | 0.952 | - | 0.004 | - | 2.095 | - | ||
| 整体 | 61 | 46 | 61 | 88 | 23 | 8 | 0.799 | 0.739 | 0.013 | 0.014 | 6.787 | 7.305 | ||
| 栉齿 刺尾鲷 | 西沙群岛 | 5 | 4 | 62 | 14 | 4 | 3 | 0.900 | 0.833 | 0.071 | 0.018 | 37.200 | 9.167 | |
| 南沙群岛 | 20 | 21 | 67 | 17 | 11 | 9 | 0.842 | 0.800 | 0.058 | 0.012 | 30.200 | 6.210 | ||
| 中国台湾岛 | 3 | - | 3 | - | 2 | - | 0.667 | - | 0.004 | - | 2.000 | - | ||
| 印度尼西亚 | 5 | - | 11 | - | 4 | - | 0.900 | - | 0.008 | - | 4.400 | - | ||
| 整体 | 33 | 25 | 77 | 18 | 17 | 10 | 0.822 | 0.787 | 0.050 | 0.013 | 26.426 | 6.500 | ||
| 金带 齿颌鲷 | 中沙群岛 | 6 | 6 | 1 | 0 | 2 | 1 | 0.333 | 0.000 | 0.001 | 0.000 | 0.333 | 0.000 | |
| 西沙群岛 | 5 | 20 | 0 | 1 | 1 | 2 | 0.000 | 0.100 | 0.000 | 0.000 | 0.000 | 0.100 | ||
| 南沙群岛 | 12 | 19 | 3 | 2 | 4 | 3 | 0.455 | 0.205 | 0.001 | 0.000 | 0.500 | 0.211 | ||
| 印度尼西亚 | 4 | - | 2 | - | 3 | - | 0.833 | - | 0.002 | - | 1.167 | - | ||
| 整体 | 27 | 45 | 4 | 3 | 5 | 4 | 0.393 | 0.130 | 0.001 | 0.000 | 0.484 | 0.133 | ||
| 四带笛鲷 | 西沙群岛 | 19 | 21 | 37 | 11 | 12 | 5 | 0.836 | 0.538 | 0.021 | 0.006 | 12.357 | 3.048 | |
| 南沙群岛 | 13 | 24 | 5 | 6 | 6 | 3 | 0.641 | 0.163 | 0.002 | 0.001 | 0.897 | 0.500 | ||
| 整体 | 32 | 45 | 41 | 17 | 16 | 7 | 0.756 | 0.358 | 0.014 | 0.003 | 8.482 | 1.859 | ||
| 黑边 角鳞鲀 | 中沙群岛 | 25 | 33 | 5 | 7 | 5 | 8 | 0.470 | 0.384 | 0.002 | 0.001 | 0.907 | 0.481 | |
| 西沙群岛 | 10 | 5 | 3 | 5 | 3 | 4 | 0.644 | 0.900 | 0.002 | 0.004 | 1.267 | 2.000 | ||
| 南沙群岛 | 15 | 27 | 6 | 11 | 4 | 9 | 0.600 | 0.604 | 0.003 | 0.002 | 1.429 | 1.083 | ||
| 菲律宾 | 11 | 10 | 6 | 5 | 5 | 5 | 0.618 | 0.667 | 0.002 | 0.002 | 1.091 | 1.000 | ||
| 印度尼西亚 | 4 | - | 3 | - | 3 | - | 0.833 | - | 0.003 | - | 1.500 | - | ||
| 整体 | 65 | 75 | 13 | 24 | 11 | 21 | 0.562 | 0.538 | 0.002 | 0.002 | 1.136 | 0.871 | ||
| 多带 副绯鲤 | 中沙群岛 | 10 | 10 | 3 | 17 | 4 | 10 | 0.533 | 1.000 | 0.002 | 0.012 | 0.867 | 6.911 | |
| 西沙群岛 | - | 3 | - | 9 | - | 3 | - | 1.000 | - | 0.010 | - | 6.000 | ||
| 南沙群岛 | 10 | 7 | 3 | 12 | 4 | 7 | 0.644 | 1.000 | 0.001 | 0.010 | 0.756 | 5.571 | ||
| 中国台湾岛 | 6 | - | 4 | - | 4 | - | 0.867 | - | 0.003 | - | 1.533 | - | ||
| 海南岛 | 6 | 6 | 4 | 15 | 3 | 6 | 0.600 | 1.000 | 0.002 | 0.011 | 1.333 | 6.533 | ||
| 印度尼西亚 | 10 | - | 7 | - | 7 | - | 0.911 | - | 0.004 | - | 1.978 | - | ||
| 整体 | 42 | 26 | 15 | 17 | 13 | 21 | 0.711 | 0.982 | 0.002 | 0.007 | 1.266 | 4.255 | ||
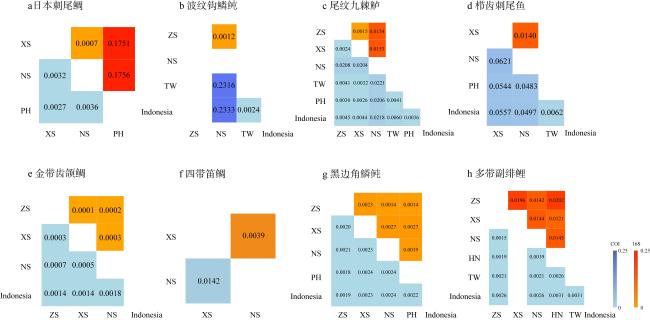
图4 基于COI基因和16S序列的K2P遗传距离分析ZS: 中沙群岛; XS: 西沙群岛; NS: 南沙群岛; HN: 海南岛; TW: 中国台湾岛; PH: 菲律宾; Indonesia: 印度尼西亚。16S 序列: 对角线以上; COI 基因序列: 对角线以下 Fig. 4 K2P genetic distance analysis based on COI gene and 16S sequences. ZS: Zhongsha Islands; XS: Xisha Islands; NS: Nansha Islands; HN: Hainan Island; TW: Taiwan Island of China; PH: Phillipiine; Indonesia: Indonesia.16S gene sequence: above diagonal; COI gene sequence: below diagonal |
表5 基于Maxent模型评估8种鱼类的模型预测能力Tab. 5 Evaluation of the model prediction ability of 8 fish species based on the Maxent model |
| 物种 | AUC (mean ± SD) | TSS (mean ± SD) | Boyce (mean ± SD) |
|---|---|---|---|
| 日本刺尾鱼 | 0.904 ± 0.093 | 0.806 ± 0.166 | 0.757 ± 0.263 |
| 波纹钩鳞鲀 | 0.988 ± 0.003 | 0.924 ± 0.030 | 0.882 ± 0.095 |
| 尾纹九棘鲈 | 0.986 ± 0.003 | 0.934 ± 0.017 | 0.847 ± 0.075 |
| 栉齿刺尾鲷 | 0.989 ± 0.005 | 0.934 ± 0.025 | 0.943 ± 0.046 |
| 金带齿颌鲷 | 0.983 ± 0.010 | 0.903 ± 0.053 | 0.811 ± 0.107 |
| 四带笛鲷 | 0.986 ± 0.003 | 0.907 ± 0.015 | 0.987 ± 0.008 |
| 黑边角鳞鲀 | 0.988 ± 0.007 | 0.912 ± 0.049 | 0.778 ± 0.100 |
| 多带副绯鲤 | 0.986 ± 0.007 | 0.944 ± 0.016 | 0.947 ± 0.032 |
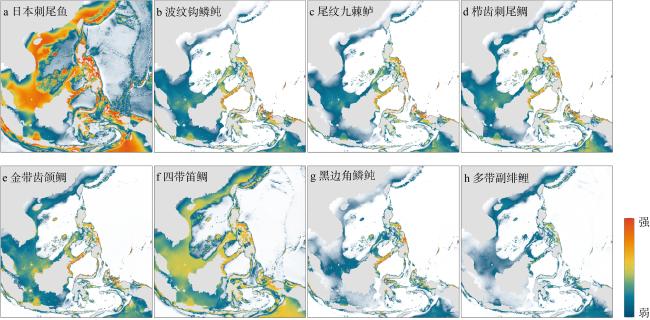
图5 当前气候条件下8种典型鱼类的适宜生境分布(颜色代表物种在印太交汇区的出现概率从强到弱)该图基于国家测绘地理信息局标准地图服务网站下载的审图号为GS(2016)1663号的标准地图制作, 底图无修改 Fig. 5 Suitable habitat distribution of eight typical fish species under current climate conditions. Map colors show the probability of species occurrence in the Indo-Pacific region corresponded to the scale bar and range from high (red) to low (blue) |
表6 基于Maxent模型预测8种鱼类的环境变量重要性Tab. 6 Prediction of the importance of environmental variables for 8 fish species based on the Maxent model |
| 物种 | 深度 | 海表年平均盐度 | 海表年平均盐度范围 | 海表年平均温度 | 海表年平均温度范围 |
|---|---|---|---|---|---|
| 日本刺尾鱼 | 1 | 0 | 0.428 | 0.026 | 0 |
| 波纹钩鳞鲀 | 1 | 0.138 | 0.065 | 0.025 | 0.233 |
| 尾纹九棘鲈 | 0.999 | 0.116 | 0.113 | 0.006 | 0.152 |
| 栉齿刺尾鲷 | 0.998 | 0.085 | 0.134 | 0.059 | 0.124 |
| 金带齿颌鲷 | 0.999 | 0.052 | 0.164 | 0.117 | 0.094 |
| 四带笛鲷 | 0.941 | 0.011 | 0.018 | 0.098 | 0.014 |
| 黑边角鳞鲀 | 0.988 | 0.100 | 0.172 | 0.031 | 0.380 |
| 多带副绯鲤 | 0.980 | 0.099 | 0.074 | 0.109 | 0.019 |
| [1] |
杜建国, 叶观琼, 周秋麟, 等, 2015. 近海海洋生态连通性研究进展[J]. 生态学报, 35(21): 6923-6933.
|
| [2] |
何思璇, 张典, 吴福星, 等, 2022. 厦门湾中华白海豚潜在生态廊道识别及人类活动干扰评估[J]. 生态学报, 42(21): 8555-8567.
|
| [3] |
李慧, 李丽, 吴巩胜, 等, 2018. 基于电路理论的滇金丝猴生境景观连通性分析[J]. 生态学报, 38(6): 2221-2228.
|
| [4] |
徐奎栋, 2021. 印太交汇区海洋生物多样性中心形成演化机制研究进展与展望[J]. 海洋与湖沼, 52(2): 262-273.
|
| [5] |
俞孔坚, 李迪华, 1997. 城乡与区域规划的景观生态模式[J]. 国外城市规划, (3): 27-31 (in Chinese).
|
| [6] |
|
| [7] |
|
| [8] |
|
| [9] |
|
| [10] |
|
| [11] |
|
| [12] |
|
| [13] |
|
| [14] |
|
| [15] |
|
| [16] |
|
| [17] |
|
| [18] |
|
| [19] |
|
| [20] |
|
| [21] |
|
| [22] |
|
| [23] |
|
| [24] |
|
| [25] |
|
| [26] |
|
| [27] |
|
| [28] |
|
| [29] |
|
| [30] |
|
| [31] |
|
| [32] |
|
| [33] |
|
| [34] |
|
| [35] |
|
| [36] |
|
| [37] |
|
| [38] |
|
| [39] |
|
| [40] |
|
| [41] |
|
| [42] |
|
| [43] |
|
| [44] |
|
| [45] |
|
| [46] |
|
| [47] |
|
| [48] |
|
| [49] |
|
| [50] |
|
| [51] |
|
| [52] |
|
| [53] |
|
| [54] |
|
| [55] |
|
| [56] |
|
| [57] |
|
| [58] |
|
| [59] |
|
| [60] |
|
| [61] |
|
| [62] |
|
| [63] |
|
| [64] |
|
| [65] |
|
| [66] |
|
| [67] |
|
| [68] |
|
| [69] |
|
| [70] |
|
| [71] |
|
| [72] |
|
| [73] |
|
| [74] |
|
| [75] |
|
| [76] |
|
| [77] |
|
| [78] |
|
| [79] |
|
| [80] |
|
| [81] |
|
| [82] |
|
| [83] |
|
| [84] |
|
| [85] |
|
| [86] |
|
/
| 〈 |
|
〉 |
