
Journal of Tropical Oceanography >
Summer hydrological variations during 2021-2023 in the Pearl River Estuary and its adjacent areas
Copy editor: SUN Cuici
Received date: 2024-02-22
Revised date: 2024-03-18
Online published: 2024-05-10
Supported by
Southern Marine Science and Engineering Guangdong Laboratory (Zhuhai)(SML2023SP219)
National Natural Science Foundation of China(42176029)
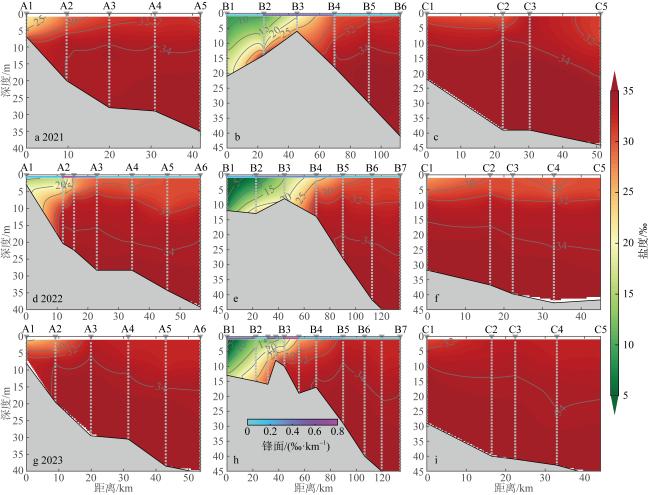
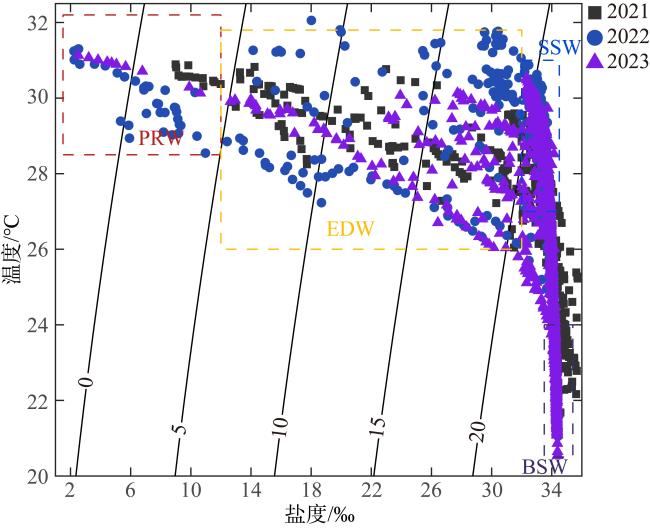
Using in-situ data collected by summer cruises during 2021−2023, summer hydrological variations and their influencing factors were studied. The results show that the summer temperature and salinity were charactered by northeast-southwest distribution pattern, while variations in values were significant during the investigation. Mean sea surface temperature (SST) was lowest in 2021 but highest in 2022. Bottom temperature was highest in 2021, but moderate in 2022 and lowest in 2023. Strong runoff caused a significant outward expansion of diluted waters, sea surface salinity (SSS) was strikingly lower in 2022 than those in 2021 and 2023. Bottom salinity was highest in 2023, moderate in 2021 and lower in 2022. Temperature and salinity variations in the middle and low layers were related to the passage of typhoons and invasion of shelf cold and saline water. Those vertical temperature and salinity observed after Typhoon Lupit passed in 2021 mixed homogeneously, weakening stratification. Bottom shelf water intruded into the Lingding Bay, forming a low-temperature zone and apparent salinity front. Middle and bottom temperature (salinity) decreased (increased) owing to the enhanced bottom shelf water intrusion in sequence in 2022 and 2023. In 2023, strong upwelling inhibited the expansion of diluted water seaward to increase SSS over the shelf higher than those in 2021 and 2022. Bottom temperature and salinity varied with the tide, in which the shoreward movement of cold and saline water tended to decrease temperature and increase salinity during flood tide, while the opposite occurred during ebb tide. The positive correlation between SST and air temperature suggested that SST varied with air temperature.
Key words: Pearl River Estuary; hydrology; spatiotemporal variations; shelf water; onshore wind
GUO Shaojing , ZHANG Xiaobo , CHANG Jinglong , ZHANG Shouwen , JI Xuanliang , MIAO Runqiao , LI Jiandong , ZHU Xueming . Summer hydrological variations during 2021-2023 in the Pearl River Estuary and its adjacent areas[J]. Journal of Tropical Oceanography, 2025 , 44(1) : 108 -121 . DOI: 10.11978/2024042
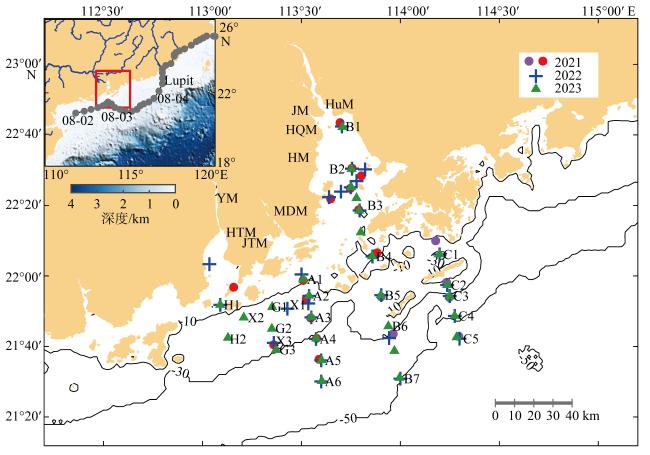
图1 珠江地理位置和2021—2023年航次观测站位分布基于国家测绘地理信息局标准地图服务网站下载的审图号GS粤(2023)1023号的标准地图制作; 虎门、蕉门、洪奇门和横门分别标记为HuM、JM、HQM和HM, 磨刀门、鸡啼门、崖门和虎跳门分别标记为MDM、JTM、YM和HTM; 等值线和插图填色表示水深, 左上内图中黑色点线为2021年台风Lupit路径, 其过境前后观测的站位分别用红色和紫色标记 Fig. 1 Map of the Pearl River and distribution of observed stations in the summer during 2021−2023. The contours and shading in the inset indicate water depth. The black dotted line in the inset represents track of Typhoon Lupit in 2021, and observed stations before and after Lupit passed are marked in red and purple circles, respectively |
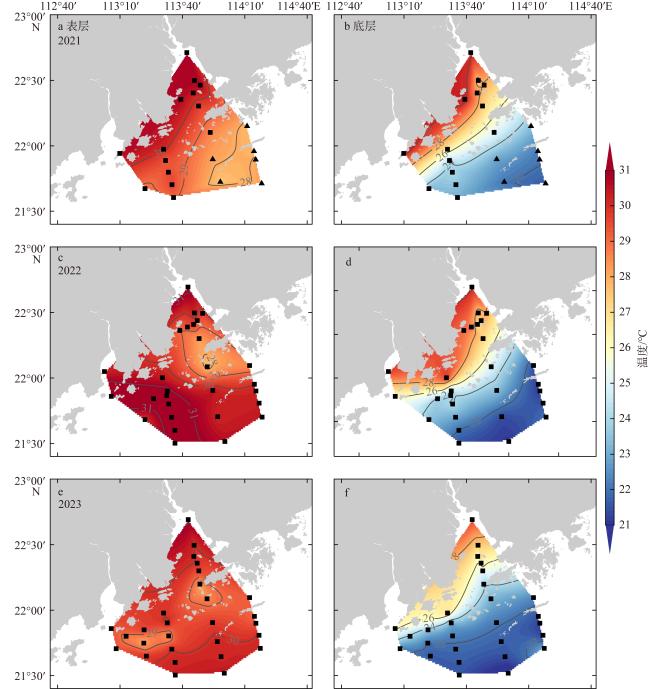
图2 2021—2023年夏季表层(a、c、e)和底层(b、d、f)海温空间分布基于国家测绘地理信息局标准地图服务网站下载的审图号GS粤(2023)1023号的标准地图制作; 2021年三角形标记的站位是台风Lupit过境后观测站位 Fig. 2 Distribution of SST (a, c, e) and bottom temperature (b, d, f) in the summer during 2021−2023 |
表1 2021—2023年调查期间水文参数平均值及标准差Tab. 1 Mean and standard deviation of hydrological parameters during investigations from 2021 to 2023 |
| 年份 | 海温/℃ | 盐度/‰ | 密度/(kg·m-3) | |||
|---|---|---|---|---|---|---|
| 表层 | 底层 | 表层 | 底层 | 表层 | 底层 | |
| 2021 | 29.4±1.1 | 25.4±2.9 | 24.7±8.5 | 31.1±5.6 | 1014.3±6.7 | 1020.4±5.1 |
| 2022 | 30.4±1.1 | 24.8±3.1 | 20.4±10.1 | 28.2±9.4 | 1010.7±7.4 | 1018.4±7.9 |
| 2023 | 29.6±0.8 | 23.1±2.1 | 28.4±7.1 | 33.2±3.4 | 1016.9±5.3 | 1022.7±3.1 |
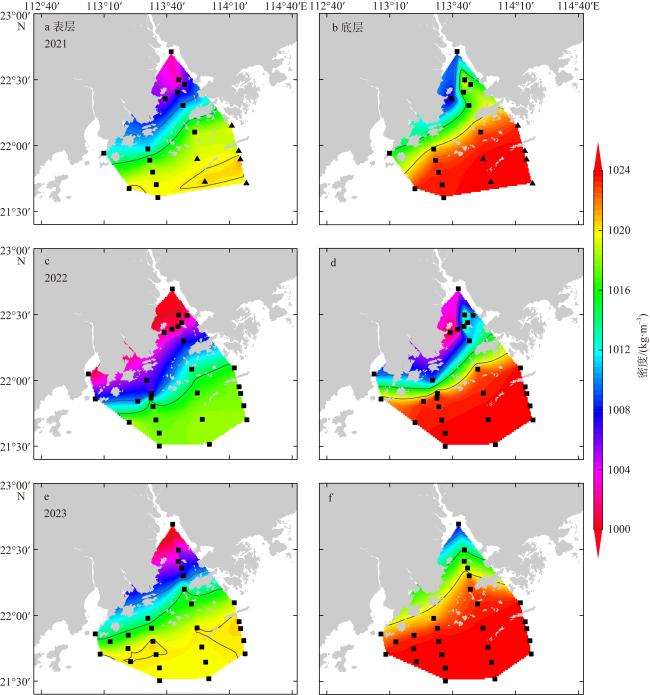
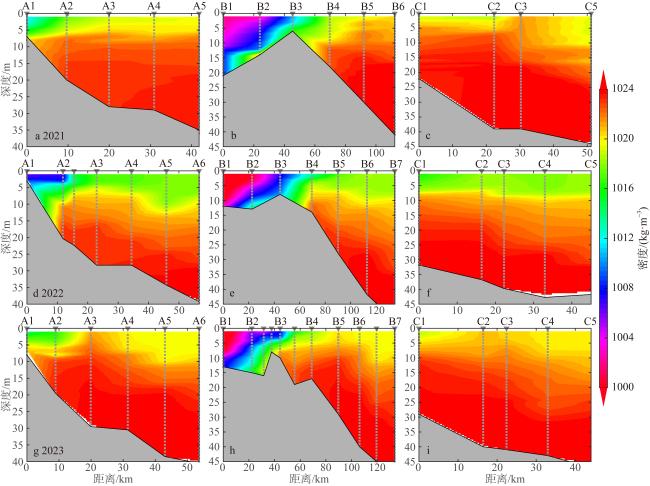
图6 2021—2023年夏季表层(a、c、e)和底层(b、d、f)密度空间分布基于国家测绘地理信息局标准地图服务网站下载的审图号GS粤(2023)1023号的标准地图制作 Fig. 6 Distribution of sea surface (a, c, e) and bottom (b, d, f) density in the summer during 2021−2023 |
表2 表、中和底层海温和盐度与平行海岸风(U′)、垂直海岸风(V′)和气温的相关系数Tab. 2 Correlation coefficients between surface, middle and bottom temperature and salinity with along coastal winds (U′), vertical onshore winds (V′), and air temperature |
| 海温 | 盐度 | |||||
|---|---|---|---|---|---|---|
| 表层 | 中层 | 底层 | 表层 | 中层 | 底层 | |
| U′ | - | - | - | - | - | - |
| V′ | -0.42 | -0.46 | -0.44 | 0.42 | 0.26 | 0.21 |
| 气温 | 0.36 | -0.22 | -0.31 | 0.40 | 0.38 | 0.38 |
注: “-”表示未通过90%显著性水平, 正常和加粗字体分别表示超过90%和95%显著性水平 |
作者感谢各位匿名审稿人的专业建议和意见。海洋观测资料采集离不开全体科考人员和船员的辛勤付出, 在此对他们在2021—2023年夏季粤港澳大湾区海洋生物地球化学综合考察航次做出的贡献致以诚挚的谢意
| [1] |
陈希荣, 朱佳, 孙振宇, 等, 2018. 2015年7—8月珠江冲淡水扩展特征的观测与分析[J]. 厦门大学学报(自然科学版), 57(6): 841-848.
|
| [2] |
林卫强, 李适宇, 2002. 夏季伶仃洋COD、DO的垂向分布及其影响因素[J]. 中山大学学报(自然科学版), 41(4): 82-86.
|
| [3] |
林祖亨, 梁舜华, 1996. 珠江口水域的潮流分析[J]. 海洋通报, 15(2): 11-22.
|
| [4] |
毛汉礼, 甘子钧, 蓝淑芳, 1963. 长江冲淡水及其混合问题的初步探讨[J]. 海洋与湖沼, 5(3): 183-206.
|
| [5] |
宋晓飞, 石荣贵, 孙羚晏, 等, 2014. 珠江口磨刀门盐水入侵的现状与成因分析[J]. 海洋通报, 33(1): 7-15.
|
| [6] |
伍伯瑜, 1990. 珠江口以西陆架海域环流研究Ⅲ[J]. 台湾海峡, 9(2): 118-126.
|
| [7] |
夏华永, 刘长建, 王东晓, 2018. 2006年夏季珠江冲淡水驱动的上升流[J]. 海洋学报, 40(7): 43-54.
|
| [8] |
夏维, 周争桥, 2021. 基于观测资料的珠江口附近海域夏季气象水文要素分析[J]. 海洋湖沼通报, 43(5): 60-65.
|
| [9] |
杨威, 罗琳, 高永利, 等, 2011. 1999年和2009年夏季珠江口环境要素的对比与分析[J]. 热带海洋学报, 30(4): 16-23.
|
| [10] |
曾淦宁, 胡建宇, 洪华生, 等, 2005. 西南季风不同阶段南海北部珠江口外断面水文调查分析[J]. 热带海洋学报, 24(3): 10-17.
|
| [11] |
章文, 刘丙军, 陈晓宏, 等, 2013. 珠江口磨刀门水道盐度变化与潮汐过程的相关性分析[J]. 中山大学学报(自然科学版), 52(6): 11-16.
|
| [12] |
张燕, 夏华永, 钱立兵, 等, 2011. 2006年夏、冬季珠江口附近海域水文特征调查分析[J]. 热带海洋学报, 30(1): 20-28.
|
| [13] |
赵焕庭, 1990. 珠江河口演变[M]. 北京: 海洋出版社: 116-147 (in Chinese).
|
| [14] |
朱佳, 胡建宇, 陈照章, 等, 2005. 珠江口以外海域温、盐度的断面分布特征———2001年5月与2002年11月航次[J]. 厦门大学学报(自然科学版), 44(5): 680-683.
|
| [15] |
|
| [16] |
|
| [17] |
|
| [18] |
|
| [19] |
|
/
| 〈 |
|
〉 |
