
Journal of Tropical Oceanography >
Underwater glider observation of oxygen minimum zone in the northern South China Sea
Copy editor: YAO Yantao
Received date: 2021-01-28
Revised date: 2021-04-04
Online published: 2021-04-06
Supported by
Strategic Priority Research Program of the Chinese Academy of Sciences(XDA13030200)
Key Special Project of Southern Marine Science and Engineering Guangdong Laboratory (Guangzhou)(GML2019ZD0305)
National Key Research and Development Program of China(2016YFC0301202)
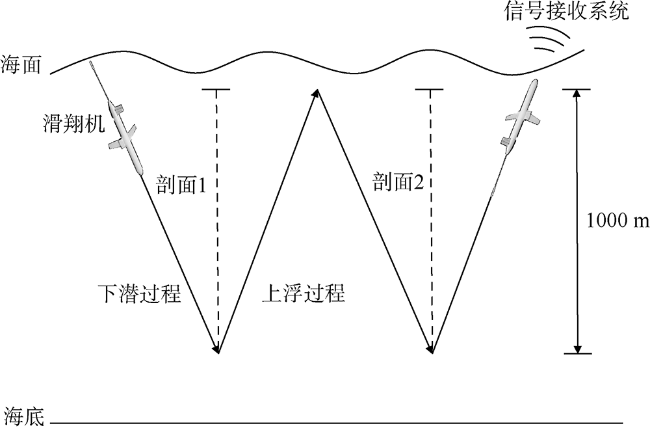
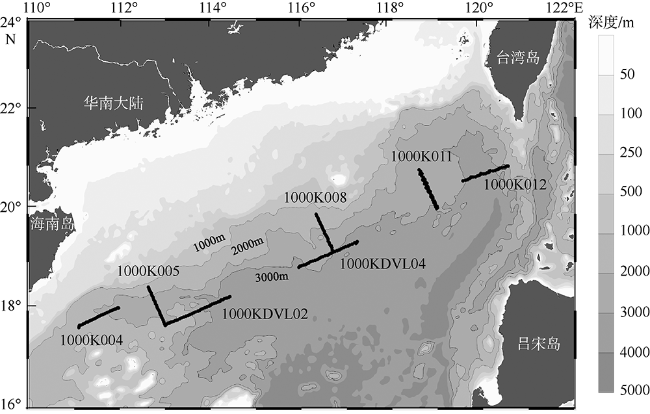
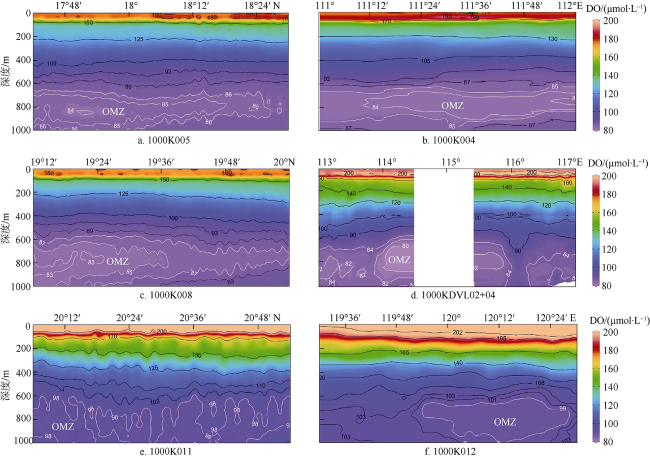
The Oxygen Minimum Zone (OMZ) is a stable dissolved oxygen (DO) minimum layer that forms in the mid-ocean water (200~1000 m). High-resolution surveys of DO in the water columns near the continental slope of the northern South China Sea (NSCS) were performed during July-September 2019 using an observation network including seven Sea-Wing Gliders. Our results revealed the existence of a stable basin-scale OMZ in the middle layer of the NSCS. Our data indicated that the depth of the OMZ was about 700 m with minimal DO content of about 80-100 μmol·L-1. Besides, the DO content remains relatively stable within the depth range of 700-900 m, with an averaged OMZ thickness of about 200 m. The OMZ generally shows a wedge-shaped distribution in the horizontal direction with a gradual decrease of OMZ thickness and intensity from the southwest to the northeast along the continental slope of the NSCS. The OMZ eventually disappears near the Luzon Strait. In addition, we used data of two sections near the Xisha regions with repeated glider surveys to estimate the temporal change of OMZ over time. Our results suggested that the DO concentration within the OMZ core increased by ~0.023 μmol·L-1 per day in the cross-slope direction but decreased by ~0.034 μmol·L-1 per day in the along-slope direction. The increase of DO content in the northeastern OMZ can be explained by the intrusion of high-oxygen water through the Luzon Strait. Based on the above observation results, we believe that the distribution and formation of the OMZ be affected by physical processes such as advection, water mass distribution and stratification; it is also related to biological respiratory, organic decomposition, oxidation of reducing substances, and other factors.
MA Mengzhen , LI Qian , WU Zhengchao , CHEN Yinchao , YU Jiancheng . Underwater glider observation of oxygen minimum zone in the northern South China Sea[J]. Journal of Tropical Oceanography, 2022 , 41(1) : 131 -142 . DOI: 10.11978/2021012
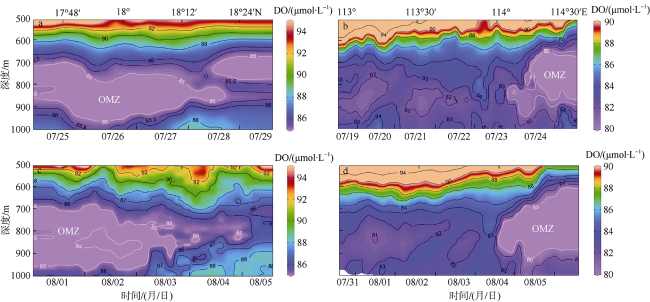
图3 DO浓度剖面分布图a、c、e为跨陆坡断面观测, b、d、f为沿陆坡断面观测; 图中数值为DO浓度等值线标值, 白色等值线为断面内DO浓度最小值 Fig. 3 Vertical distributions of DO. (a), (c) and (e) are across-slope distributions; (b), (d) and (f) are along-slope distributions. DO contours are shown, with the white contour for the minimum DO value in each section |
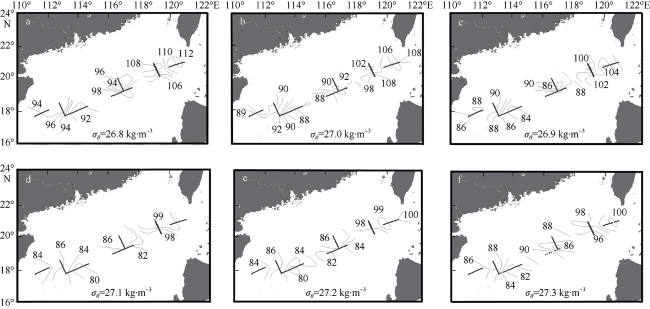
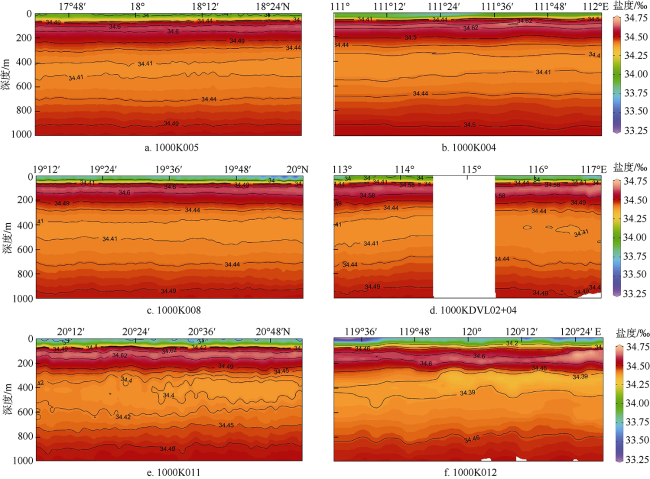
图4 DO浓度在等密度面(σθ=26.8~27.3kg·m-3)上的水平分布图该图基于国家测绘地理信息局标准地图服务网站下载的审图号为GS(2020)4634号的标准地图制作 图a Horizontal distributions of DO on the isopycnal surface (σθ=26.8-27.3 kg·m-3). (a-f) are the DO on the isopycnal surface from 26.8 to 27.3 kg·m-3, with density interval of 0.1 kg·m-3 |
表1 OMZ区域内DO浓度的平均变化速率Tab. 1 Average change rate of DO content in OMZ core area |
| 滑翔机编号 | 开始时间 | 结束时间 | 计算时间T | 变化速率v |
|---|---|---|---|---|
| 1000K005 | 07/25—07/29 | 08/01—08/05 | 7d | 0.023μmol·L-1·d-1 |
| 1000KDVL02 | 07/19—07/24 | 07/31—08/05 | 12d | -0.034μmol·L-1·d-1 |
注: 变化速率v为负数时表示DO平均浓度减少 |
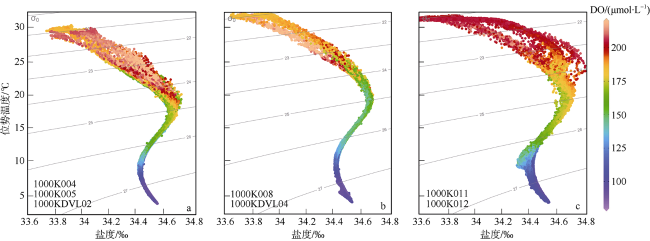
图6 7台水下滑翔机的T-S-DO点聚图图a T-S-DO diagram of seven sea-wing underwater gliders. The color change in the figure indicates the DO content change in μmol·L-1. The contour line indicates potential density, in kg·m-3. (a), (b) and (c) represent the western, middle and eastern regions of the continental slope, respectively |
*感谢编辑和审稿专家对本文给予的修改意见和建议。
| [1] |
刁焕祥, 1986. 太平洋溶解氧垂直分布最小值形成机理的探讨[J]. 海洋学报, 8(2): 184-189. (in Chinese)
|
| [2] |
冯士筰, 李凤岐, 李少菁, 1999. 海洋科学导论[M]. 北京: 高等教育出版社: 1-524. (in Chinese)
|
| [3] |
黄企洲, 王文质, 李毓湘, 等, 1992. 南海海流和涡旋概况[J]. 地球科学进展, 7(5): 1-9.
|
| [4] |
李学刚, 宋金明, 袁华茂, 等, 2017. 深海大洋最小含氧带(OMZ)及其生态环境效应[J]. 海洋科学, 41(12): 127-138.
|
| [5] |
刘洋, 2010. 南海次表层、中层水团结构及其运动学特征的研究[D]. 青岛: 中国海洋大学.
|
| [6] |
刘洋, 鲍献文, 吴德星, 2011. 南海溶解氧垂直结构的季节变化分析[J]. 中国海洋大学学报, 41(1-2): 25-32.
|
| [7] |
刘增宏, 许建平, 孙朝辉, 等, 2011. 吕宋海峡附近海域水团分布及季节变化特征[J]. 热带海洋学报, 30(1): 11-19.
|
| [8] |
龙爱民, 陈绍勇, 周伟华, 等, 2006. 南海北部秋季营养盐、溶解氧、pH值和叶绿素a分布特征及相互关系[J]. 海洋通报, 25(5): 9-16.
|
| [9] |
罗琳, 李适宇, 厉红梅, 2005. 夏季珠江口水域溶解氧的特征及影响因素[J]. 中山大学学报(自然科学版), 44(6): 118-122.
|
| [10] |
石晓勇, 李鸿妹, 韩秀荣, 等, 2014. 夏季南海北部典型中尺度物理过程对营养盐及溶解氧分布特征的影响[J]. 环境科学学报, 34(3): 695-703.
|
| [11] |
杨嘉东, 1991. 南海中部海区溶解氧垂直分布最小值[J]. 海洋与湖沼, 22(4): 353-359.
|
| [12] |
杨阳, 马媛, 史华明, 2013. 南海北部坡折带溶解氧分布特征及理化环境因子影响[J]. 海洋学报, 35(1): 104-110.
|
| [13] |
叶丰, 黄小平, 刘庆霞, 2012. 2010年夏季珠江口海域溶解氧的分布特征和海气交换通量[J]. 海洋环境科学, 31(3): 346-351.
|
| [14] |
|
| [15] |
|
| [16] |
|
| [17] |
|
| [18] |
|
| [19] |
|
| [20] |
|
| [21] |
|
| [22] |
|
| [23] |
|
| [24] |
|
| [25] |
|
| [26] |
|
| [27] |
|
| [28] |
|
| [29] |
|
| [30] |
|
| [31] |
|
| [32] |
|
| [33] |
|
| [34] |
|
| [35] |
|
| [36] |
|
| [37] |
|
| [38] |
|
| [39] |
|
| [40] |
|
| [41] |
|
| [42] |
|
| [43] |
|
| [44] |
|
| [45] |
|
| [46] |
|
| [47] |
|
| [48] |
|
| [49] |
|
| [50] |
|
| [51] |
|
| [52] |
|
| [53] |
|
| [54] |
|
| [55] |
|
| [56] |
|
| [57] |
|
| [58] |
|
| [59] |
|
| [60] |
|
| [61] |
|
/
| 〈 |
|
〉 |
