
Journal of Tropical Oceanography >
Step-by-step high-precision velocity modeling technique based on full waveform inversion and traveltime tomography and its application in complex structure imaging of Weizhou Oilfield*
Copy editor: YIN Bo
Received date: 2024-04-08
Revised date: 2024-06-24
Online published: 2024-07-04
The Weizhou Oilfield in Beibu Bay, South China Sea, has a complex structure, developed faults and fractured strata, resulting in a non-uniform velocity structure. To meet production requirements, this area has undergone multi-round traveltime tomography velocity modeling, including velocity modeling of dual-azimuth streamer seismic data. However, imaging quality remains poor. Full waveform inversion (FWI) builds a more accurate velocity model by making full use of the amplitude and traveltime information of the seismic wavefield. However, this process usually requires that the seismic data contain long offset components. Given the limited offset of streamer seismic data in the Weixi exploration area, this paper develops a high-precision velocity modeling technique process that combines FWI and traveltime tomography. Firstly, multi-scale FWI from low to high frequency is used to invert shallow and intermediate layer velocity models derived from high-SNR turning and refracted wave signals. Reflection traveltime tomography is then used to update the deep-layer velocity model. Compared to conventional reflection traveltime tomography modeling, the accuracy of the velocity model is improved, which in turn improves the structural imaging of the target area, making the fault structure more discernible. This work lays a solid data foundation for the oilfield to increase storage and expand production and realize benefit exploitation.
LIU Miao , CHEN Linzhi , NIU Huawei , ZHAO Xiulian , LI Yaqing . Step-by-step high-precision velocity modeling technique based on full waveform inversion and traveltime tomography and its application in complex structure imaging of Weizhou Oilfield*[J]. Journal of Tropical Oceanography, 2025 , 44(2) : 178 -186 . DOI: 10.11978/2024078
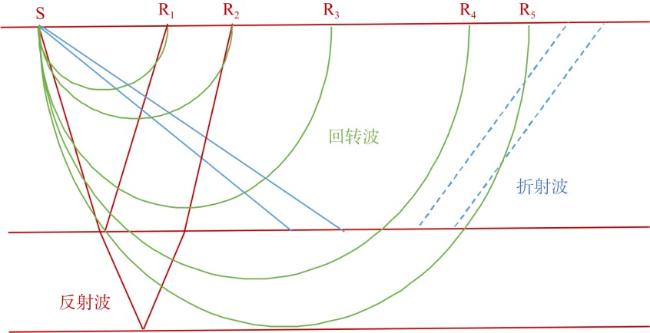
图1 地震波传播示意图图中红色平行线表示地层; 红色折线表示反射波路径; 绿色曲线表示回转波路径; 蓝色实线表示折射波入射路径; 蓝色虚线表示折射波出射路径。S为激发点; R1~R5为接收点 Fig. 1 Schematic diagram of seismic wave propagation The red parallel lines in the figure represent the strata; The red line represents the path of the reflected wave; The green curve represents the path of the rotating wave; The blue solid line represents the incident path of refracted waves; The blue dashed line represents the exit path of refracted waves. S is the excitation point; R1~R5 are receiving points |
表1 涠西地震资料观测系统参数Tab. 1 Parameters of seismic data acquisition in Weixi |
| 采集参数 | 2016年高密度三维数据 |
|---|---|
| 采集方式 | 双源8缆 |
| 采集方向 | 0/180 |
| 电缆长度 | 6000 m |
| 道间距 | 12.5 m |
| 炮间距 | 18.75 m |
| 枪/缆沉放深度 | 5/6 m |
| 震源容量 | 4350C.I |
| 电缆间距 | 75 m |
| 面元尺寸 | 6.25 m × 18.75 m |
| 覆盖次数 | 80 |
| 采样率 | 1 ms |
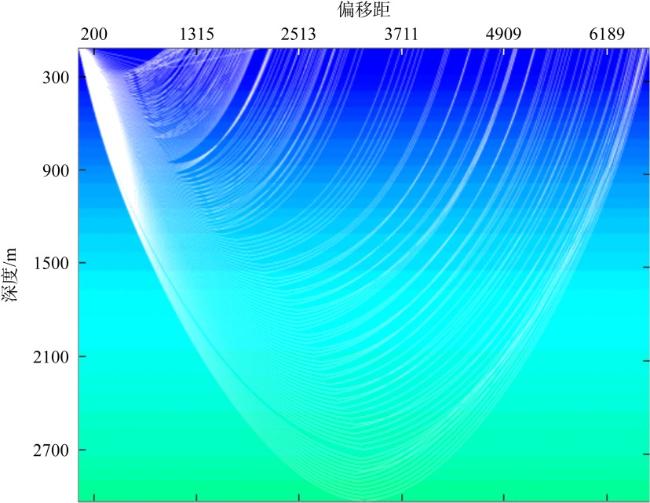
图5 偏移距为6000m的射线分布图白色线条表示射线传播路径; 蓝绿渐变色表示地层从浅到深 Fig. 5 Raypath with an offset of 6000 m |
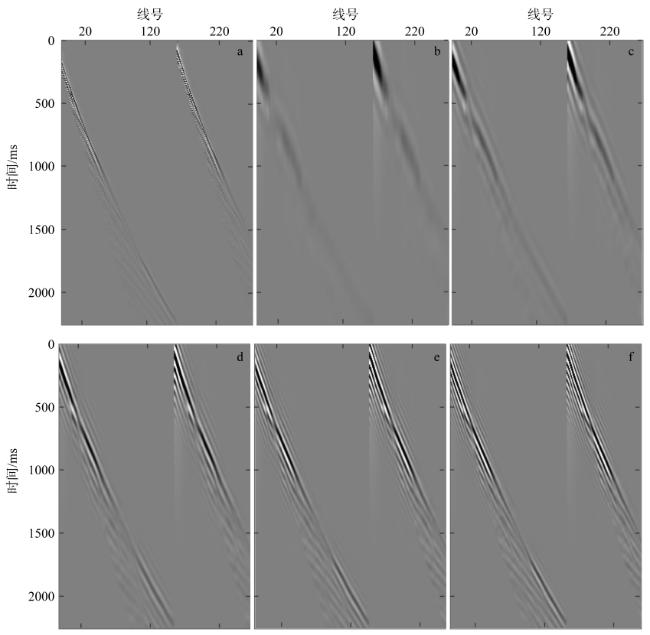
图6 输入炮集数据频率分析a. 原始时间域炮集数据; b. 0.5~2Hz频段; c. 0.5~4Hz频段; d. 0.5~6Hz频段; e. 0.5~8Hz频段; f. 0.5~10Hz频段 Fig. 6 Frequency analysis of input shot gather data. (a) raw data; (b) frequency band of 0.5~2 Hz; (c) frequency band of 0.5~4 Hz; (d) frequency band of 0.5~6 Hz; (e) frequency band of 0.5~8 Hz; (f) frequency band of 0.5~10 Hz |
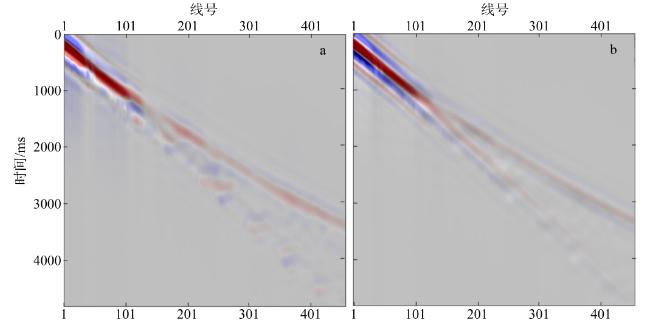
图7 实际数据和正演数据叠合a. 正演数据在下, 灰白显示, 实际数据在上, 红蓝显示。b. 实际数据在下, 灰白显示, 正演数据在上, 红蓝显示 Fig. 7 The observed and synthetic data blending show. (a) The synthetic (gray and white) is shown at the bottom and observed (red and blue) data is shown at the top; (b) The observed (gray and white) is shown at the bottom and synthetic (red and blue) data is shown at the top |
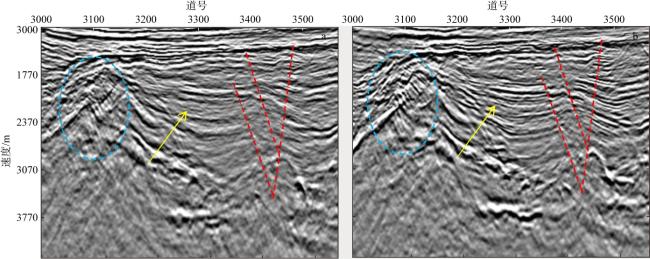
图9 叠前深度偏移效果对比a. 层析建模; b. FWI与层析联合建模。蓝圈区域指示复杂断块区的小断层和内部结构; 黄色箭头指示目的层的波组反射特征; 红色虚线指示断层 Fig. 9 Pre-stack depth migration comparison. (a) Tomography modeling; (b) FWI combined with tomography modeling. The blue circle area indicates small faults and internal structures of complex fault blocks; the yellow arrow indicates the wave group reflection characteristics of the target layer; The red dashed line indicates the fault |
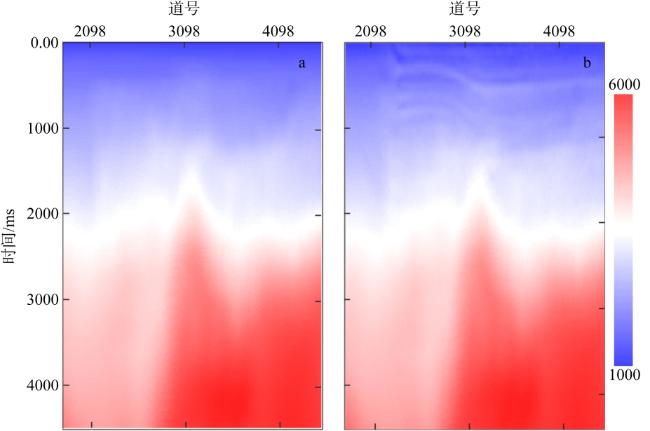
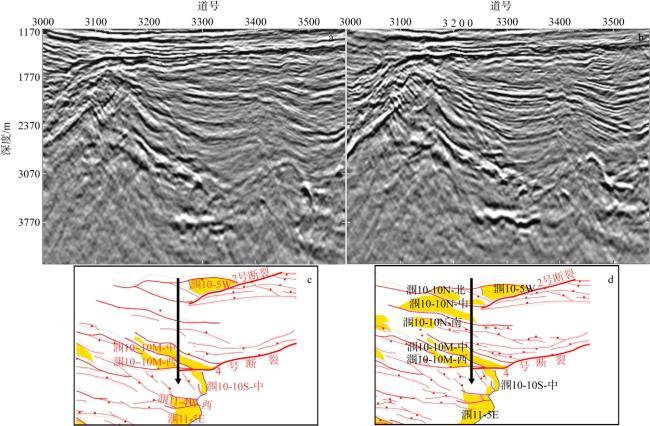
图10 本次速度建模应用范围a. 采用层析速度建模结果进行偏移得到的数据体; b. 采用本次FWI+层析速度建模结果进行偏移的新数据体; c. 对老数据体进行解释后的T32深度图; d. 对新数据体进行解释后的T32深度图。图c中加粗黑色箭头表示图a是过该位置的地震剖面; 粗红色实线表示断裂上盘; 细红色实线表示断裂下盘; 红色方块表示标记断裂上盘; 黄色块状表示解释区块。图d中加粗黑色箭头表示图b是过该位置的地震剖面; 粗红色实线表示断裂上盘; 细红色实线表示断裂下盘; 红色方块表示标记断裂上盘; 黄色块状表示解释区块 Fig. 10 Application scope of this velocity modeling. (a) The stack data obtained by using the migrated tomography velocitymodeling results; (b) The new stack data obtained using the migrated FWI+ tomography velocity modeling results; (c) T32 depthmap after interpretation of the old stack data; (d) T32 depth map after interpretation of the new stack data. The bold black arrow infigure c indicates that figure a is a seismic profile passing through that location; the thick red solid line indicates a fractured upperplate; the thin red solid line represents the fractured lower plate; the red square represents the marking of a broken upper plate;yellow blocks represent explanatory blocks. the bold black arrow in figure d indicates that figure b is a seismic profile passingthrough that location; the thick red solid line indicates a fractured upper plate; the thin red solid line represents the fractured lowerplate; the red square represents the marking of a broken upper plate; yellow blocks represent explanatory blocks |
| [1] |
邓勇, 胡德胜, 朱继田, 等, 2024. 北部湾盆地油气成藏规律与勘探新领域、新类型、资源潜力[J]. 石油学报, 45(1): 202-225.
|
| [2] |
董良国, 迟本鑫, 陶纪霞, 等, 2013. 声波全波形反演目标函数性态[J]. 地球物理学报, 56(10): 3445-3460.
|
| [3] |
秦宁, 李振春, 2012. 一种走时层析与时域全波形联合反演方法[C]// 中国地球物理学会第二十八届年会论文集. 2012: 553-554.
|
| [4] |
|
| [5] |
|
| [6] |
|
| [7] |
|
| [8] |
|
| [9] |
|
| [10] |
|
| [11] |
|
| [12] |
|
| [13] |
|
| [14] |
|
| [15] |
|
| [16] |
|
| [17] |
|
| [18] |
|
/
| 〈 |
|
〉 |
