
Journal of Tropical Oceanography >
Distribution of nutrients and eutrophication characteristics in the surface water around Nan’ao Island
Copy editor: YIN Bo
Received date: 2024-06-05
Revised date: 2024-08-19
Online published: 2024-08-29
Supported by
Science and Technology Planning Project of Guangdong Province(2021B1212050023)
Science and Technology Planning Project of Guangdong Province(2023B1212060047)
National Natural Science Foundation of China(32171548)
Guangdong Basic and Applied Basic Research Foundation(2022A1515010656)
The key environmental factors (nutrients, chlorophyll a (Chl a), chemical oxygen demand (COD), etc.) and eutrophication indexes were investigated in the surface water around the Nan’ao Island in 2022. The seasonal change of nutrients concentration was significant, which gradually declined from northwest to southeast in the surrounding region of the island. The nutrients concentration was significantly higher in winter than in other seasons. During summer, the nutrients concentration was high near the Qin’ao Bay, which possibly originated from the discharge of domestic wastewater. The highest dissolved inorganic nitrogen (DIN) was found near the estuary of the Rongjiang River and the highest dissolved inorganic phosphorus (DIP) was found near a net cage aquaculture zone in the Zhelin Bay. This phenomenon suggested that the river input increased the nitrogen loading and the cage aquaculture increased the phosphorus loading in this region. The seawater showed high Chl a and low nutrients in summer, suggesting the strong bio-assimilation effect of phytoplankton on the nutrients. The structure of nutrients was generally balanced, and no absolute limitation was detected for nitrogen, phosphorus or silicate. Nitrogen nutrients were relatively limited in the offshore region in autumn. According to the eutrophication index (EI), nutrient quality index (NQI) and trophic index (TRIX), the highest eutrophic status was generally located in the Zhelin Bay and the Rongjiang River estuary. However, the region near the Qing’ao Bay showed high eutrophic status in summer. With the rapid development of tourism, the influence of domestic wastewater should be paid more attention to in the Nan’ao Island. The eutrophication indices showed a significantly positive correlation with DIN and a negative correlation with salinity. River discharge should be the main reason for water eutrophication in this region. The eutrophic status could be much underestimated using the EI index for waters with low nutrients and high chlorophyll during summer. The results contribute to a better understanding of the water quality status around the Nan’ao Island and provide basic data for environment management and marine resource utilization.
HUANG Haochen , KE Zhixin , ZHOU Zhixi , ZHOU Weihua . Distribution of nutrients and eutrophication characteristics in the surface water around Nan’ao Island[J]. Journal of Tropical Oceanography, 2025 , 44(2) : 196 -207 . DOI: 10.11978/2024120
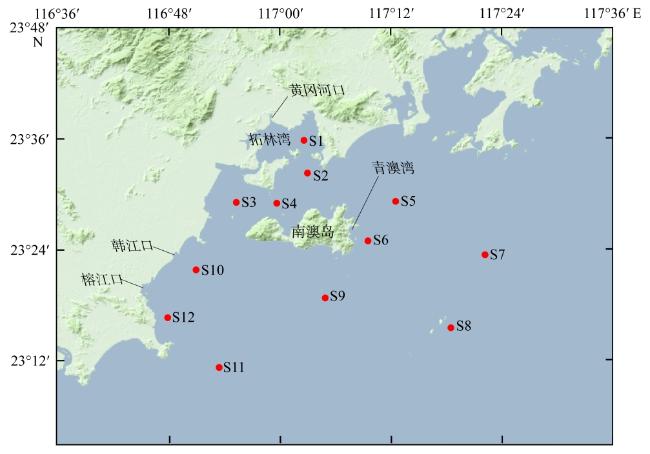
图1 南澳岛周边采样站位分布图该地图基于自然资源部国家基础地理信息中心审图号为GS(2024)0568号标准地图制作, 底图无修改 Fig. 1 The sampling stations around Nan’ao Island This map is based on the standard map GS (2024) 0568 approved by the National Basic Geographic Information Center of the Ministry of Natural Resources, with no modifications to the base map |
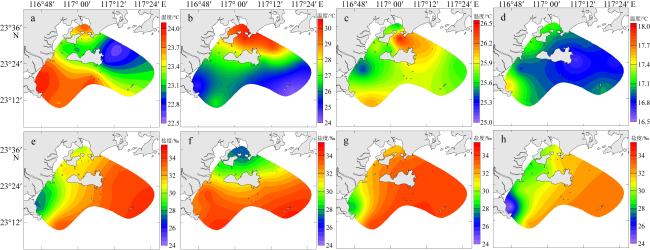
图2 南澳周边海域表层水体温度(a—d)和盐度(e—h)的季节分布特征a, e: 春季; b, f: 夏季; c, g: 秋季; d, h: 冬季 Fig. 2 Seasonal distributions of water temperature (a)—(d) and salinity (e)—(h) in the surface water around Nan’ao Island a, e: spring; b, f: summer; c, g: autumn; d, h: winter |
表1 南澳周边海域表层水体各季节的主要环境因子和富营养化指数(均值±标准差)Tab. 1 The environmental factors and eutrophication index in the surface water around Nan’ao Island in different seasons (mean ± SD) |
| 因子或指数 | 春季 | 夏季 | 秋季 | 冬季 |
|---|---|---|---|---|
| 温度/℃ | 23.38 ± 0.46c | 27.07 ± 1.99a | 25.85 ± 0.28b | 17.00 ± 0.21d |
| 盐度/‰ | 31.71 ± 0.46a | 31.42 ± 2.63a | 32.67 ± 1.77a | 30.78 ± 2.40a |
| DIN/(mg·L-1) | 0.10 ± 0.09b | 0.08 ± 0.06b | 0.17 ± 0.10b | 0.49 ± 0.26a |
| DIP/(mg·L-1) | 0.014 ± 0.016bc | 0.011 ± 0.009c | 0.030 ± 0.013b | 0.050 ± 0.020a |
| DSi/(mg·L-1) | 0.44 ± 0.28b | 0.77 ± 0.52ab | 0.88 ± 0.36ab | 1.06 ± 0.47a |
| DIN/DIP | 20.42 ± 15.97a | 21.41 ± 11.80a | 12.08 ± 3.77a | 21.22 ± 6.58a |
| Chl a/(μg·L-1) | 2.55 ± 2.24b | 7.05 ± 4.94a | 1.44 ± 0.84b | 1.53 ± 0.43b |
| COD/(mg·L-1) | 0.96 ± 0.25b | 1.57 ± 0.26a | 0.68 ± 0.33b | 0.89 ± 0.28b |
| DO/(mg·L-1) | 7.15 ± 0.74bc | 7.79 ± 0.71ab | 7.00 ± 0.67c | 8.07 ± 0.16a |
| EI指数 | 0.51 ± 0.76b | 0.37 ± 0.48b | 0.98 ± 1.06b | 6.34 ± 7.32a |
| NQI指数 | 1.65 ± 0.90b | 2.57 ± 1.00b | 2.10 ± 0.81b | 3.88 ± 1.47a |
| TRIX指数 | 4.43 ± 0.89a | 5.08 ± 0.33a | 4.91 ± 0.70a | 4.87 ± 0.47a |
注: 不同字母表示组间在统计上的显著差异(p<0.05)。所有比较均基于单因素方差分析后的Tukey多重比较 |
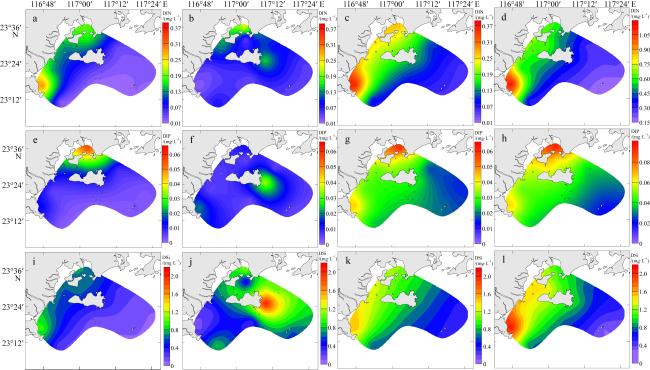
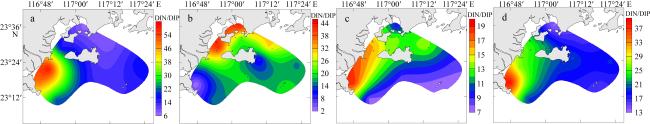
图3 南澳岛周边海域表层溶解无机氮质量浓度(DIN)(a—d)、溶解无机磷质量浓度(DIP)(e—h)和活性硅酸盐质量浓度(DSi)(i—l)的季节分布a, e, i: 春季; b, f, j: 夏季; c, g, k: 秋季; d, h, l: 冬季 Fig. 3 Seasonal distributions of DIN (a)—(d), DIP (e)—(h), and DSi (i)—(l) in the surface water around Nan’ao Island a, e, i: spring; b, f, j: summer; c, g, k: autumn; d, h, l: winter |
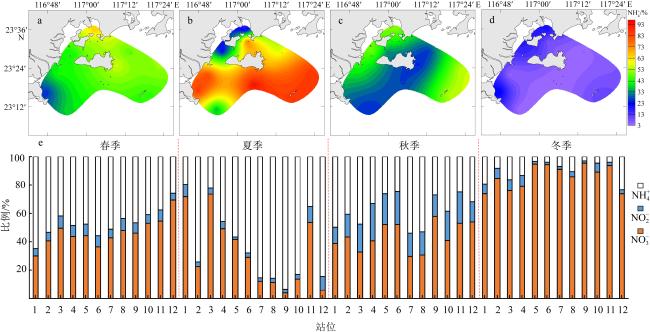
图4 南澳周边海域表层水体中硝态氮( )、亚硝氮( )和氨氮( )相对比例的季节变化a. 春季氨氮比例; b. 夏季氨氮比例; c. 秋季氨氮比例; d. 冬季氨氮比例; e. 各季节不同站位的DIN组成 Fig. 4 Seasonal variations of the percentages of nitrate ( ), nitrite ( ) and ammonia ( ) in the surface water around Nan’ao Island a. Spring ammonia nitrogen ratio; b. Summer ammonia nitrogen ratio; c. Autumn ammonia nitrogen ratio; d. Winter ammonia nitrogen ratio; e. DIN composition at different stations in different seasons |
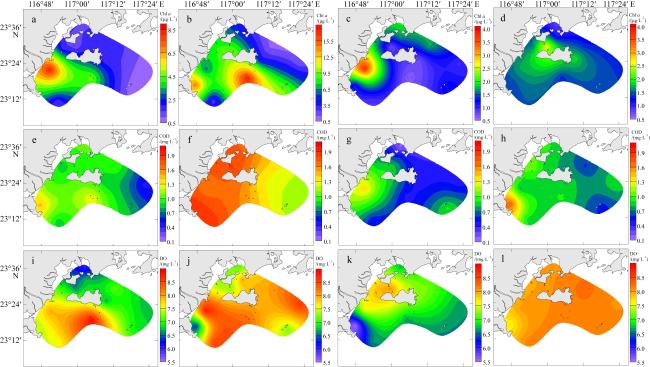
图6 南澳周边海域表层水体叶绿素a质量浓度(Chl a)(a—d)、化学需氧量(COD)(e—h)和溶解氧(DO)(i—l)的空间分布a, e, i: 春季; b, f, j: 夏季; c, g, k: 秋季; d, h, l: 冬季 Fig. 6 The spatial distribution of Chl a (a)—(d), COD (e)—(h) and DO (i)—( l) in the surface water around Nan’ao Island a, e, i: spring; b, f, j: summer; c, g, k: autumn; d, h, l: winter |
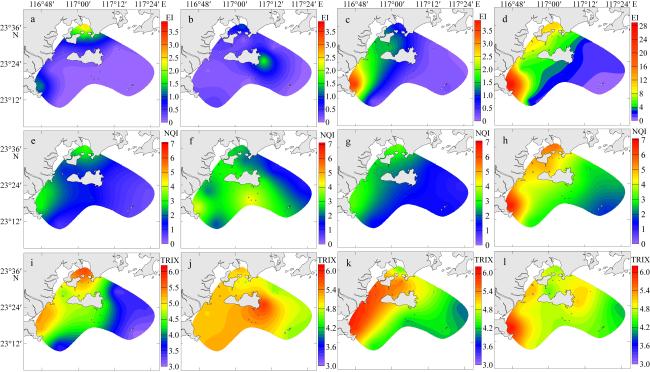
图7 南澳周边海域表层水体富营养化指数(EI)(a—d)、营养质量指数(NQI)(e—h)和营养状态指数(TRIX)(i—l)的分布特征a, e, i: 春季; b, f, j: 夏季; c, g, k: 秋季; d, h, l: 冬季 Fig. 7 The spatial distribution of eutrophication index (EI) (a)—(d), nutrient quality index (NQI) (e)—(h) and trophic index (TRIX) (i)—(l) in the surface water around Nan’ao island a, e, i: spring; b, f, j: summer; c, g, k: autumn; d, h, l: winter |
| [1] |
陈丹婷, 柯志新, 谭烨辉, 等, 2020. 汕头南澳—东山海域营养盐季节分布特征及其对浮游植物生长的潜在性限制[J]. 生态科学, 39(4): 41-50.
|
| [2] |
郭康丽, 龙超, 党二莎, 等, 2022. 珠海市近岸海域水质状况与富营养化评价[J]. 海洋环境科学, 41(2): 222-229.
|
| [3] |
国家环境保护局, 1997. 海水水质标准: GB 3097-1997[S/OL]. https://www.mee.gov.cn/ywgz/fgbz/bz/bzwb/shjbh/shjzlbz/199807/t19980701_66499.shtml, [2024-12-20].
NATIONAL ENVIRONMENTAL PROTECTION AGENCY, 1997. Sea water quality standard: GB 3097-1997[S/OL]. https://www.mee.gov.cn/ywgz/fgbz/bz/bzwb/shjbh/shjzlbz/199807/t19980701_66499.Shtml, [2024-12-20](in Chinese).
|
| [4] |
洪启明, 李立, 1991. 粤东陆架区夏季的上升流[J]. 台湾海峡, 10(3): 271-277.
|
| [5] |
柯志新, 陈丹婷, 谭烨辉, 等, 2019. 汕头南澳-东山海域初级生产力的时空特征[J]. 中国水产科学, 26(1): 44-52.
|
| [6] |
李妙聪, 刘文胜, 江锦花, 2021. 乐清湾海水养殖环境水质质量时空变化及富营养化状况评价[J]. 海洋环境科学, 40(5): 724-731.
|
| [7] |
李赛赛, 裴绍峰, 赵俐红, 等, 2024. 杭州湾及其邻近海域夏季营养盐污染与富营养化评价[J]. 海洋地质前沿, 40(6): 39-52.
|
| [8] |
林荣根, 1996. 海水富营养化水平评价方法浅析[J]. 海洋环境科学, 15(2): 28-31.
|
| [9] |
林温迪, 2023. 南澳岛旅游经济发展问题与对策研究[J]. 中国集体经济, (2): 133-136 (in Chinese).
|
| [10] |
林晓娟, 高姗, 仉天宇, 等, 2018. 海水富营养化评价方法的研究进展与应用现状[J]. 地球科学进展, 33(4): 373-384.
|
| [11] |
林小涛, 晏荣军, 黄长江, 2006. 粤东大规模养殖区柘林湾细菌的分布与环境因素关系[J]. 海洋学报, 28(3): 167-172.
|
| [12] |
刘陈, 魏南, 王庆, 等, 2019. 广东汕头南澳岛近岸海域浮游植物群落结构与环境特征[J]. 应用与环境生物学报, 25(5): 1091-1098.
|
| [13] |
柳原, 柯志新, 李开枝, 等, 2024. 人类活动和沿岸流影响下的粤东近海浮游动物群落特征[J]. 热带海洋学报, 43(4): 98-111.
|
| [14] |
南澳县人民政府, 2022. 汕头南澳: 北回归线上“蚝”丰收[EB/OL]. 南澳县人民政府门户网站, http://www.nanao.gov.cn/na/hddt/content/post_2126097.Html, [2024-5-7]
|
| [15] |
彭璇, 马胜伟, 陈海刚, 等, 2014. 夏季柘林湾-南澳岛海洋牧场营养盐的空间分布及其评价[J]. 南方水产科学, 10(6): 27-35.
|
| [16] |
舒业强, 王强, 俎婷婷, 2018. 南海北部陆架陆坡流系研究进展[J]. 中国科学: 地球科学, 48(3): 276-287.
|
| [17] |
王翠, 郭晓峰, 方婧, 等, 2018. 闽浙沿岸流扩展范围的季节特征及其对典型海湾的影响[J]. 应用海洋学学报, 37(1): 1-8.
|
| [18] |
王焕松, 雷坤, 李子成, 等, 2010. 辽东湾海域水体富营养化的模糊综合评价[J]. 环境科学研究, 23(4): 413-419.
|
| [19] |
吴鹏, 刘永, 肖雅元, 等, 2022. 春季珠江口万山群岛毗邻海域渔业生态环境状况评价[J]. 南方水产科学, 18(5): 1-8.
|
| [20] |
许金电, 蔡尚湛, 宣莉莉, 等, 2014. 粤东至闽南沿岸海域夏季上升流的调查研究[J]. 热带海洋学报, 33(2): 1-9.
|
| [21] |
杨红生, 茹小尚, 张立斌, 等, 2019. 海洋牧场与海上风电融合发展: 理念与展望[J]. 中国科学院院刊, 34(6): 700-707.
|
| [22] |
杨宇峰, 罗洪添, 王庆, 等, 2021. 大型海藻规模栽培是增加海洋碳汇和解决近海环境问题的有效途径[J]. 中国科学院院刊, 36(3): 259-269.
|
| [23] |
张彩云, 商少凌, 陈德文, 等, 2005. 冬季浙闽沿岸水分布的短期变动与风的关系初探[J]. 遥感学报, 9(4): 452-458.
|
| [24] |
中华人民共和国环境保护部, 2008. 近岸海域环境监测规范: HJ 442-2008[S/OL]. https://www.mee.gov.cn/ywgz/fgbz/bz/bzwb/jcffbz/200811/t20081111_131115.htm, [2024-12-20].
MINISTRY OF ENVIRONMENTAL PROTECTION OF THE PEOPLE’S REPUBLIC OF CHINA, 2008. Specification for offshore environmental monitoring:[S/OL]. https://www.mee.gov.cn/ywgz/fgbz/bz/bzwb/jcffbz/200811/t20081111_131115.htm, [2024-12-20](in Chinese).
|
| [25] |
周凯, 黄长江, 姜胜, 等, 2002. 2000-2001年柘林湾浮游植物群落结构及数量变动的周年调查[J]. 生态学报, 22(5): 688-698.
|
| [26] |
邹景忠, 董丽萍, 秦保平, 1983. 渤海湾富营养化和赤潮问题的初步探讨[J]. 海洋环境科学, 2(2): 41-54 (in Chinese).
|
| [27] |
|
| [28] |
|
| [29] |
|
| [30] |
|
| [31] |
|
| [32] |
|
| [33] |
|
| [34] |
|
| [35] |
|
| [36] |
|
| [37] |
|
| [38] |
|
| [39] |
|
| [40] |
|
| [41] |
|
| [42] |
|
| [43] |
|
| [44] |
|
| [45] |
|
| [46] |
|
/
| 〈 |
|
〉 |
