Marine Environmental Science

Distribution characteristics of dissolved carbohydrates and their influencing factors in the Maowei Sea, Qinzhou Bay, northern South China Sea

  • ZENG Debin , 1 ,
  • PENG Guangyu 2 ,
  • YANG Bin , 1, 3 ,
  • MO Xiaorong 1 ,
  • ZHOU Jiaodi 1, 4 ,
  • HUANG Haifang 1 ,
  • YAN Tingting 1
Expand
  • 1. Guangxi Key Laboratory of Marine Environmental Change and Disaster in Beibu Gulf, Beibu Gulf University, Qinzhou 535011, China
  • 2. School of Geography, Geomatics and Planning, Jiangsu Normal University, Xuzhou 221116, China
  • 3. Jiangsu Key Laboratory of Marine Biotechnology, Jiangsu Ocean University, Lianyungang 222005, China
  • 4. Guangxi Laboratory on the Study of Coral Reels in the South China Sea, Guangxi University, Nanning 530004, China
YANG Bin. email:

Copy editor: LIN Qiang

Received date: 2024-09-09

  Revised date: 2024-10-11

  Online published: 2024-10-16

Supported by

National Natural Science Foundation of China(42166002)

Natural Science Foundation of Jiangsu Province(BK20241962)

Guangxi Key Laboratory of Marine Environmental Change and Disaster in Beibu Gulf, Beibu Gulf University(2024KF01)

Scientific Research Capacity Building Project for Beibu Gulf Marine Ecological Environment Field Observation and Research Station of Guangxi(23-026-271)

Lianyungang Science and Technology Plan Program(JCYJ2313)

Abstract

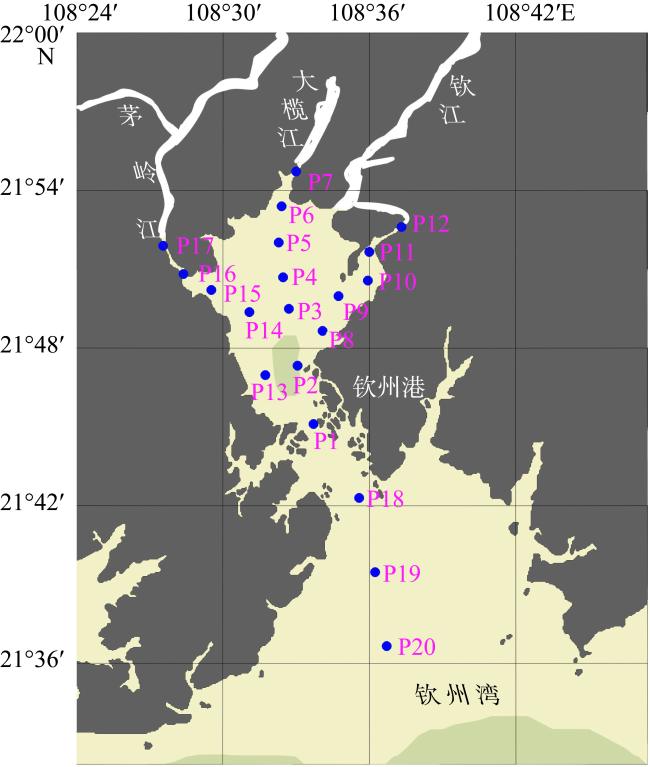
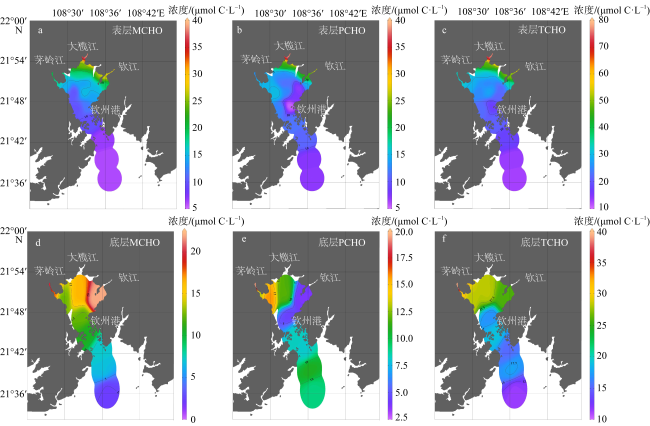
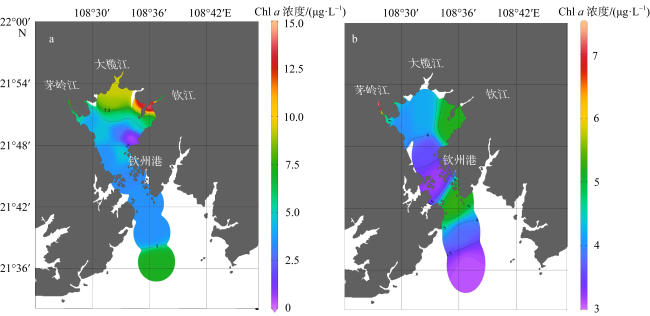
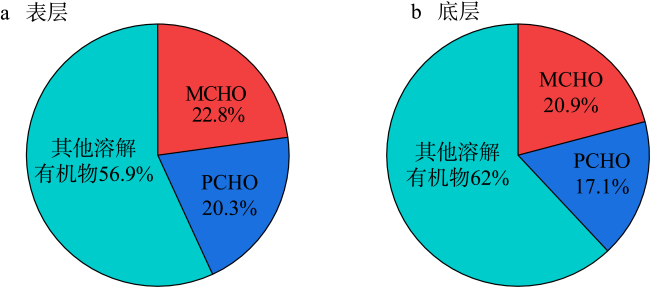
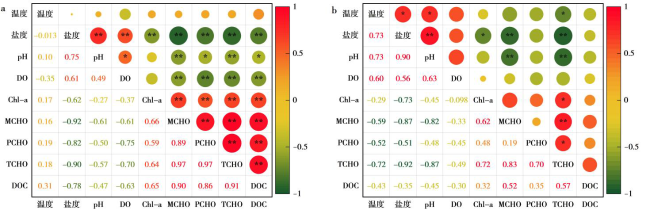
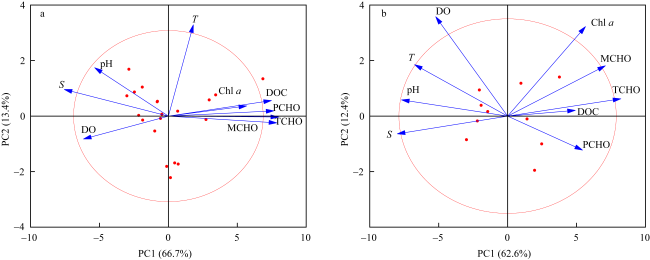
Using the 2, 4, 6-tripyridyl-s-triazine (TPTZ) method, the concentrations of dissolved monosaccharides (MCHO), polysaccharides (PCHO), and total carbohydrates (TCHO) were determined for the surface and bottom seawater of the Maowei Sea in December 2021, and their distribution characteristics and influencing factors were studied. The results showed that mean (range) concentrations of MCHO, PCHO and TCHO were 15.15 (2.40’38.40), 13.19 (3.92’38.40) and 28.34 (11.52’76.80) μmol C·L-1, respectively. The average proportion of TCHO in dissolved organic carbon (DOC) was (40.2±10.8)%, suggesting that TCHO was an important component of DOC. The average proportion of MCHO in TCHO was (52.9±12.2)%, indicating that MCHO was the main fraction of TCHO. The horizontal distributions of MCHO, PCHO, and TCHO in the surface and bottom seawater both displayed a decreasing trend from the estuary to offshore waters. In the surface seawater, the concentrations of MCHO, PCHO, and TCHO were much negatively correlated with salinity (P<0.01) but much positively correlated with chlorophyll a (Chl a). In the bottom seawater, the concentrations of MCHO and TCHO were much negatively correlated with salinity (P<0.01) and TCHO was much positively correlated with Chl a. These results suggested that terrestrial inputs and biogeochemical processes were important factors affecting the distribution of dissolved carbohydrates in the Maowei Sea during winter. The study will help to enrich the understanding of biogeochemical characteristics of dissolved carbohydrates in the Guangxi part of Beibu Gulf, which is of great significance to the in-depth understanding of global carbon cycle processes and their mechanisms.

Cite this article

ZENG Debin , PENG Guangyu , YANG Bin , MO Xiaorong , ZHOU Jiaodi , HUANG Haifang , YAN Tingting . Distribution characteristics of dissolved carbohydrates and their influencing factors in the Maowei Sea, Qinzhou Bay, northern South China Sea[J]. Journal of Tropical Oceanography, 2025 , 44(3) : 197 -205 . DOI: 10.11978/2024171

溶解有机碳(dissolved organic carbon, DOC)是海洋内部最大的有机碳库, 海洋DOC循环是全球碳循环的重要组成部分(郭威 等, 2016; Regnier et al, 2022)。DOC的结构与组成是海洋中微生物利用的主要控制因素(Shen et al, 2020), 其组成由复杂的微生物过程控制(Hu et al, 2022; 孙翠慈 等, 2023)。碳水化合物是海洋DOC的最重要组成部分, 在海洋生物地球化学循环中发挥着重要作用(He et al, 2015)。海洋环境中碳水化合物包括单糖(monosaccharides, MCHO)、多糖(polysaccharides, PCHO)和总糖(total carbohydrates, TCHO)(Youssef et al, 2014), 主要包括内源输入和外源输入两种来源。内源主要来自海洋浮游植物的光合作用和浮游生物的新陈代谢(Thornton, 2014)及微生物分解释放等(Giljan et al, 2022), 外源主要来自河流输入和人类活动排放(Regnier et al, 2022)及大气沉降和沉积物释放等(Marynowski et al, 2022)。碳水化合物的产生与去除过程是研究海洋碳循环的关键: 碳水化合物由海洋浮游植物光合作用直接产生, 被异养生物摄食参与食物网循环, 在浮游生物代谢过程中发挥着关键作用(Cai et al, 2023)。因此, 研究海洋碳水化合物的分布特征及影响因素将有助于深入了解生物群落生长与迁移过程的一些特殊规律, 这对于深入认识海洋中溶解有机物的性质、来源及其迁移转化过程等具有重要意义。
茅尾海位于广西钦州湾内湾, 是一个典型半封闭式亚热带养殖海湾, 拥有红树林、盐沼湿地典型海洋生态系统, 同时也是近江牡蛎全球种质资源保留地(黄慧倩 等, 2023)。近年来, 人类活动影响日益加剧, 大量营养盐通过陆源及贝类养殖输入海湾, 导致水体富营养化程度总体呈上升趋势, 并促进海区优势藻种大量繁殖, 具有较高的初级生产力(杨斌 等, 2015)。最新研究发现, 富营养化海湾在储碳方面具有举足轻重的作用, 微生物碳泵可将不稳定有机碳转化为稳定有机碳, 长期储存埋藏在近岸海湾(Jiao et al, 2020), 但有关亚热带富营养化养殖海湾溶解碳水化合物的分布及影响因素研究却鲜有报道。为此, 本文首次对广西茅尾海溶解碳水化合物的浓度分布特征进行研究, 结合水温、盐度、溶解氧、pH和叶绿素a等环境因子, 探讨影响溶解碳水化合物分布的因素及来源转化过程, 以期进一步丰富全球近海碳水化合物研究的相关数据, 为深入研究亚热带富营养化养殖海湾碳水化合物的生物地球化学过程奠定基础。

1 材料与方法

1.1 样品采集

茅尾海位于我国广西南部沿海(图1a), 是与北部湾相连的内湾。于2021年12月(冬季)对茅尾海进行现场调查, 沿着茅岭江、钦江和大榄江冲淡水盐度梯度布设3 断面共20个采样站位(图1b), 并在大潮期涨潮时进行样品采集和水文观测。水深<5m取表层水样(0.5m以下), 水深≥5m取表、底层水样。使用有机玻璃采水器进行水样采集, 并将采集的海水样品通过GF/F滤膜(Whatman, 450℃灼烧4h)低压过滤, 过滤后的滤膜用锡纸包好, -20℃下冷冻保存待测叶绿素a (chlorophyll a, Chl a)。滤液用2个40mL棕色玻璃瓶(500℃灼烧4h)分装, -20℃下冷冻保存, 分别用于DOC和溶解碳水化合物测定。水温(temperature, T)、盐度(salinity, S)、溶解氧(dissolved oxygen, DO)、pH等水质参数利用多参数水质分析仪(Aquaread Co, UK)现场测定。
图1 茅尾海采样站位图

Fig. 1 Sampling stations of the Maowei Sea

1.2 分析方法

溶解碳水化合物用TPTZ (2, 4, 6 三吡啶-s-三嗪, C18H12N6 )法测定(Myklestad et al, 1997)。具体测定步骤: 取1mL海水样品于比色管中, 加入lmL碱性K3Fe(CN)6 (0.7mmol·L-1)在100℃加热10min后, 加入1mL FeCl3 (2.0mmol·L-1)和2mL TPTZ (2.5mmol·L-1)混合均匀, 15min后596nm测量吸光度, 由标准曲线得到MCHO浓度。5mL安瓿瓶, 加入4mL海水样品和0.4mL HCl (1mol·L-1), 密封后110℃水解20h, 冷却后加入0.4mL NaOH (lmol·L-1)中和, 按照MCHO方法测定获得TCHO浓度。PCHO浓度由TCHO与MCHO浓度差值得到。平行样测定的相对标准偏差< 2%。
Chl a通过荧光分光光度法测定(Parsons et al, 1984)。将滤膜置于15mL离心管中, 加入10mL 90%(V:V)的丙酮溶液, 4°C避光条件下萃取24h, 4000r·min-1离心10min, 激发波长436nm、发射波长670nm下测定其上清液吸光度, 由标准曲线计算Chl a浓度, 该方法检测限为0.01μg·L-1
DOC采用高温催化氧化法(Sharp et al, 1995), 使用总有机碳分析仪(岛津TOC-VCPH)进行测定。Milli-Q水校准仪器空白, 2M HCl酸化海水样品, 用高纯O2除去酸化后的CO2, 样品用玻璃注射器注射入高温燃烧管中(使用0.5%Pt-Al2O3作为催化剂), 工作温度680℃, 进样量50μL。有机碳在高温下被催化氧化, 用非色散红外气体分析仪测定氧化产物CO2峰面积, 通过峰面积求得DOC浓度。单项测定结果对平均值偏离程度< 2%, 检测限为0.05mg C·L-1

1.3 数据统计分析

本文采用Origin Pro2022 (OriginLab Corporation, Northampton, MA, USA)进行数据分析和拟合, 采用 ODV5.5.2 (Schlitzer, Reiner, Ocean Data View, odv.awi.de, 2022)软件进行空间分布图的绘制处理, 采用IBM SPSS 22.0 (IBMCorp., Armonk, N.Y., USA)软件中的数据处理方法对碳水化合物与水质参数进行相关性分析。描述性统计数值采用(平均值±标准偏差)(mean±SD)表示。

2 结果与讨论

2.1 溶解碳水化合物分布特征

茅尾海表、底层溶解碳水化合物的浓度如表1所示。表层水体中TCHO占DOC浓度比例为24.4%~64.4%, 均值为(41.5±10.4)%; 底层TCHO占DOC浓度比例为21.6%~60.1%, 均值为(37.6±11.8)%。碳水化合物是海洋中有机物质的主要组成部分, 分别占大洋表层和深层海水中DOC的6.5%~
24%和15%~21%, 在海洋碳循环过程中发挥着举足轻重的作用 (张正斌, 2004)。TCHO占DOC比例均> 20%, 表明在该海域水体中TCHO是DOC的重要组成部分。表、底层水体中MCHO浓度呈现较大的不规则变化, 浓度为2.40~38.40μmol C·L-1, MCHO在TCHO中的占比[表层(52.8±8.7)%, 底层(53.1±17.9)%]均高于PCHO [表层(47.2±8.7)%, 底层(46.9±17.9)%], 表明茅尾海MCHO是TCHO的主要组成。研究表明, 淡水河流中MCHO占TCHO的80%~90%(Hung et al, 2005), 海水大洋中PCHO占TCHO的50%~80%(Wang et al, 2006)。茅尾海周边有钦江、茅岭江和大榄江主要河流入海, 在低盐度入海河口区MCHO占比较高, 且该海湾具有较高的初级生产力(杨斌 等, 2015), 高盐度外海区PCHO占比较高, 这与长江口及胶州湾的观测结果相一致(Yang et al, 2010; Song et al, 2017), 表明茅尾海与这些区域受陆地径流输入和海洋初级生产力影响较大, 导致碳水化合物浓度较高。
表 1 茅尾海表、底层水体中MCHO、PCHO和TCHO浓度(μmol C·L-1)及 MCHO、PCHO在TCHO占比

Tab. 1 Concentrations of MCHO, PCHO and TCHO (μmol C·L-1) and percentages of MCHO and PCHO in TCHO in surface and bottom waters of the Maowei Sea

项目 表层浓度/(μmol C·L-1) 底层浓度/(μmol C·L-1)
范围 平均值 范围 平均值
MCHO 6.00~38.40 16.30±8.22 2.40~22.00 12.84±6.29
PCHO 5.28~38.40 14.52±7.95 3.92~19.84 10.54±4.90
TCHO 12.96~76.80 30.82±15.71 11.52~39.84 23.38±8.68
MCHO/TCHO 38.3%~69.4% (52.9±8.7)% 20.8%~84.9% (53.1±17.9)%
PCHO/TCHO 30.6%~61.7% (47.1±8.7)% 34.0%~79.2% (46.9±17.9)%
茅尾海表、底层水体中MCHO、PCHO和TCHO的浓度分布趋势一致, 总体呈现由河口向外海逐渐递减的变化趋势, 垂直方向上呈现表层高、底层低的特征(图2)。表层TCHO浓度由河口的76.80μmol C·L-1下降至外海的12.96μmol C·L-1, 降幅较为明显, 表明该河口区水体中溶解碳水化合物主要受陆地径流冲淡水的影响。一方面可能是由于钦州湾内湾(茅尾海)作为一个半封闭式海湾, 与钦州湾外湾的物质交换能力较弱, 受到人为活动影响较大(陈振华 等, 2017); 另一方面, 陆源DOC中含有大量植物凋落和土壤释放的碳水化合物(Hedges et al, 1994), 钦江、茅岭江和大榄江等入海河流可将其携带入海(Benner, 2003), 进而在河口区出现高值, 外海由于较强水动力作用使得陆源碳水化合物得以有效清除(Wagner et al, 2020)。
图2 茅尾海表、底层水体中MCHO(a、d)、PCHO(b、e)和TCHO(c、f)浓度(μmol C·L-1)分布

Fig. 2 Distribution of MCHO (a, d), PCHO (b, e) and TCHO (c, f) concentrations (μmol C·L-1) in surface and bottom water layers of the Maowei Sea

2.2 不同海区溶解碳水化合物浓度对比

与国内外其他海区相比, 茅尾海表层溶解碳水化合物浓度高于孟加拉湾(Bhosle et al, 1998)、墨西哥湾(Lin et al, 2015)、北冰洋(Wang et al, 2006)、南海(龚词 等, 2017)、东海(胡春 等, 2019)和雅浦海沟(Guo et al, 2020)等开阔海区, 低于加尔维斯顿湾(Hung et al, 2001)、特里尼蒂河(Hung et al, 2005)、胶州湾(Yang et al, 2010)和珠江口(He et al, 2010)等河口近岸海区(表2)。钦江、茅岭江和大榄江等主要入海河流向茅尾海输送大量的营养物质, 使该海湾处于富营养化状态, 并对浮游植物的生长繁殖起到促进作用(杨斌 等, 2020)。富营养化海湾拥有较高的初级生产力, 使得碳水化合物的释放相比其他贫营养海区要高(Yang et al, 2010), 同时由于河口和大陆架的有效清除, 河流输送的DOC难以到达开阔大洋(Wagner et al, 2020)。陆源输入和浮游植物释放共同导致近岸海区碳水化合物浓度偏高(Wang et al, 2010; 龚词 等, 2017), 进而使得近海浓度高于贫营养的开阔海域(Hung et al, 2001; Song et al, 2017)。由此可见, 茅尾海较高的陆地径流输入和初级生产力是导致碳水化合物的浓度高于开阔陆架边缘海和大洋区域的重要原因, 但低于受人类活动影响更为剧烈且营养物质输送更为丰富的河口近岸海区。
表2 不同河口海区MCHO、PCHO和TCHO的浓度对比

Tab. 2 Comparison of concentrations of MCHO, PCHO and TCHO in different estuaries and sea areas

区域 调查时间 MCHO浓度/(μmol C·L-1) PCHO浓度/(μmol C·L-1) TCHO浓度/(μmol C·L-1) 参考文献
雅浦海沟 2016 4.60~22.10 3.50~27.30 13.80~36.30 Guo et al, 2020
东海 2017 1.94~6.23 1.46~9.85 4.73~15.21 胡春 等, 2019
东海 2012 3.30~13.00 1.30~24.80 10.20~35.80 He et al, 2015
南海 2015 0.22~13.66 1.51~21.02 2.63~26.24 龚词 等, 2017
北冰洋 2002 0.40~8.60 0.50~13.60 1.3~18.90 Wang et al, 2006
墨西哥湾 2010 4.00~27.00 5.00~76.00 15.00~103.00 Lin et al, 2015
孟加拉湾 1995—1996 2.40~15.60 17~36.60 27.00~47.40 Bhosle et al, 1998
加尔维斯顿湾 1999 13.30~62.10 10.2~41.90 23.00~96.70 Hung et al, 2001
特里尼蒂河 2000—2001 27.00~112.00 3.70~16.30 35.60~155.40 Hung et al, 2005
胶州湾 2007—2008 2.90~65.90 0.30~210.20 10.80~276.10 Yang et al, 2010
珠江口 2007 7.70~70.00 3.60~63.00 15.00~133.00 He et al, 2010
茅尾海 2021 6.00~38.40 5.28~38.40 12.96~72.80 本研究

2.3 茅尾海溶解碳水化合物的来源与去除

海洋碳水化合物的来源包括海水中的微生物活动、陆源输入(Yang et al, 2010)、海气交换(Zeppenfeld et al, 2020)、沉积物孔隙水释放(He et al, 2015)等。茅尾海表、底层水体中TCHO与盐度呈显著的负相关关系(P<0.05), 随盐度的增加而降低(图3), 且呈现由河口向外海逐渐递减的趋势(图2cf), 表明陆地径流输入是茅尾海TCHO的一个重要来源。此外, 茅尾海具有较高初级生产力(杨斌 等, 2015), Chl a和溶解碳水化合物具有相似的分布特征(图24), 且Chl a在表层与MCHO、PCHO和TCHO均呈极显著正相关(P<0.01), 在底层与TCHO存在显著正相关(P<0.05), 表明浮游植物自生产也是溶解碳水化合物的重要来源(Thornton, 2014)。TCHO/DOC比值通常作为评估DOM降解状态的指标, 高TCHO/DOC比值表示新生成的有机质, 低TCHO/DOC比值表示高降解的DOM(Lin et al, 2015; Song et al, 2017; Wagner et al, 2020)。钦江、茅岭江、大榄江入海河口区表层水体TCHO/DOC分别为(51.9±3.0)%、(50.5±1.1)%和(48.0±15.2)%, 均高于茅尾海高盐度的外海表层TCHO/DOC比值(28.2±3.3)%, 表明高盐度外海区域具有较高的生物降解速率, 这可能与浮游真菌在碳水化合物降解过程中发挥重要作用有关(Baltar et al, 2021)。茅尾海表、底层水体中DOC和TCHO/DOC比值与盐度呈显著负相关(P<0.05), 表明咸淡水物理混合存在DOC和TCHO的去除过程(Zhu et al, 2017), 同时表现出DOC和TCHO的分布和传输受多种因素的影响存在非保守行为, 且TCHO被优先去除(Wang et al, 2010)。
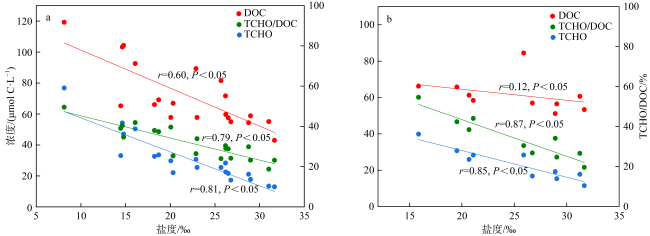
图3 茅尾海表层(a)和底层(b)水体中TCHO、DOC和TCHO/DOC与盐度相关性分析

Fig. 3 Correlation analysis of TCHO, DOC and TCHO/DOC with salinity in surface (a) and bottom (b) water layers of the Maowei Sea

图4 茅尾海表层(a)和底层(b)水体中Chl a浓度(μg·L-1)浓度分布

Fig. 4 Distribution of Chl a concentrations (μg·L-1) in surface (a) and bottom (b) water layers of the Maowei Sea

茅尾海表层水体中MCHO、PCHO和其他溶解有机物(DOC-TCHO)平均浓度分别占DOC的22.8%、20.3%和56.9%(图5a), 底层分别占DOC的20.9%、17.1%和62.0%(图5b), 表明茅尾海表、底层水体DOC均以其他溶解有机物为主。MCHO和PCHO占DOC比例由表层至底层分别下降1.9%和3.2%, 表明溶解碳水化合物是DOC中的活性组分, 在海水循环过程中优先去除(Wang et al, 2010), 且PCHO具有较高去除效率, 更易被异养细菌利用(Giljan et al, 2022)。
图5 茅尾海表层(a)和底层(b)水体中MCHO、PCHO和其他溶解有机物(DOC-TCHO)占DOC比例

Fig. 5 Ratios of MCHO, PCHO, and other dissolved organic matter (DOC-TCHO) to DOC in surface (a) and bottom (b) water layers of the Maowei Sea

2.4 溶解碳水化合物分布的影响因素

图6为茅尾海表层和底层水体中溶解碳水化合物与水质参数相关性分析结果, 可见表层盐度与MCHO、PCHO和TCHO之间呈极显著负相关(P<0.01), 底层盐度与MCHO和TCHO之间呈极显著负相关(P<0.01), 表明茅尾海碳水化合物的浓度分布主要受陆地径流输入的影响。陆地植物含有比海洋更丰富的碳水化合物(Becker et al, 2020), 河流会不断将陆地植物产生和土壤释放的碳水化合物输送至海洋中(Hung et al, 2005; Wang et al, 2006; Zhu et al, 2017), 外海水交换物理混合过程会将陆源输入的DOC浓度稀释, 导致碳水化合物浓度由河口向外海逐渐递减。表层Chl a与MCHO、PCHO和TCHO呈极显著正相关(P<0.01), 底层Chl a与TCHO呈显著正相关(P<0.05), 表明浮游植物生物量是影响茅尾海表、底层碳水化合物浓度分布的重要因素(Thornton, 2014)。研究表明, 陆源淡水与外海盐水的混合会加速碳水化合物的去除过程, 外源碳水化合物比内源更不稳定(Cai et al, 2023), 更易受到光照的影响, 陆源输入的DOC具有更高的光反应活性, 对浮游植物生产活动具有促进作用(Zhu et al, 2017)。底层Chl a与MCHO和PCHO无显著相关性(P>0.05), 结合PCHO和MCHO浓度由表层至底层均呈现下降趋势(表1), 表明表层至底层水体存在碳水化合物的消耗, 表层多为生产过程, 底层以降解过程为主, 例如微生物活动(Hu et al, 2022)和细菌水解(Giljan et al, 2022)。表、底层pH与MCHO和TCHO均呈极显著负相关(P<0.01), 且表层pH与PCHO呈显著负相关(P<0.05), 表明海水酸化对碳水化合物的分布也产生影响, 酸化会提高初级生产和呼吸速率(Wagner et al, 2020), 茅尾海pH与碳水化合物呈极显著负相关, 表明pH对初级生产起促进作用。表层DOC与MCHO、PCHO和TCHO均呈极显著正相关(P<0.01), TCHO在DOC平均占比为41.5%(±10.4)%, 表明碳水化合物是DOC的重要组成部分, 且与DOC具有相似的来源(He et al, 2015)。
图6 茅尾海表层(a)和底层(b)水体中溶解碳水化合物与水质参数相关性分析

*表示P<0.05; **表示P<0.01

Fig. 6 Correlation analysis of dissolved carbohydrates with water quality parameters in surface (a) and bottom (b) water layers of the Maowei Sea

根据温度(T)、盐度(S)、pH、DO、Chl a、MCHO、PCHO、TCHO和DOC之间的因子分析, 基于主成分组分特征值, 对茅尾海表、底层水体中碳水化合物与环境因子提取前2个因子总方差贡献率分别为80.1%和75.0%(图7), 可代表茅尾海表、底层水体中绝大部分的信息。根据因子分析结果, 盐度、pH、Chl a、MCHO、PCHO 、TCHO和DOC在表、底层均由主成分1(PC1)解释, PC1表层和底层分别解释了数据中66.7%和62.6%的变异性。PC1表、底层MCHO、PCHO和TCHO均与盐度、pH负载荷显著相关, 表明陆源输入及咸淡水混合过程是其浓度分布的主要控制因素(Song et al, 2017), 与Chl a正载荷显著相关, 表明浮游植物活动对溶解碳水化合物分布也产生重要作用(Alyuruk et al, 2018)。温度和DO分别在表、底层由主成分2(PC2)解释, PC2表层和底层分别解释了数据中13.4%和12.4%的变异性。研究表明, 海水中溶解碳水化合物除了受陆源输入、物理混合和浮游植物自生产外, 还存在其他因素的影响(Wang et al, 2006; Guo et al, 2020)。例如, 浮游真菌对PCHO的降解作用(Baltar et al, 2021)和异养细菌对PCHO的利用(Giljan et al, 2022)。底层PCHO与DO负载荷显著相关, 表明底层存在微生物降解或细菌水解PCHO进而消耗水体中的氧。由此可见, 茅尾海溶解碳水化合物主要受陆源输入和物理混合过程等因素的影响。此外, 浮游植物和微生物活动也是影响海水中溶解碳水化合物的重要因素。
图7 茅尾海表层(a)和底层(b)水体中碳水化合物与环境因子主成分分析

Fig. 7 Principal component analysis of carbohydrates and environmental factors in surface (a) and bottom (b) water layers of the Maowei Sea

3 结论

1) 冬季茅尾海表、底层水体TCHO占DOC浓度平均比例分别为(41.5±10.4)%和(37.6±11.8)%, 表明该海域水体中TCHO是DOC的重要组成部分。表、底层溶解碳水化合物浓度均由河口向外海逐渐递减, 呈现表层高、底层低的特征。
2) 陆地径流输入和浮游植物自生产是冬季茅尾海溶解碳水化合物的重要来源, DOC、TCHO和TCHO/DOC比值与盐度呈显著负相关, 表明物理混合过程存在DOC和TCHO的去除过程, 且TCHO被优先去除。
3) 陆源输入和物理混合是控制冬季茅尾海溶解碳水化合物浓度分布的主要因素。此外, 浮游植物和微生物活动也是影响冬季茅尾海溶解碳水化合物的重要因素。
[1]
陈振华, 夏长水, 乔方利, 2017. 钦州湾水交换能力数值模拟研究[J]. 海洋学报, 39(3): 14-23.

CHEN ZHENHUA, XIA CHANGSHUI, QIAO FANGLI, 2017. Numerical simulation of water exchange in the Qinzhou Bay of China[J]. Haiyang Xuebao, 39(3): 14-23 (in Chinese with English abstract).

[2]
龚词, 杨桂朋, 2017. 夏季南海北部溶解碳水化合物浓度分布[J]. 海洋环境科学, 36(3): 321-327.

GONG CI, YANG GUIPENG, 2017. Distributions of dissolved carbohydrates in the northern South China Sea during summer[J]. Marine Environmental Science, 36(3): 321-327 (in Chinese with English abstract).

[3]
郭威, 叶丰, 连忠廉, 等, 2016. 珠江口水体有机碳的季节性变化[J]. 热带海洋学报, 35(4): 40-50.

DOI

GUO WEI, YE FENG, LIAN ZHONGLIAN, et al, 2016. Seasonal changes of organic carbon in the Pearl River estuary[J]. Journal of Tropical Oceanography, 35(4): 40-50 (in Chinese with English abstract).

DOI

[4]
胡春, 陈岩, 杨桂朋, 等, 2019. 2017年春季黄东海碳水化合物的分布特征[J]. 海洋环境科学, 38(6): 848-855.

HU CHUN, CHEN YAN, YANG GUIPENG, et al, 2019. Study on the distribution of dissolved carbohydrates in the South Yellow Sea and the East China Sea during spring[J]. Marine Environmental Science, 38(6): 848-855 (in Chinese with English abstract).

[5]
黄慧倩, 胡浩鹏, 杨斌, 等, 2023. 亚热带海湾表层沉积物对磷的吸附解析特征研究[J]. 环境科学研究, 36(2): 363-372.

HUANG HUIQIAN, HU HAOPENG, YANG BIN, et al, 2023. Phosphate adsorption and desorption characteristics of surface sediments of subtropical bay[J]. Research of Environmental Sciences, 36(2): 363-372 (in Chinese with English abstract).

[6]
孙翠慈, 岳维忠, 赵文杰, 等, 2023. 大亚湾表层沉积物碳水化合物活性酶基因分布特征[J]. 热带海洋学报, 42(5): 76-91.

SUN CUICI, YUE WEIZHONG, ZHAO WENJIE, et al, 2023. Distribution of the microbial carbohydrate-active enzymes genes in the surface sediment of the Daya Bay, China[J]. Journal of Tropical Oceanography, 42(5): 76-91 (in Chinese with English abstract).

[7]
杨斌, 钟秋平, 张晨晓, 等, 2015. 钦州湾叶绿素a和初级生产力时空变化及其影响因素[J]. 环境科学学报, 35(5): 1333-1340.

YANG BIN, ZHONG QIUPING, ZHANG CHENXIAO, et al, 2015. Spatio-temporal variations of chlorophyll a and primary productivity and its influence factors in Qinzhou Bay[J]. Acta Scientiae Circumstantiae, 35(5): 1333-1340 (in Chinese with English abstract).

[8]
杨斌, 牛贝贝, 鲁栋梁, 等, 2020. 夏季茅尾海主要入海河口区尿素的水平分布及影响因素[J]. 应用海洋学学报, 39(2): 239-245.

YANG BIN, NIU BEIBEI, LU DONGLIANG, et al, 2020. Distribution of urea and its influencing factors in major estuaries of Maowei Sea in summer[J]. Journal of Applied Oceanography, 39(2): 239-245 (in Chinese with English abstract).

[9]
张正斌, 2004. 海洋化学[M]. 青岛: 中国海洋大学出版社 (in Chinese).

[10]
ALYURUK H, KONTAS A, 2018. Seasonal variations and distributions of dissolved free and total carbohydrates at the İzmir Bay, Aegean Sea[J]. Acta Oceanologica Sinica, 37(8): 6-14.

[11]
BALTAR F, ZHAO ZIHAO, HERNDL G J, 2021. Potential and expression of carbohydrate utilization by marine fungi in the global ocean[J]. Microbiome, 9(1): 106.

DOI PMID

[12]
BECKER S, TEBBEN J, COFFINET S, et al, 2020. Laminarin is a major molecule in the marine carbon cycle[J]. Proceedings of the National Academy of Sciences of the United States of America, 117(12): 6599-6607.

DOI PMID

[13]
BENNER R, 2003. 5-molecular indicators of the bioavailability of dissolved organic matter[M]// FINDLAY S E G, SINSABAUGHR L, Aquatic Ecosystems: Interactivity of Dissolved Organic Matter. San Diego: Academic Press: 121-137.

[14]
BHOSLE N B, BHASKAR P V, RAMACHANDRAN S, 1998. Abundance of dissolved polysaccharides in the oxygen minimum layer of the Northern Indian Ocean[J]. Marine Chemistry, 63(1-2): 171-182.

[15]
CAI RUANHONG, JIAO NIANZHI, 2023. Recalcitrant dissolved organic matter and its major production and removal processes in the ocean[J]. Deep Sea Research Part I: Oceanographic Research Papers, 191: 103922.

[16]
GILJAN G, ARNOSTI C, KIRSTEIN I V, et al, 2022. Strong seasonal differences of bacterial polysaccharide utilization in the North Sea over an annual cycle[J]. Environmental Microbiology, 24(5): 2333-2347.

DOI PMID

[17]
GUO CHAONAN, SUN CHENGJUN, YANG GUIPENG, et al, 2020. Vertical variations of dissolved carbohydrates in the North Yap Trench[J]. Journal of Oceanology and Limnology, 38(3): 606-618.

[18]
HE BIYAN, DAI MINHAN, ZHAI WEIDONG, et al, 2010. Distribution, degradation and dynamics of dissolved organic carbon and its major compound classes in the Pearl River estuary, China[J]. Marine Chemistry, 119(1-4): 52-64.

[19]
HE ZHEN, WANG QI, YANG GUIPENG, et al, 2015. Spatiotemporal variation characteristics and related affecting factors of dissolved carbohydrates in the East China Sea[J]. Continental Shelf Research, 108: 12-24.

[20]
HEDGES J I, COWIE G L, RICHEY J E, et al, 1994. Origins and processing of organic matter in the Amazon River as indicated by carbohydrates and amino acids[J]. Limnology and Oceanography, 39(4): 743-761.

[21]
HU ANG, CHOI M, TANENTZAP A J, et al, 2022. Ecological networks of dissolved organic matter and microorganisms under global change[J]. Nature Communications, 13(1): 3600.

DOI PMID

[22]
HUNG C C, TANG D G, WARNKEN K W, et al, 2001. Distributions of carbohydrates, including uronic acids, in estuarine waters of Galveston Bay[J]. Marine Chemistry, 73(3-4): 305-318.

[23]
HUNG C C, WARNKEN K W, SANTSCHI P H, 2005. A seasonal survey of carbohydrates and uronic acids in the Trinity River, Texas[J]. Organic Geochemistry, 36(3): 463-474.

[24]
JIAO NIANZHI, LIU JIHUA, JIAO FANGLUE, et al, 2020. Microbes mediated comprehensive carbon sequestration for negative emissions in the ocean[J]. National Science Review, 7(12): 1858-1860.

DOI PMID

[25]
LIN PENG, GUO LAODONG, 2015. Spatial and vertical variability of dissolved carbohydrate species in the northern Gulf of Mexico following the Deepwater Horizon oil spill, 2010-2011[J]. Marine Chemistry, 174: 13-25.

[26]
MARYNOWSKI L, SIMONEIT B R T, 2022. Saccharides in atmospheric particulate and sedimentary organic matter: status overview and future perspectives[J]. Chemosphere, 288: 132376.

[27]
MYKLESTAD S M, SKÅNØY E, HESTMANN S, 1997. A sensitive and rapid method for analysis of dissolved mono- and polysaccharides in seawater[J]. Marine Chemistry, 56(3-4): 279-286.

[28]
PARSONS T R, MAITA Y, LALLI C M, 1984. A manual of chemical and biological methods for seawater analysis[M]. Oxford: Pergamon Press.

[29]
REGNIER P, RESPLANDY L, NAJJAR R G, et al, 2022. The land-to-ocean loops of the global carbon cycle[J]. Nature, 603(7901): 401-410.

[30]
SHARP J H, BENNER R, BENNETT L, et al, 1995. Analyses of dissolved organic carbon in seawater: the JGOFS EqPac methods comparison[J]. Marine Chemistry, 48(2): 91-108.

[31]
SHEN YUAN, BENNER R, 2020. Molecular properties are a primary control on the microbial utilization of dissolved organic matter in the ocean[J]. Limnology and Oceanography, 65(5): 1061-1071.

[32]
SONG SHUZHEN, GAO LEI, LI DAOJI, et al, 2017. Distributions and dynamics of dissolved carbohydrate species in Changjiang Estuary and the adjacent East China Sea[J]. Marine Chemistry, 194: 22-32.

[33]
THORNTON D C O, 2014. Dissolved organic matter (DOM) release by phytoplankton in the contemporary and future ocean[J]. European Journal of Phycology, 49(1): 20-46.

[34]
WAGNER S, SCHUBOTZ F, KAISER K, et al, 2020. Soothsaying DOM: a current perspective on the future of oceanic dissolved organic carbon[J]. Frontiers in Marine Science, 7: 341.

[35]
WANG DELI, HENRICHS S M, GUO LAODONG, 2006. Distributions of nutrients, dissolved organic carbon and carbohydrates in the western Arctic Ocean[J]. Continental Shelf Research, 26(14): 1654-1667.

[36]
WANG XURI, CAI YIHUA, GUO LAODONG, 2010. Preferential removal of dissolved carbohydrates during estuarine mixing in the Bay of Saint Louis in the northern Gulf of Mexico[J]. Marine Chemistry, 119(1-4): 130-138.

[37]
YANG GUIPENG, ZHANG YANPING, LU XIAOLAN, et al, 2010. Distributions and seasonal variations of dissolved carbohydrates in the Jiaozhou Bay, China[J]. Estuarine, Coastal and Shelf Science, 88(1): 12-20.

[38]
YOUSSEF D H, EL-SAID G F, SHOBIER A H, 2014. Distribution of total carbohydrates in surface sediments of the Egyptian Mediterranean coast, in relation to some inorganic factors[J]. Arabian Journal of Chemistry, 7(5): 823-832.

[39]
ZEPPENFELD S, VAN PINXTEREN M, ENGEL A, et al, 2020. A protocol for quantifying mono- and polysaccharides in seawater and related saline matrices by electro-dialysis (ED)-combined with HPAEC-PAD[J]. Ocean Science, 16(4): 817-830.

[40]
ZHU WENZHUO, YANG GUIPENG, ZHANG HONGHAI, 2017. Photochemical behavior of dissolved and colloidal organic matter in estuarine and oceanic waters[J]. Science of The Total Environment, 607-608: 214-224.

Outlines

/