
Journal of Tropical Oceanography >
Wave distribution characteristics of Xuande Atoll, Xisha Islands*
Received date: 2024-12-25
Revised date: 2025-03-10
Online published: 2025-03-13
Supported by
Research project surplus funds of Hainan Academy of Marine and Fishery Sciences(JYJF20231226)
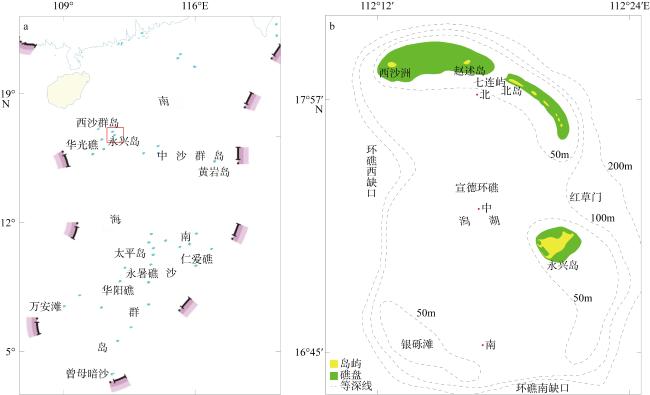
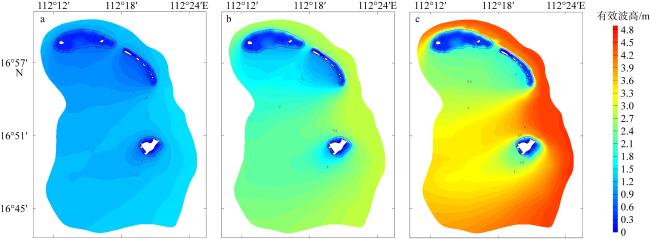
This study aims to develop a mathematical model capable of accurately simulating waves in the island and reef areas, with the objective of investigating the wave climate and its changing trends in the Xuande Atoll. The third-generation numerical wave model SWAN (simulating waves nearshore) was employed. Grid refinement was carried out to the Xisha islands and reef areas, incorporating measured terrain data in some regions. The ERA5 reanalysis wind-field data (the fifth generation ECMWF atmospheric reanalysis of the global climate) from 1999 to 2023 was utilized as the driving force for wave simulations. Model performance was validated using measured data from the Xisha and Zhongsha Islands, with statistical metrics indicating its accuracy in simulating significant wave height. Analysis of the 25-year model results revealed distinct spatial and temporal patterns. Spatially, waves in the Xuande Atoll exhibited stronger intensities in the northeast and weaker intensities in the southwest, propagating generally from the northeast to the southwest. Due to the obstruction of the reef flat, a prominent wave-shadow zone was formed in the southwest. Temporally, wave intensity was the highest in December and the lowest in May, showing a gradual decrease from December to May and a subsequent increase from May to December. Quantitatively, the average significant wave height showed a slight decreasing trend (0 ~ 0.2 cm·a-1) in most of the atoll, while it increased slightly (0 ~ 0.2 cm·a-1) in some parts of the reef flat. The 99th percentile significant wave height increased in most areas (0 ~ 0.7 cm·a-1) but decreased slightly in some reef flat areas (0 ~ 0.4 cm·a-1), indicating a rising impact of extreme weather events like typhoons on the atoll. Monthly analysis showed that the average significant wave height exhibited an upward trend in six months and a downward trend in the other six. The maximum upward trend occurred in October (≤ 0.8 cm·a-1), while the maximum downward trend was observed in November (≤1.7 cm·a-1). The 90th percentile significant wave height decreased slightly in February and August, coinciding with the transition between the northeast monsoon and the southwest monsoon. Compared with the average significant wave height, the 99th percentile showed opposite trends in August and September, reflecting year-by-year variations in typhoon impacts. The Mann-Kendall (MK) test indicated relatively high significance levels for trends in some regions. The conclusions have a certain degree of reliability and hold great reference value for the future development and construction of island and reef areas, such as the Xuande Atoll.
Key words: simulation wave nearshore; islands and reefs; waves; wave climate; Xuande atoll
QIU Liguo , LIANG Xiaoli , CHEN Bin , WANG Shengjian , WANG Fayun . Wave distribution characteristics of Xuande Atoll, Xisha Islands*[J]. Journal of Tropical Oceanography, 2025 , 44(5) : 50 -64 . DOI: 10.11978/2024240
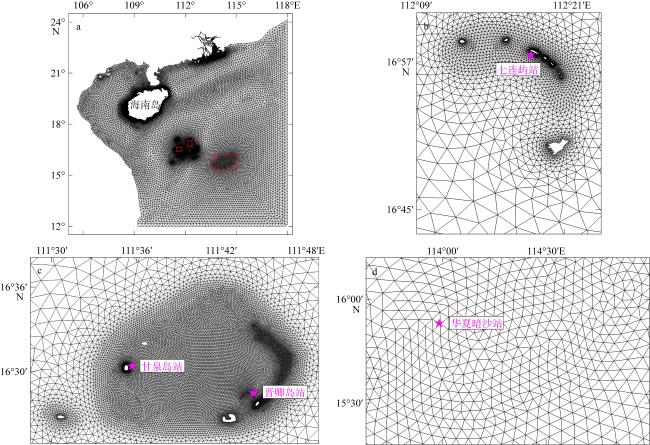
图2 波浪测站位置及计算网格示意图a. 计算网格图; b. 宣德环礁局部加密图; c. 永乐环礁局部加密图; d. 中沙群岛局部加密图。图a中的红色方框为局部加密位置 Fig. 2 Locations of wave measurement stations and schematic diagram of computational grids of the wave model. (a) Computational grid diagram; (b) locally refined grid of Xuande Atoll; (c) locally refined grid of Yongle Atoll; (d) locally refined grid of the Zhongsha Islands |
表1 波浪测量站位信息Tab. 1 Information on wave measurement stations |
| 站位 | 观测仪器 | 观测时间 | 采样频率 | 样本量 | 观测单位 |
|---|---|---|---|---|---|
| 七连屿站 | ADCP | 2017/07─2017/11 | 2h | 1371 | 海南省海洋与渔业科学院 |
| 甘泉岛站 | 浪龙仪 | 2018/01─2018/04 | 1h | 2603 | 中国船舶科学研究中心 |
| 晋卿岛站 | 浪龙仪 | 2014/06─2018/06 | 0.5h | 32487 | 中国船舶科学研究中心 |
| 华夏暗沙站 | ADCP | 2018/06─2018/11 | 2h | 1506 | 海南省海洋与渔业科学院 |
图4 实测有效波高和模拟有效波高时间序列比较a. 七连屿站; b1. 晋卿岛站; b2. 晋卿岛站; c. 甘泉岛站; d. 华夏暗沙站 Fig. 4 Comparison between measured and simulated significant wave height time series. (a) Qilianyu station; (b1) Jinqingdao station; (b2) Jinqingdao station; (c) Ganquandao station; (d) Huaxiaanjiao station |
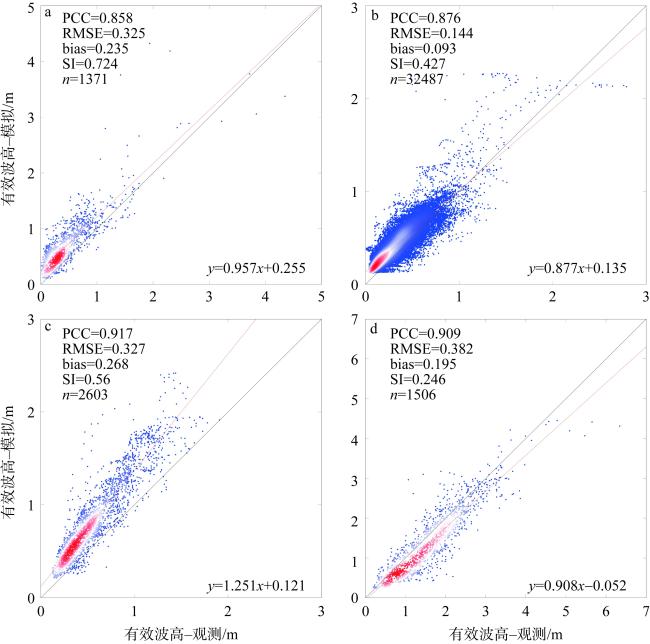
表2 模型性能统计Tab. 2 Model performance statistics |
| 统计要素 | 站位 | PCC | RMSE/m | bias/m | SI | 斜率 | n |
|---|---|---|---|---|---|---|---|
| 有效波高 | 晋卿岛站 | 0.876 | 0.144 | 0.093 | 0.427 | 0.877 | 32487 |
| 甘泉岛站 | 0.917 | 0.327 | 0.268 | 0.560 | 1.251 | 2603 | |
| 七连屿站 | 0.858 | 0.325 | 0.235 | 0.724 | 0.957 | 1371 | |
| 华夏暗沙站 | 0.909 | 0.382 | -0.195 | 0.246 | 0.908 | 1506 |
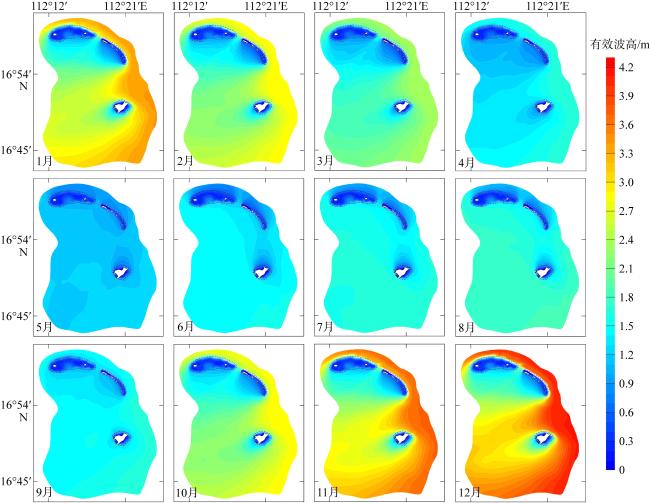
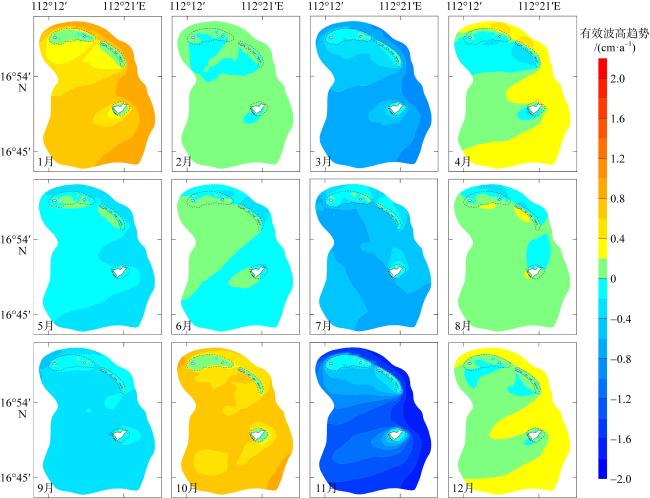
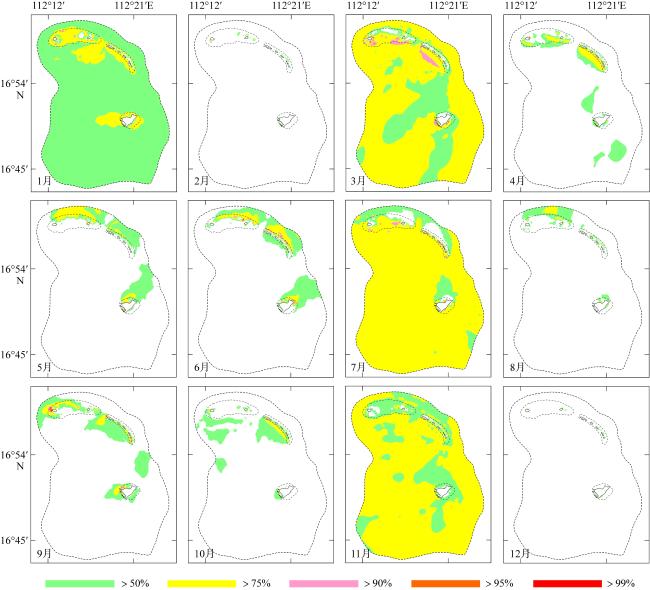
图7 不同月份平均有效波高统计空间分布图Fig. 7 Spatial distributions of monthly mean significant wave height |
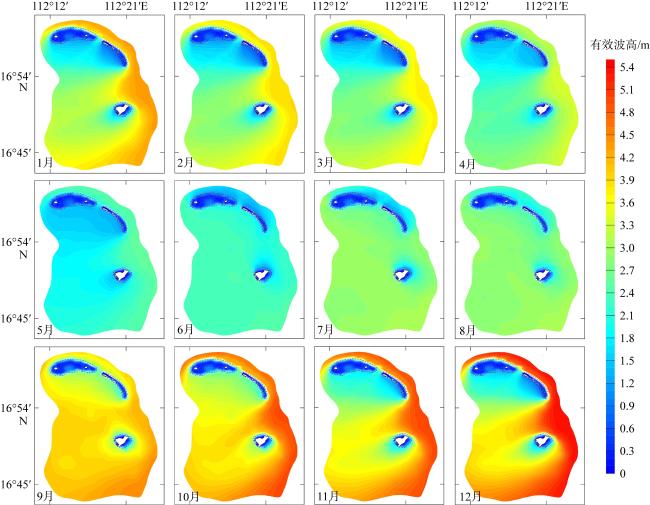
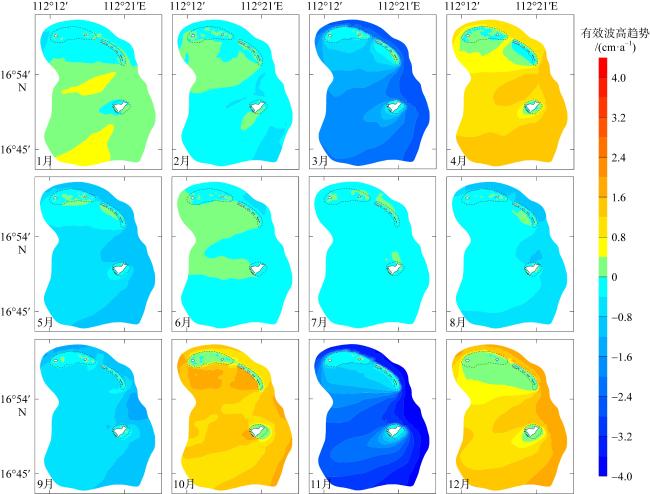
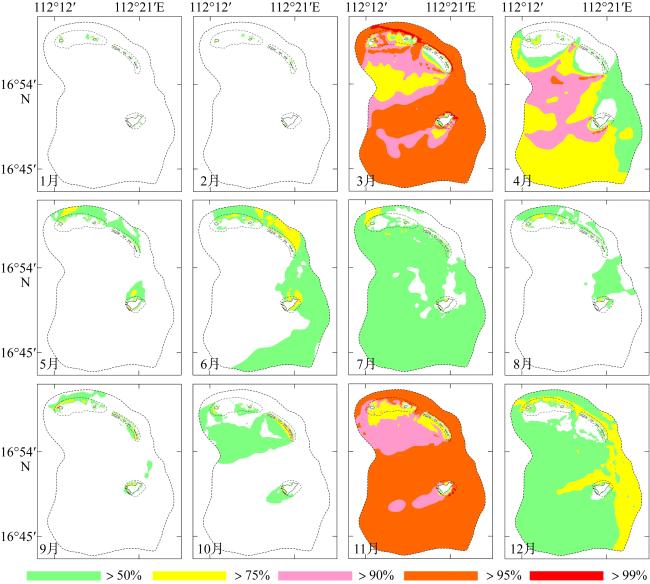
图8 不同月份90百分位有效波高统计空间分布图Fig. 8 Spatial distributions of monthly 90th percentile significant wave height |
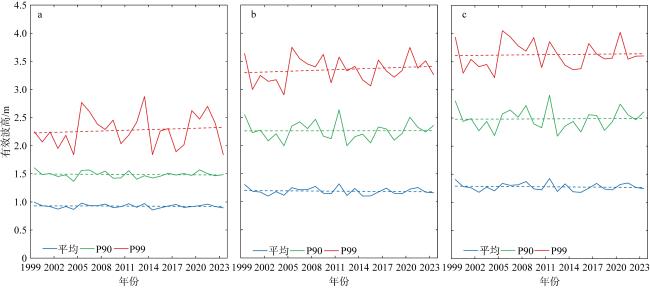
图11 宣德环礁北(a)、中(b)、南(c) 3个特征点的年平均有效波高及其趋势线图Fig. 11 Annual mean significant wave height and its trend line at three characteristic points in the northern (a), central (b), and southern (c) parts of Xuande atoll |
表3 宣德环礁特征点有效波高变化趋势(单位: cm·a-1)Tab. 3 Trends of significant wave height (unit: cm·a-1) at characteristic points of Xuande Atoll for mean, 90th and 99th percentiles |
| 特征点位置 | 平均 | 90百分位 | 99百分位 |
|---|---|---|---|
| 北 | -0.05 | -0.07 | +0.41 |
| 中 | -0.09 | +0.01 | +0.48 |
| 南 | -0.10 | +0.06 | +0.13 |
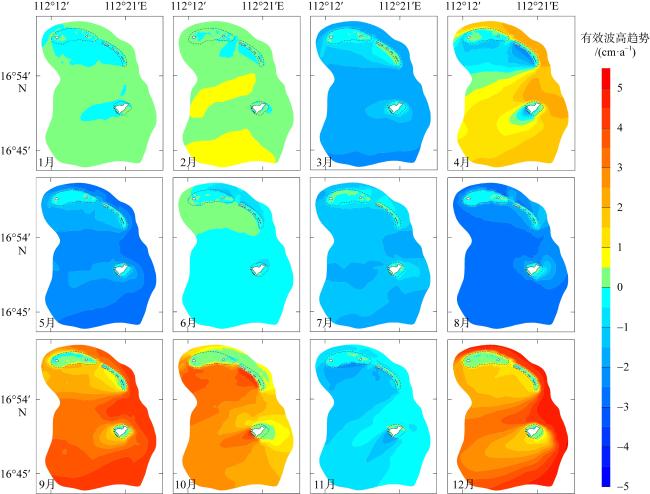
图13 不同月份90百分位有效波高逐月变化趋势图Fig. 13 Monthly trends of 90th percentile significant wave height |
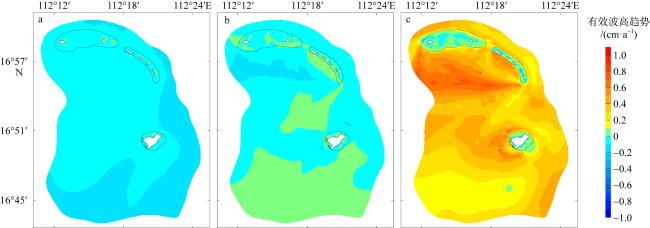
图15 不同置信区间趋势显著性空间分布图a. 平均; b. 90百分位; c. 99百分位 Fig. 15 Spatial distributions of trend significance at different confidence levels. (a) mean; (b) 90th percentile; (c) 99th percentile |
图16 不同月份平均有效波高逐月趋势显著性在不同置信区间空间分布图Fig. 16 Spatial distributions of monthly mean significant wave height trend significance at different confidence levels |
图17 不同月份90百分位有效波高逐月趋势显著性在不同置信区间空间分布图Fig. 17 Spatial distributions of monthly 90th percentile significant wave height trend significance at different confidence levels |
| [1] |
白珍胜, 宗智, 孙泽, 等, 2020. 基于WAVEWATCH Ⅲ的近岛礁波浪演化研究[J]. 船舶力学, 24(10): 1261-1269.
|
| [2] |
董进, 2019. 南海近岛礁波浪演化数值模拟研究[D]. 大连: 大连理工大学.
|
| [3] |
何其江, 刘刚, 王雪木, 等, 2021. 西沙群岛宣德环礁的精细水下地貌组合特征及其成因机制[J]. 海洋学报, 43(8): 81-92.
|
| [4] |
|
| [5] |
|
| [6] |
|
| [7] |
|
| [8] |
|
| [9] |
|
| [10] |
|
| [11] |
|
| [12] |
|
| [13] |
|
| [14] |
|
| [15] |
|
| [16] |
|
| [17] |
|
| [18] |
|
| [19] |
|
| [20] |
|
| [21] |
|
/
| 〈 |
|
〉 |


