
Journal of Tropical Oceanography >
Domestic satellite sea surface temperature data fusion based on successive corrections*
Received date: 2025-01-25
Revised date: 2025-03-18
Online published: 2025-04-07
Supported by
National Natural Science Foundation of China(41776004)
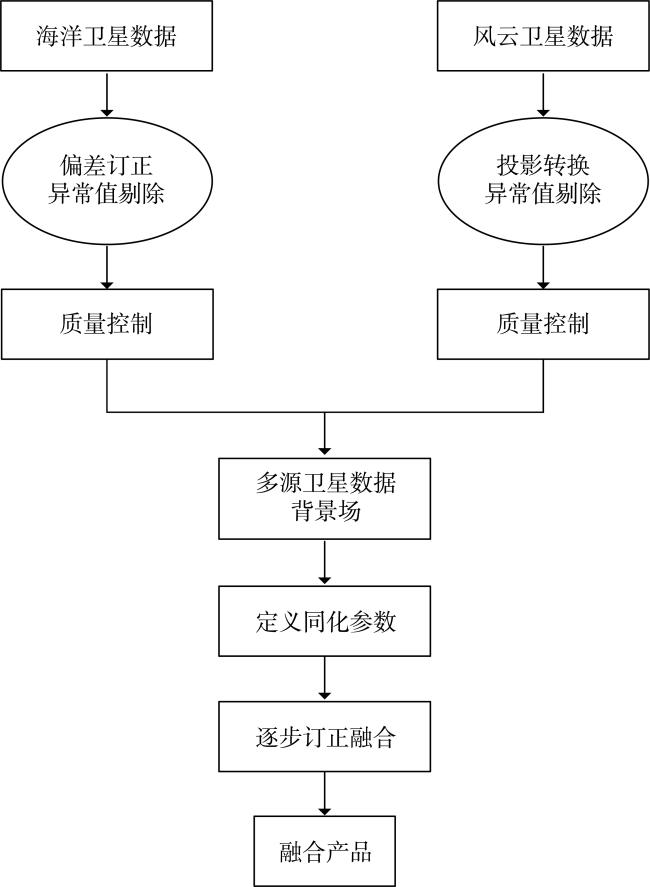
As one of the important environmental variables in the atmosphere-ocean system, sea surface temperature (SST) is of significant importance for oceanographic research. This paper utilizes domestic HaiYang (HY) and FengYun (FY) satellites remote sensing SST data to develop an autonomous, high spatiotemporal resolution satellite SST fusion product for the “Maritime Silk Road” region using the successive corrections method. First, the accuracy of SST observation data from HY and FY satellites was evaluated using iQuam in-situ data, with bias correction performed on HY-1C and HY-1D. Next, SST data from HY-1C, HY-1D, HY-2B, FY-3D, FY-3E, and FY-4B, along with a multi-scale successive corrections fusion algorithm, were used to create a daily 0.1°×0.1° resolution SST fusion product for the “Maritime Silk Road” region from April to June 2024. Finally, the accuracy of the fusion product was assessed using iQuam in-situ data. The results showed that the fusion product had an average bias of 0.08°C and a root mean square error (RMSE) of 0.67°C, indicating good accuracy. Power spectral analysis of different SST fusion products demonstrated that the SST fusion product generated in this study outperforms the Optimum Interpolation Sea Surface Temperature (OISST) in capturing small-scale features at the 100 km scale and shows comparable performance to the Operational Sea Surface Temperature and Sea Ice Analysis (OSTIA) at the 50-100 km scale, reflecting its good application potential.
NIU Haoran , WANG Xidong , GAO Zhenbo , CHEN Zhiqiang . Domestic satellite sea surface temperature data fusion based on successive corrections*[J]. Journal of Tropical Oceanography, 2025 , 44(6) : 1 -11 . DOI: 10.11978/2025015
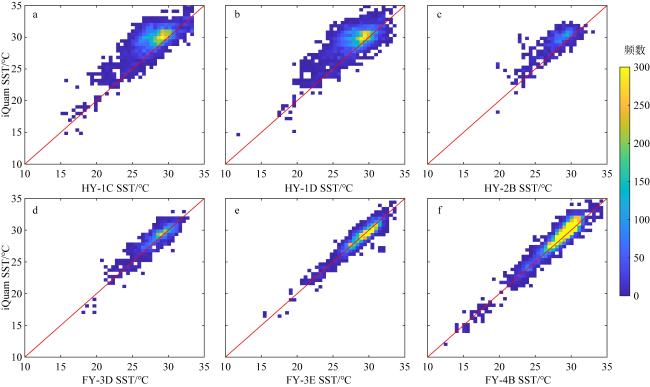
表1 单星数据与实测iQuam数据匹配结果统计(2024年4月至6月)Tab. 1 Statistical analysis of the matching results between single-satellite data and measured iQuam data (April to June 2024) |
| 卫星 | 匹配数 | 平均偏差/℃ | 绝对偏差/℃ | 均方根误差/℃ | 相关系数 |
|---|---|---|---|---|---|
| HY-1C | 9725 | -1.45 | 1.65 | 2.08 | 0.75 |
| HY-1D | 9572 | -1.23 | 1.52 | 1.98 | 0.70 |
| HY-2B | 2328 | -1.25 | 1.38 | 1.73 | 0.81 |
| FY-3D | 3877 | -0.36 | 0.72 | 0.94 | 0.88 |
| FY-3E | 7935 | 0.04 | 0.47 | 0.63 | 0.94 |
| FY-4B | 24712 | -0.39 | 0.59 | 0.77 | 0.94 |
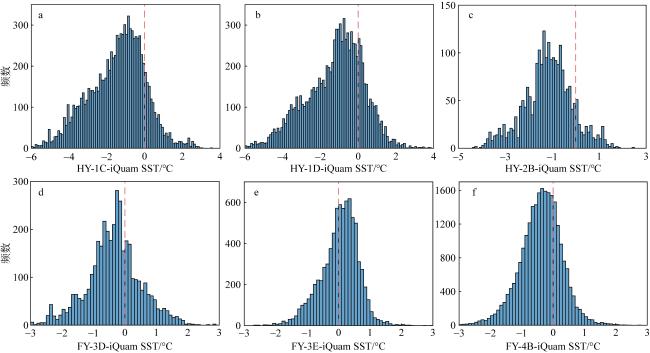
图4 4月至6月卫星SST数据与iQuam数据匹配偏差直方图a. HY-1C数据; b. HY-1D数据; c. HY-2B数据; d. FY-3D数据; e. FY-3E数据; f. FY-4B数据 Fig. 4 Histograms of matching deviations between satellite SST data and iQuam data from April to June. (a) HY-1C SST; (b) HY-1D SST; (c) HY-2B SST; (d) FY-3D SST; (e) FY-3E SST; (f) FY-4B SST |
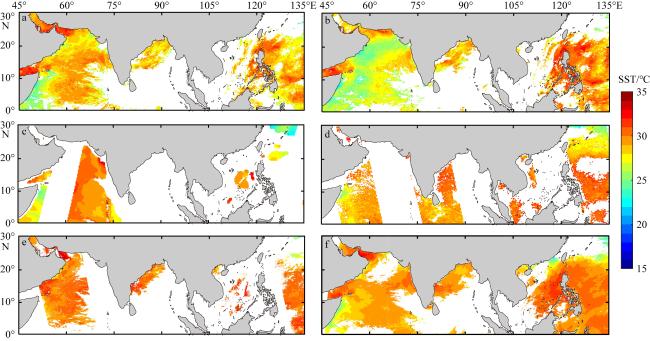
图5 2024年6月1日卫星研究区域SST数据的空间分布a. HY-1C COCTS数据; b. HY-1D COCTS数据; c. HY-2B SMR数据; d. FY-3D MWRI数据; e. FY-3E MERSI数据; f. FY-4B AGRI数据。该图基于自然资源部标准地图服务网站下载的审图号为GS(2016)1665号的标准地图制作 Fig. 5 Spatial distribution of satellite SST data on June 1, 2024. (a) HY-1C COCTS; (b) HY-1D COCTS; (c) HY-2B SMR; (d) FY-3D MERI; (e) FY-3E MERSI; (f) FY-4B AGRI |
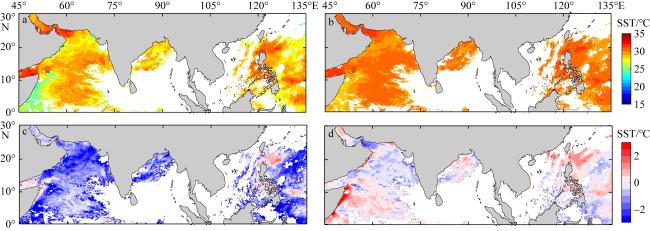
图6 2024年6月1日HY-1C卫星数据校正前后与OISST的偏差分布情况a. 校正前的HY-1C数据; b. 校正后的HY-1C数据; c. 校正前HY-1C数据与OISST的偏差; d. 校正后HY-1C数据与OISST的偏差。该图基于2018年自然资源部标准地图服务网站下载的审图号为GS(2016)1665号的标准地图制作 Fig. 6 Distribution of deviations between HY-1C satellite data before and after correction and OISST data on June 1, 2024. (a) HY-1C data before correction; (b) HY-1C data after correction; (c) deviation between HY-1C data and OISST before correction; (d) deviation between HY-1C data and OISST after correction |
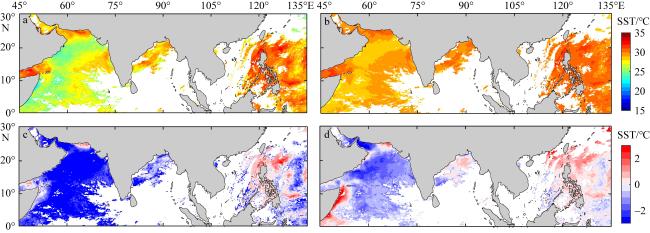
图7 2024年6月1日HY-1D卫星数据校正前后与OISST的偏差分布情况a. 校正前的HY-1D数据; b. 校正后的HY-1D数据; c. 校正前HY-1D数据与OISST的偏差; d. 校正后HY-1D数据与OISST的偏差。该图基于自然资源部标准地图服务网站下载的审图号为GS(2016)1665号的标准地图制作 Fig. 7 Distribution of deviations between HY-1D satellite data before and after correction and OISST data on June 1, 2024. (a) HY-1D data before correction; (b) HY-1D data after correction; (c) deviation between HY-1D data and OISST before correction; (d) deviation between HY-1D data and OISST after correction |
表2 HY-1C和HY-1D数据校正后误差统计(2024年4月至6月)Tab. 2 Error statistics of HY-1C and HY-1D data after correction (April to June 2024) |
| 卫星 | 平均偏差/℃ | 均方根误差/℃ | 绝对偏差/℃ |
|---|---|---|---|
| HY-1C | 0.13 | 1.11 | 0.83 |
| HY-1D | 0.09 | 1.08 | 0.82 |
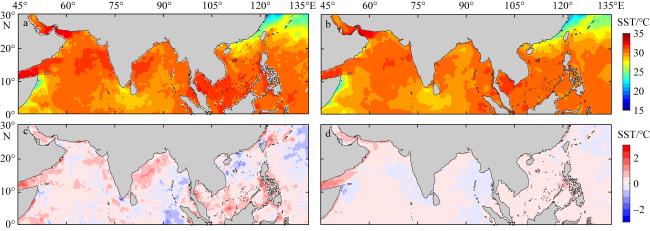
图8 融合结果与OISST的对比a. 6月1日融合结果; b. 6月1日OISST; c. 6月1日融合结果与OISST的偏差分布; d. 6月平均偏差分布。该图基于自然资源部标准地图服务网站下载的审图号为GS(2016)1665号的标准地图制作 Fig. 8 Comparison between fusion results and OISST. (a) Fusion results on June 1; (b) OISST on June 1; (c) deviation between fusion results and OISST on June 1; (d) spatial distribution of average deviation in June |
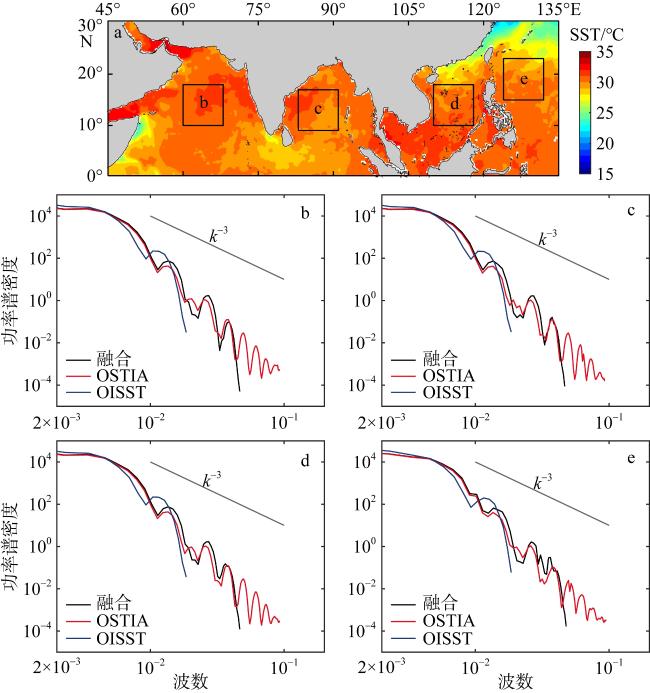
图9 6月1日—7日的功率谱分析a. 4个分析区域; b. 阿拉伯海域(60°—68°E, 10°—18°N); c. 孟加拉湾海域(83°—91°E, 9°—17°N); d. 南海海域(110°—118°E, 10°—18°N); e. 台湾岛东部海域(124°—132°E, 15°—23°N); k-3为功率谱斜率。该图基于国家测绘地理信息局标准地图服务网站下载的审图号为GS(2016)1665号的标准地图制作 Fig. 9 Power spectral density analysis for June 1-7. (a) Four analysis regions; (b) Arabian Sea (60°-68°E, 10°-18°N); (c) Bay of Bengal (83°-91°E, 9°-17°N); (d) South China Sea (110°-118°E, 10°-18°N); (e) eastern waters of Taiwan Island (124°-132°E, 15°-23°N) |
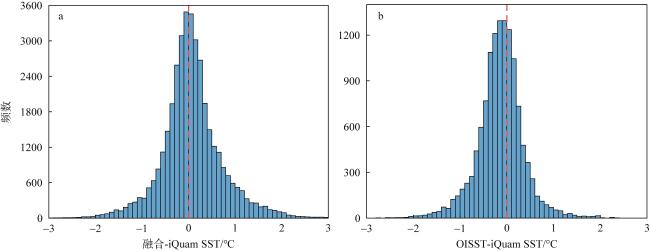
表3 2024年4—6月融合产品的误差统计Tab. 3 Error statistics of fusion products from April to June 2024 |
| 融合产品 | OISST | |
|---|---|---|
| 平均偏差/℃ | 0.08 | -0.14 |
| 绝对偏差/℃ | 0.47 | 0.37 |
| 均方根误差/℃ | 0.67 | 0.52 |
| 相关系数 | 0.96 | 0.97 |
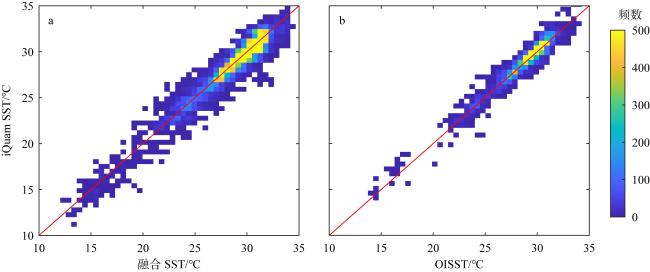
图10 融合结果(a)和OISST(b)分别与iQuam匹配的分布情况Fig. 10 Distribution of matching results between the fusion result (a) and OISST (b) with iQuam, respectively |
| [1] |
何子康, 王喜冬, 陈志强, 等, 2021. 利用海洋温度剖面与海表盐度反演盐度剖面方法研究[J]. 热带海洋学报, 40(6): 41-51.
|
| [2] |
柳雯俊, 2020. 基于优化神经网络的海温融合与三维模型研究[D]. 武汉: 华中科技大学.
|
| [3] |
刘伊格, 2019. 渤海和黄海海表温度变化及成因分析[D]. 南京: 南京大学.
|
| [4] |
苗春生, 程远, 王坚红, 等, 2015. 中国风云卫星与海洋卫星近海SST资料融合技术及应用研究[J]. 地球科学进展, 30(10): 1127-1143.
|
| [5] |
齐庆华, 蔡榕硕, 2019. 中国近海海表温度变化的极端特性及其气候特征研究[J]. 海洋学报, 41(7): 36-51.
|
| [6] |
石绥祥, 夏登文, 于戈, 2005. 基于D-S理论的卫星遥感海表面温度和同化数据融合方法[J]. 海洋学报(中文版), 27(4): 31-37.
|
| [7] |
王艳珍, 管磊, 曲利芹, 2010. 卡尔曼滤波在卫星红外、微波海表温度数据融合中的应用[J]. 中国海洋大学学报(自然科学版), 40(12): 126-130.
|
| [8] |
徐宾, 宇婧婧, 张雷, 等, 2018. 全球海表温度融合研究进展[J]. 气象科技进展, 8(1): 164-170.
|
| [9] |
奚萌, 2011. 基于最优插值算法的红外和微波遥感海表温度数据融合[D]. 北京: 国家海洋环境预报研究中心.
|
| [10] |
杨梦, 孙伟富, 姜远驰, 2024. 东南亚海域HY-1C SST数据评估与校正[J]. 数字海洋与水下攻防, 7(1): 87-97.
|
| [11] |
张慧, 2006. 基于小波变换的AVHRR和AMSR-E卫星海表温度数据融合[D]. 青岛: 中国海洋大学.
|
| [12] |
|
| [13] |
|
| [14] |
|
| [15] |
|
| [16] |
|
| [17] |
|
| [18] |
|
| [19] |
|
| [20] |
|
| [21] |
|
| [22] |
|
| [23] |
|
| [24] |
|
| [25] |
|
| [26] |
|
| [27] |
|
| [28] |
|
| [29] |
|
/
| 〈 |
|
〉 |
