
Journal of Tropical Oceanography >
Seasonal variation of East India Coastal Current and its transports of heat and salt
Received date: 2021-04-15
Revised date: 2021-07-20
Online published: 2021-08-02
Supported by
Strategic Priority Research Program of Chinese Academy of Sciences(XDA20060502)
National Natural Science Foundation of China(91958202)
National Natural Science Foundation of China(41521005)
Key Special Project for Introduced Talents Team of Southern Marine Science and Engineering Guangdong Laboratory (Guangzhou)(GML2019ZD0306)
Innovation Academy of South China Sea Ecology and Environmental Engineering, Chinese Academy of Sciences(ISEE2018PY06)
Key Research Program of the Chinese Academy of Sciences(ZDRW-XH-2019-2)
Using satellite altimeter, model and assimilation data, we reveal the spatial and temporal distribution characteristics of the East India Coastal Current (EICC) in the annual cycle, and discuss its possible mechanism, and heat and salt transports. In the annual cycle, the EICC presents three distribution states. Affected by the monsoon, it flows southward (northward) in the early stage (October to December) and late stage (February to May) of the northeast monsoon, while it distributes in three stages from June to August, which is significantly different from the other two periods, showing southward flow in the areas south of 9°N, north of 16°N and northward in the area between 9°N and 16°N. Previous studies suggested that the local wind stress along the east coast of India is the main mechanism of the EICC. In addition to the local wind stress, the Ekman Pumping in the central Bay of Bengal (BOB) plays an important role during the whole year, and drives the northward (southward) flow of the EICC from February to May (October to December), while the local wind stress is conducive to the southward flow of the EICC from October to December. The EICC is a factor for the transport of low-salinity water from the BOB to the Equatorial East Indian Ocean and the Arabian Sea, which plays an important role in the heat and salt exchanges between the basins. The heat transport of the EICC from June to December (February to May) is favorable (unfavorable) to the temperature increase in the BOB; salt transport is conducive to the increase of salinity in the BOB throughout the year. The transport characteristics of the EICC promote the redistributions of heat and salt in the BOB and play an important role in maintaining the heat and salinity budgets in the northern Indian Ocean.
XIN Hongyu , XIE Qiang , WANG Weiqiang . Seasonal variation of East India Coastal Current and its transports of heat and salt[J]. Journal of Tropical Oceanography, 2022 , 41(2) : 38 -51 . DOI: 10.11978/2021051
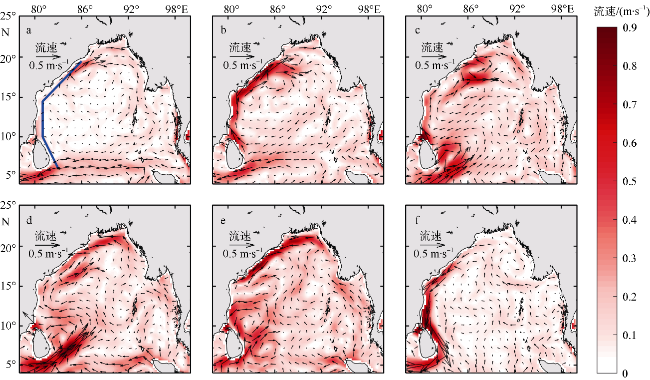
图1 孟加拉湾(BOB)多年月平均的表层流场分布图a~f依次表示AVISO资料气候态1—12月每两个月的平均地转流。黑色箭头表示地转流; 填色表示地转流大小。图a蓝色实线为选取的不规则断面, 距BOB西边界约100km, 可近似认为与海岸线平行 Fig. 1 Monthly averaged surface flow distribution in the BOB. Panels (a~f) represent the mean geostrophic current of each two months from January to December in the climate state of the AVISO data. The black arrows indicates the geostrophic current, while the shading indicates the velocity of geostrophic current. The blue solid line is the selected irregular section, about 100 km from the west boundary of the BOB, which can be considered parallel to the coastline |
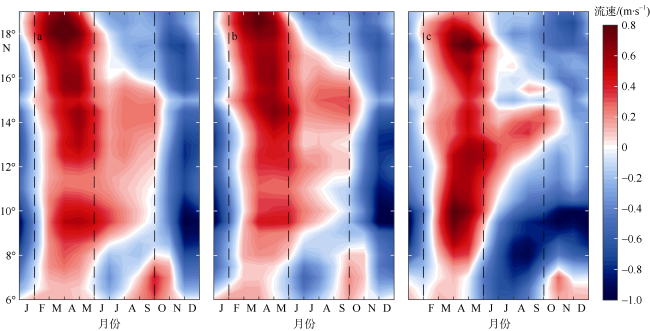
图2 不规则断面( |
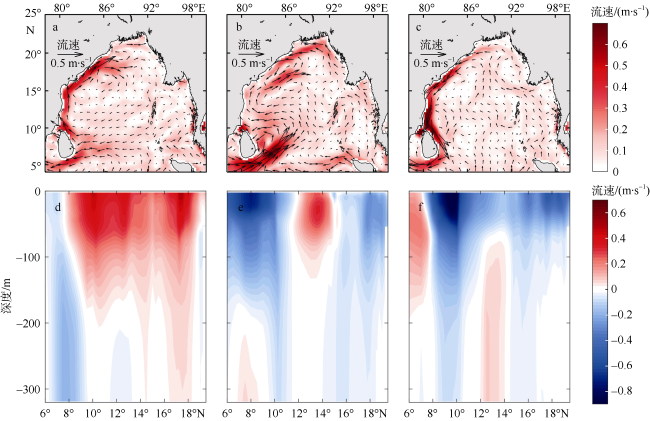
图3 孟加拉湾(BOB)表层地转流(a、b、c)和不规则断面(图1a中蓝色实线)上的海流随深度的变化(d、e、f)a、b、c分别表示AVISO资料2—5月、6—8月、10—12月季节平均的表层地转流, 箭头表示流速, 填色表示流速大小; d、e、f分别表示OFES资料2—5月、6—8月、10—12月季节平均的海流在不规则断面上随深度的变化, 填色表示沿海岸线方向投影的流速, 沿海岸线北向流动为正 Fig. 3 Seasonal variations of AVISO surface geostrophic current (a, b, c) and OFES projected velocity along the coastline along the irregular section (solid blue line in |
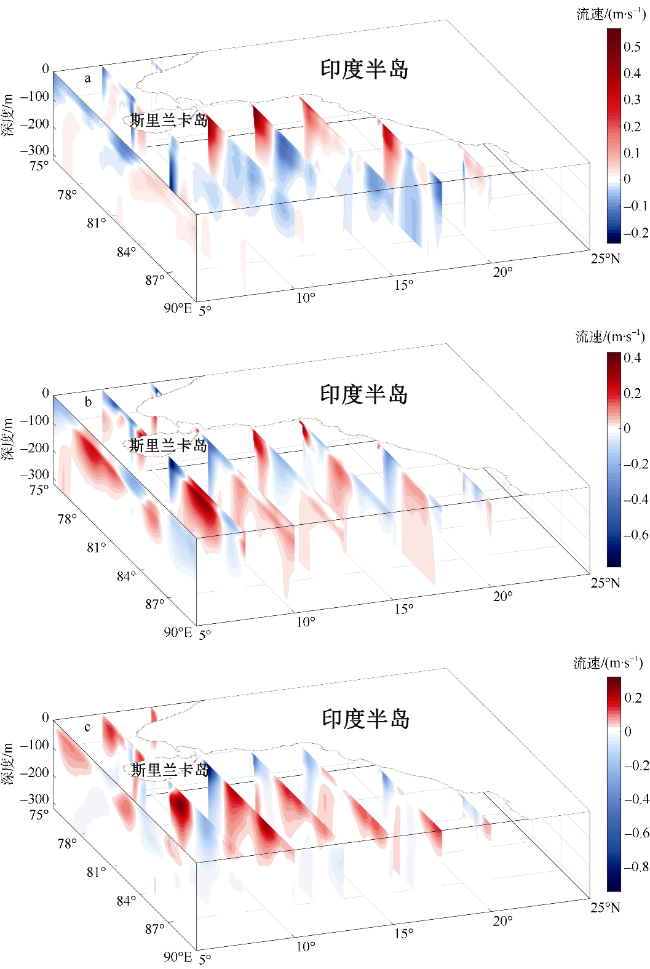
图4 孟加拉湾(BOB)气候态月平均的经向流速三维断面分布图a、b、c分别表示OFES资料2—5月、6—8月、10—12月季节平均的经向流场 Fig. 4 Three-dimensional cross-section distribution of monthly mean meridional velocity in the BOB. We show the seasonal mean meridional current of February - May (a), June - August (b), and October - December (c) from OFES data |
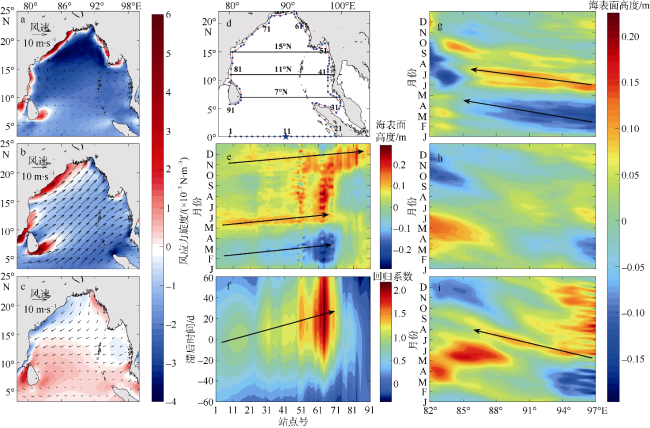
图5 孟加拉湾(BOB)的风应力旋度场和海表面高度随时间的变化a、b、c分别表示ECMWF资料2—5月、6—8月、10—12月季节平均的10m风场(黑色箭头)和风应力旋度场(填色); d. BOB沿岸选取的站点和断面位置分布, 图中蓝点表示沿BOB沿岸1°网格的格点位置, 红色实线表示格点位置的连线, 数字表示自(80°E, 0)的格点序号, 蓝色星号表示(90°E, 0)的位置, 黑色实线分别表示BOB湾内7°N、11°N和15°N 3条断面; e. BOB沿岸各站点海表面高度随时间的变化, 图中黑色箭头表示沿岸Kelvin波传播的示意路径; f. BOB沿岸各站点的海表面高度相对于蓝星所示站点(90°E, 0)海表面高度的超前滞后回归, 图中黑色箭头表示沿岸Kelvin波传播示意路径; g、h、i 分别表示BOB湾内7°N、11°N、15°N断面( Fig. 5 Seasonal variation of wind stress curl and time series of sea-surface height in the BOB. (a, b, c) Seasonal mean 10-m wind field (black arrow) and wind stress curl field (shading) of ECMWF data from February - May, June - August, and October - December. (d) Distribution of selected stations along the BOB coast and three sections of 7°N, 11°N, and 15°N. (e) Time series of sea-surface height of stations along the BOB coast. (f) Corresponding time-station lag regression of the observed sea-surface height with respect to the normalized sea-surface height at the stations indicated by blue star (90°E, 0) in |
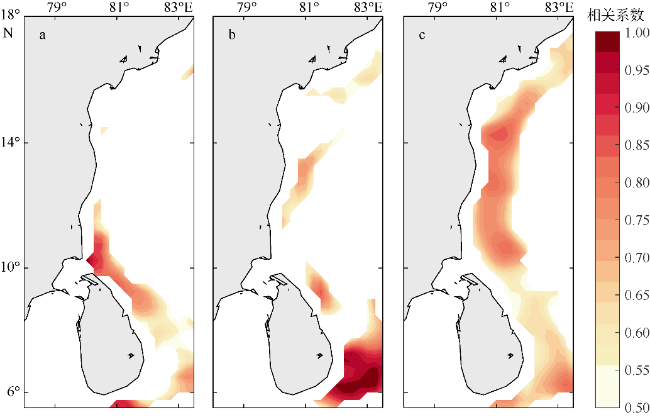
图6 AVISO地转流和ECMWF风场矢量相关系数的空间分布(95%置信水平)a. 2—5月平均; b. 6—8月平均; c. 10—12月平均 Fig. 6 Spatial distribution of correlation coefficients between the AVISO geostrophic current and ECMWF wind. (a) Average from February to May; (b) Average from June to August; and (c) Average from October to December |
图7 印度东海岸上层100m平均的流场、温度场(a、b、c)和盐度场(d、e、f)的空间分布a和d, b和e, c和f分别表示2—5月, 6—8月和10—12月的季节平均, 红色实线表示EICC的大致范围 Fig. 7 Spatial distribution of the mean flow field, temperature field (a, b, c), and salinity field (d, e, f) in the upper 100 m of the east coast of India. (a, d) average from February to May; (b, e) average from June to August; and (c, f) average from October to December. The black arrow represents the current velocity, and the red solid line represents the general range of the EICC |
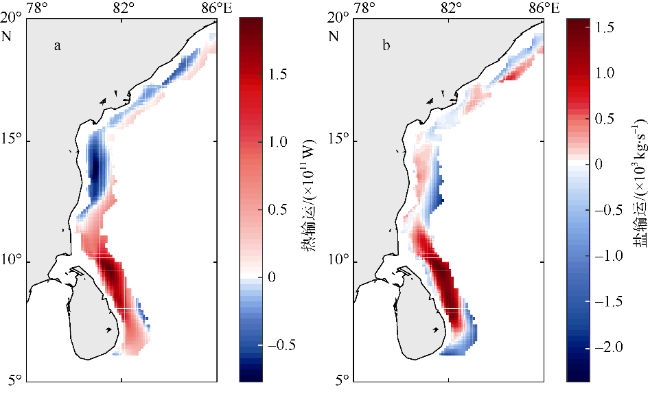
图8 EICC上层100m年平均的经向热输运(a)和盐输运(b)对BOB湾内的贡献正(负)贡献表示EICC有利于BOB湾内温度(盐度)的增加(降低) Fig. 8 Annual average contributions of meridional heat transport (a) and salt transport (b) to the BOB in the upper 100 m of the EICC. The positive (negative) contribution indicates that EICC is beneficial to the increase (decrease) of temperature or salinity in the BOB |
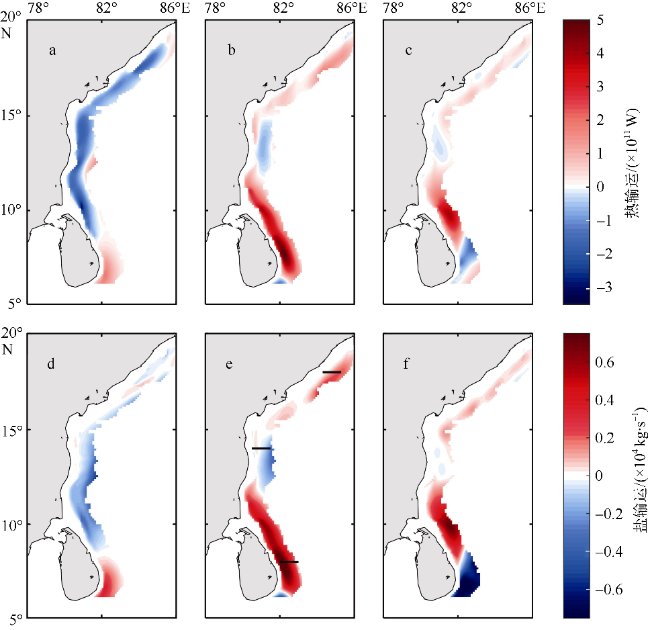
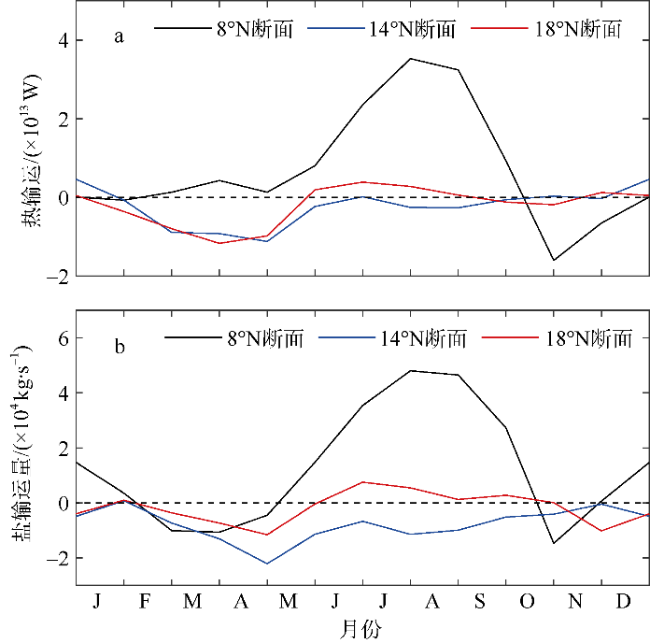
图9 EICC上层100m季节平均的经向热输运(a、b、c)和盐输运(d、e、f)对BOB湾内的贡献a、d为2—5月平均; b、e为6—8月平均; c、f为10—12月平均。图e中黑色实线分别表示8°N、14°N和18°N断面 Fig. 9 Seasonal average contributions of meridional heat transport (a, b, c) and salt transport (d, e, f) to the BOB in the upper 100 m of the EICC. (a, d) average from February to May; (b, e) average from June to August; and (c, f) average from October to December |
| [1] |
|
| [2] |
高立宝, 于卫东, 2009. 孟加拉湾局地动力过程的季节变化研究[J]. 海洋科学进展, 27(3): 312-323.
|
| [3] |
邱云, 李立, 2007. 孟加拉湾上层地转环流周年变化的遥感研究[J]. 海洋学报, 29(3): 39-46.
|
| [4] |
邱云, 李立, 周喜武, 2008. 斯里兰卡冷涡及其成因分析[J]. 热带海洋学报, 27(4): 45-51.
|
| [5] |
张玉红, 徐海明, 杜岩, 等, 2009. 阿拉伯海东南海域盐度收支的季节变化[J]. 热带海洋学报, 28(5): 66-74.
|
| [6] |
郑佳喻, 徐康, 陈更新, 等, 2018. 热带印度洋环流动力与季风相互作用研究进展[J]. 南京信息工程大学学报(自然科学版), 10(3): 275-281.
|
| [7] |
|
| [8] |
|
| [9] |
|
| [10] |
|
| [11] |
|
| [12] |
|
| [13] |
|
| [14] |
|
| [15] |
|
| [16] |
|
| [17] |
|
| [18] |
|
| [19] |
|
| [20] |
|
| [21] |
|
| [22] |
|
| [23] |
|
| [24] |
|
| [25] |
|
| [26] |
|
| [27] |
|
| [28] |
|
| [29] |
|
| [30] |
|
| [31] |
|
| [32] |
|
| [33] |
|
| [34] |
|
| [35] |
|
| [36] |
|
| [37] |
|
| [38] |
|
| [39] |
|
| [40] |
|
/
| 〈 |
|
〉 |

