
Journal of Tropical Oceanography >
The inversion of multiple-phase SSTs based on the MODIS data: a case study on the southwest coastal waters of Hainan Island
Received date: 2016-03-28
Request revised date: 2016-06-24
Online published: 2017-01-19
Copyright
By regarding the moderate resolution imaging spectroradiometer (MODIS) remote sensing data as data sources and the southwest coastal waters of Hainan Island as the study area, the improved spilt-window algorithm is used to inverse the SST of the study area from 2005 to 2014. To verify the retrieval accuracy of the SST, we calculate the correlation coefficient between the inversion and measured results using the measured values of 12 observation points; the coefficient is 0.9. Based on the inversion results of SST, the data of four seasons in a year and a decade are analyzed to show the spatial and temporal variations of SST distribution, respectively. Results show that using the MODIS multi-channel improved spilt-window algorithm we can inverse Hainan Island offshore SST accurately. The spatial and temporal variations of SST distribution thus obtained can provide important reference values for marine fishery, change of marine environment and meteorological monitoring.
Key words: MODIS data; spilt-window algorithm; sea surface temperature; Hainan Island
GUO Tiantian , CHEN Shengbo , LU Tianqi . The inversion of multiple-phase SSTs based on the MODIS data: a case study on the southwest coastal waters of Hainan Island[J]. Journal of Tropical Oceanography, 2017 , 36(1) : 9 -14 . DOI: 10.11978/2016032
Tab. l Characteristics of some detection channel of MODIS表1 MODIS部分探测通道特性 |
| 通道 | 带宽/μm | 中心波长/μm | 波段 | 温度为300K时的光谱辐射率/(W·m-2·μm-1·sr-1) | 等效噪声温度差/K |
|---|---|---|---|---|---|
| 20 | 3.66~3.84 | 3.75 | 中红外 | 0.45 | 0.05 |
| 22 | 3.929~3.989 | 3.96 | 中红外 | 0.67 | 0.07 |
| 23 | 4.02~4.08 | 4.05 | 中红外 | 0.79 | 0.07 |
| 31 | 10.78~11.28 | 11.03 | 热红外 | 9.55 | 0.05 |
| 32 | 11.77~12.27 | 12.02 | 热红外 | 8.94 | 0.05 |
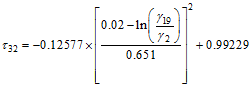
Fig. 1 The flow chart of sea surface temperature inversion by the split-window algorithm图1 分裂窗算法反演海表温度流程图 |
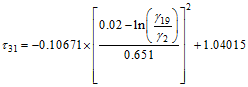 (3)
(3) (4)
(4)Tab. 2 Observed SST compared with inversed SST表2 实测SST与反演SST比较 |
| 浮标值/℃ | 反演值/℃ | 差值/℃ | 相对误差/% |
|---|---|---|---|
| 28.5 | 27.6 | -0.9 | -3.2 |
| 25.7 | 26.0 | 0.3 | 1.1 |
| 23.8 | 23.1 | -0.7 | -2.9 |
| 30.9 | 29.6 | -1.3 | -4.2 |
| 30.4 | 29.1 | -1.3 | -4.3 |
| 28.5 | 29.2 | 0.7 | 2.5 |
| 27.9 | 27.2 | -0.7 | -2.5 |
| 29.1 | 29.8 | 0.7 | 2.4 |
| 28.8 | 28.2 | -0.6 | -2.1 |
| 28.7 | 29.1 | 0.4 | 1.4 |
| 29.0 | 29.1 | 0.1 | 0.3 |
| 29.1 | 28.3 | -0.8 | -2.7 |
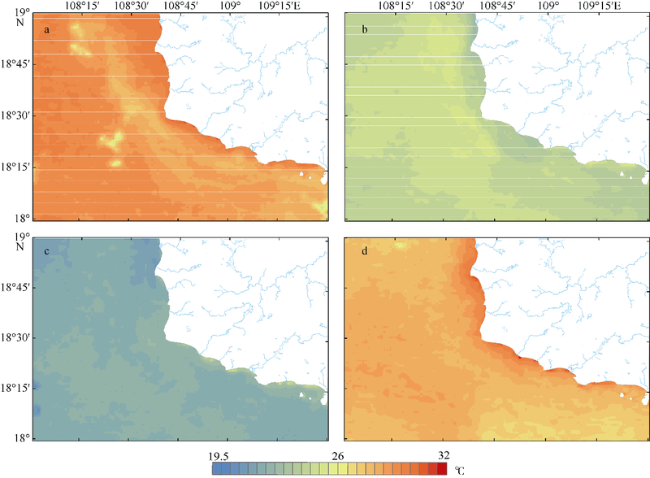
Fig. 2 Temperature information extracted from different seasons. a) August 2013; b) December 2013; c) February 2014; d) May 2014图2 不同季度温度信息提取 |
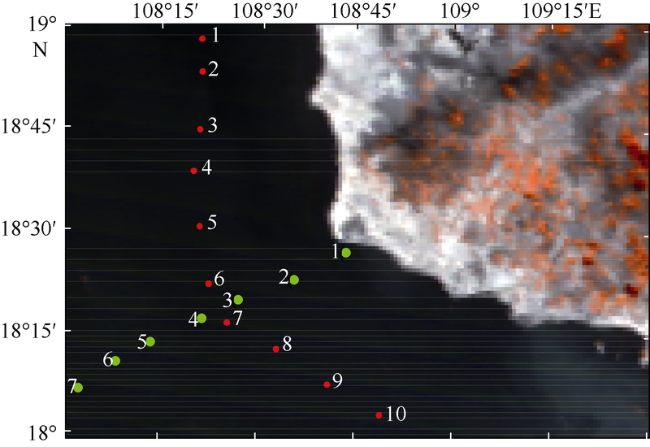
Fig. 3 Diagram of temperature extraction point. Red points are sampling sites in depth contour direction and green points are in vertical depth contour direction图3 温度变化提取点示意图 |
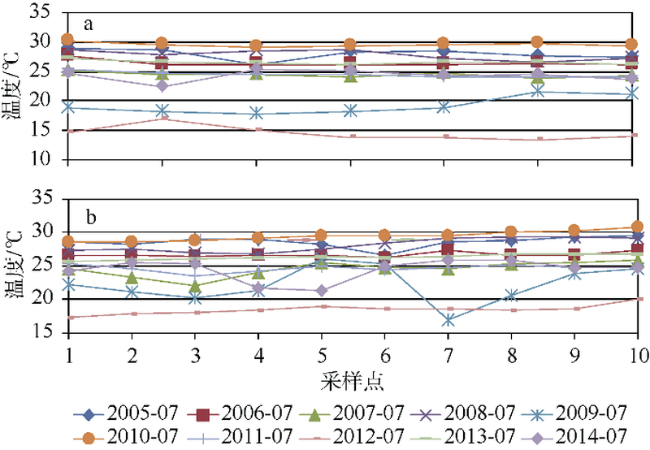
Fig. 4 Sea surface temperature trends in terms of year- to-year changes. a) in vertical depth contour direction; b) in depth contour direction图4 海表温度年变化趋势图 |
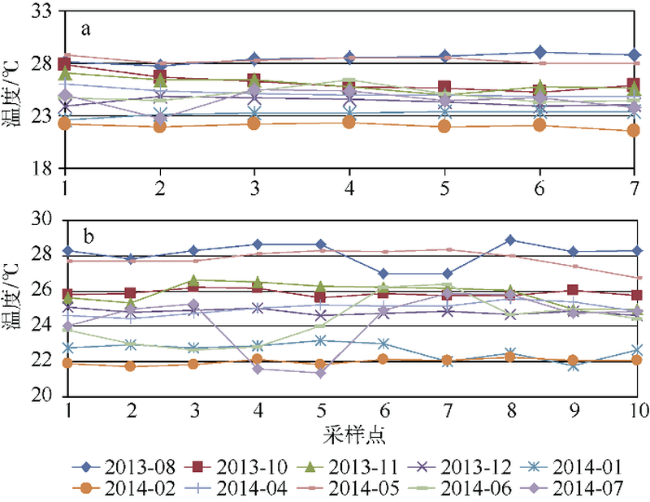
Fig. 5 Sea surface temperature trend in terms of seasonal changes. a) in vertical depth contour direction; b) in depth contour direction图5 海表温度季度变化趋势图 |
The authors have declared that no competing interests exist.
| [1] |
|
| [2] |
|
| [3] |
|
| [4] |
|
| [5] |
|
| [6] |
|
| [7] |
|
| [8] |
|
| [9] |
|
| [10] |
|
| [11] |
|
/
| 〈 |
|
〉 |
