
Journal of Tropical Oceanography >
The effect of Indian Ocean Basin mode on Indian Summer Monsoon Rainfall in decaying year of El Niño
Received date: 2016-05-29
Request revised date: 2016-07-25
Online published: 2017-04-06
Supported by
National Basic Research Program of China (2012CB955600)
The National Natural Science Foundation of China (47476003, 41106010)
Copyright
Based on the All India Rainfall data, NCEP/NCAR reanalysis data and HadISST data, we demonstrated a delayed effect of the El Nino-Southern Oscillation (ENSO) and Indian Ocean Basin (IOB) mode on Indian summer monsoon rainfall (ISMR). The results showed that decreased Indian rainfall in the early summer (Jun-Jul) and increased rainfall in the late summer (Aug-Sep) are influenced by the anti-symmetric mode and the second warming in the northern Indian Ocean (NIO). The responses of ISMR to El Niño are distinct between the developing and decaying years. In the developing year of El Niño, the ISMR decreases due to the change of Walker circulation in the tropical ocean. In the decaying year, the IOB mode decreases (increases) the ISMR in early (late) boreal summer. The anti-symmetric pattern of atmospheric anomalies with northeasterly (northwesterly) wind anomalies north (south) of the equator happens in spring. The northeasterly anomalies weaken the Indian Summer Monsoon and force the second anomalous sea surface temperature (SST) peak in the NIO by reducing wind speed and surface evaporation. The southwest monsoon brings more moisture (Q°), which is produced by the warm NIO SST to the India subcontinent, leading to increased monsoon rainfall in the late summer.
LÜ Lianghong , ZHENG Xiaotong . The effect of Indian Ocean Basin mode on Indian Summer Monsoon Rainfall in decaying year of El Niño[J]. Journal of Tropical Oceanography, 2017 , 36(2) : 1 -11 . DOI: 10.11978/2016054
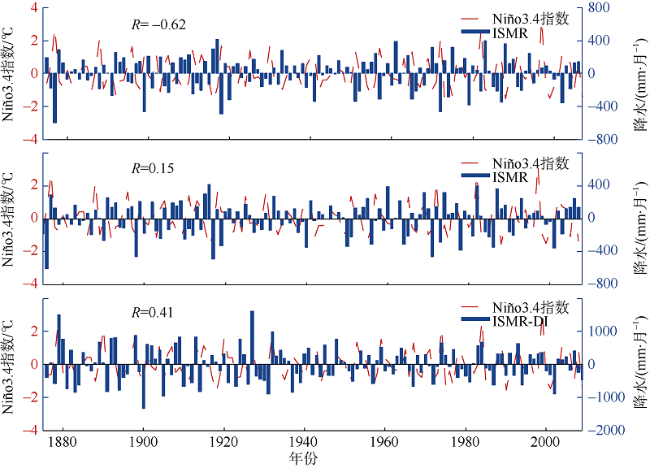
Fig. 1 Correlation of India summer monsoon rainfall (blue bar) with NDJ Niño3.4 SST index (red dashed curve). a) In El Niño developing year; b) in El Niño decaying year; c) India summer monsoon rainfall delay index (ISMR-DI)图1 印度大陆夏季季风降水(ISMR)序列(蓝色柱状)和冬季(NDJ)Niño3.4指数序列(红色虚线) |
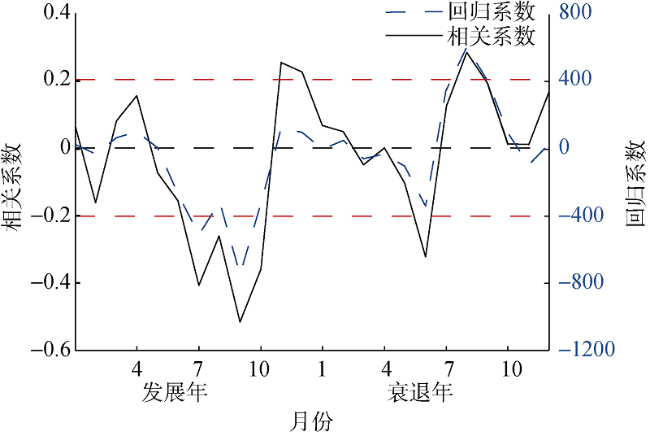
Fig. 2 Correlation (black solid curve) and regression (blue dashed curve) of ISMR and NDJ Niño3.4 index from developing year to decaying year of El Niño. Two horizontal red dashed lines show the 95% confidence level图2 El Niño发展年至衰退年印度降水与冬季(NDJ) Niño3.4指数相关(黑色实线; 红色虚线为95%置信度)、回归(蓝色虚线) |
Tab. 1 Correlation of ISMR with (1) NDJNiño3.4 index in decaying year; (2) the Indian Ocean basin SST anomalies (MAM); (3) NIO SST anomalies (MAM); and (4) AMI index. The number in bold font means exceeding the 95% confidence level表1 冬季(NDJ)Niño3.4指数(衰退年)、印度洋海盆春季整体增暖SST序列(IOB SST)、北印度洋二次增暖SST序列、反对称指数(AMI)与印度夏季季风降水(ISMR)的相关系数 |
| ISMR(JJAS) | ISMR(6月) | ISMR(7月) | ISMR(8月) | ISMR(9月) | |
|---|---|---|---|---|---|
| Niño3.4 | 0.15 | -0.46 | 0.04 | 0.32 | 0.45 |
| IOB SST | 0.19 | -0.32 | 0.03 | 0.24 | 0.45 |
| NIO SST | 0.22 | -0.49 | 0.03 | 0.30 | 0.59 |
| AMI | -0.10 | -0.61 | -0.08 | 0.28 | 0.40 |
注: 黑体字表示超过95%置信度系数。 |
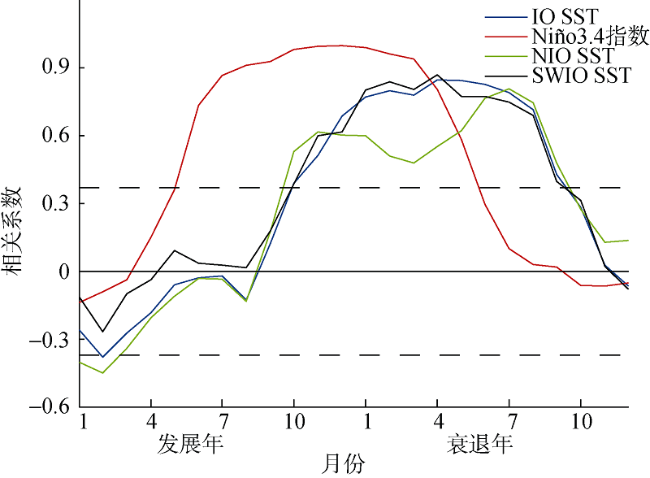
Fig. 3 Correlation of Indian Ocean (SWIO, NIO, or IO) SST anomalies with NDJ Niño3.4 index. Two horizontal red dashed lines show the 95% confidence level图3 西南印度洋(SWIO)、北印度洋(NIO)、印度洋海盆(IO)SST与冬季(NDJ) Niño3.4指数的超前滞后相关(红色虚线为95%置信度) |
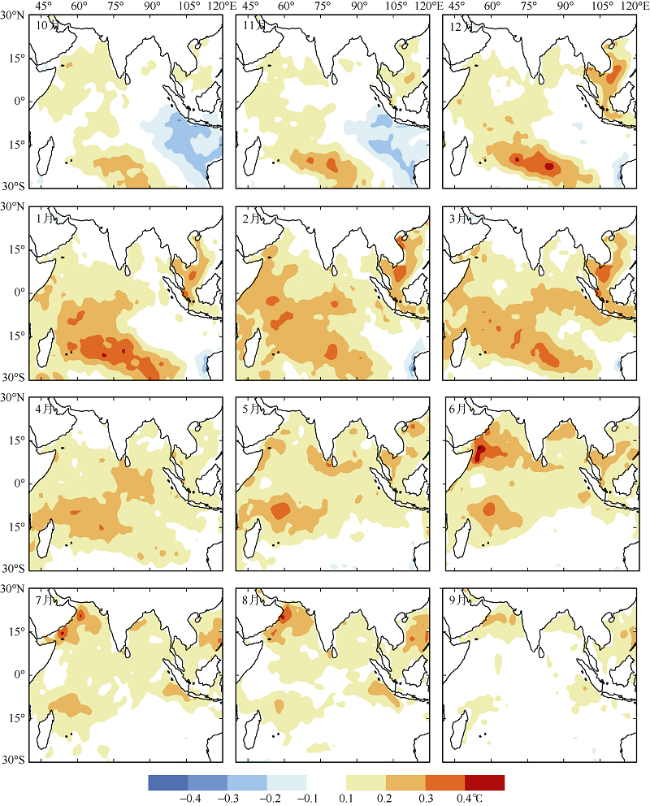
Fig. 4 Regression coefficients of SST anomalies with NDJ Niño3.4 index from October in developing year to September in decaying year (shading, ℃)图4 El Niño发展年10月到次年9月海表面温度异常对冬季(NDJ)Niño3.4指数回归系数分布(填色, ℃) |
Fig. 5 Regression coefficients of rainfall anomalies (shading) and 850hPa wind anomalies (vector) with NDJ Niño3.4 index from October in developing year to September in decaying year. Wind vectors are plotted only where the length of the vector exceeds 0.3 m•s-1图5 El Niño发展年10月到次年9月降水异常(填色)和风场异常(矢量)对冬季(NDJ)Niño3.4指数回归系数分布(图中只画出大于0.3m•s-1的风速) |
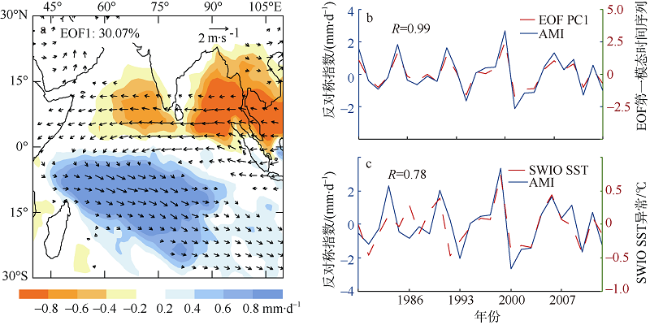
Fig. 6 Correlations of the first EOF mode of boreal rainfall in Indian Ocean and AMI index, boreal spring SWIO SST anomalies and AMI index. (a) Anomalies of rainfall (shading) and 850hPa winds (vector) in boreal spring (MAM) obtained from regression of the fields on the time series coefficient of the first EOF mode of boreal spring rainfall in the Indian Ocean (28°S-28°N, 40°-110°E). Wind vectors are plotted only where the length of the vector exceeds 0.3 m•s-1. (b) Time series coefficient of the first EOF mode (red dashed curve) and AMI index (blue solid curve). (c) AMI index (blue solid curve) and boreal spring (MAM) SWIO SST anomalies (red dashed curve, ℃)图6 印度洋春季降水异常EOF第一模态与反对称指数、西南印度洋春季海温异常相关图 |
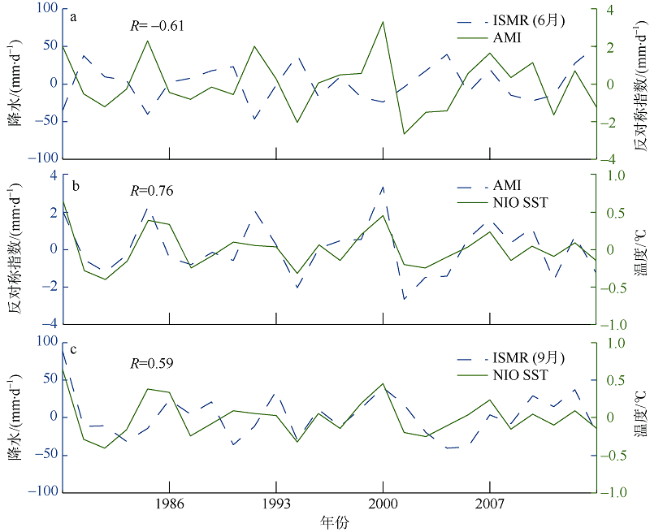
Fig. 7 Correlations of ISMR anomalies, AMI index and NIO SST anomalies. (a) ISMR (Jun) anomalies (blue dashed curve) and AMI index (green solid curve). (b) ISMR (Sep) anomalies (blue dashed curve) and NIO SST anomalies (green solid curve) in boreal spring (MAM). (c) AMI index (blue dashed curve) and NIO SST anomalies (green solid curve) in boreal spring (MAM)图7 夏季季风降水异常、反对称指数与北印度洋春季海温异常相关图 |
 (1)
(1) 、
、  为平均态的大气环流与水汽, V'、Q'为异常的大气环流与水汽。式右第一项为水汽输运的平均态, 第二项为异常环流对平均水汽的输运, 第三项为平均环流对水汽异常的输运, 第四项为异常环流对异常水汽的输运。通过前面的分析我们知道反对称模态和北印度洋二次增暖都可能对印度夏季降水异常有贡献, 因此我们重点计算第二项和第三项即环流异常对平均水汽的输运
  , 以及平均环流对水汽异常
  产生水汽输运, 分析它们对印度初夏与晚夏降水的影响进行分析。
 与风场异常的特征非常类似(
 场在印度大陆出现辐合, 到9月水汽通量的异常转为与夏季风方向相同, 说明环流异常造成的水汽输运对印度大陆降水的影响在初夏减少而晚夏增多, 这与前人的研究结果一致(Annamalai et al, 2005; Yang et al, 2007, 2012; Park et al, 2010)。对另一项水汽变化引起的水汽通量输运异常
  的分析发现(
Fig. 8 Regression of transport of specific humidity |
Fig. 9 Regression of transport of specific humidity |
 , 蓝线)在El Niño衰退年春季到初夏为辐散, 在晚夏为辐合; 而由水汽异常引起的水汽输运异常(
  , 红线)则基本与北印度洋增暖的特征同步, 在印度大陆夏季为辐合, 有利于局地降水的增加。我们同时还分析了总的水汽输送通量异常(
  , 黑线)在印度大陆的辐散异常, 发现与印度夏季降水异常的特征基本类似, 即初夏为辐散, 晚夏为辐合。对比,
  、
、  、
、  我们发现, 由环流异常引起的水汽通量的变化与总的水汽通量变化有很好的相似性, 在初夏, 印度降水的减少主要是异常环流场的作用。水汽的异常
  对印度夏季尤其是晚夏的降水有一定的贡献, 二者的共同作用造成了印度夏季降水在初夏的减少与晚夏的增加。
Fig. 10 Regression of divergence of specific humidity |
 )是影响印度夏季降水的主要因素。
The authors have declared that no competing interests exist.
| 1 |
|
| 2 |
|
| 3 |
|
| 4 |
|
| 5 |
|
| 6 |
|
| 7 |
|
| 8 |
|
| 9 |
|
| 10 |
|
| 11 |
|
| 12 |
|
| 13 |
|
| 14 |
|
| 15 |
|
| 16 |
|
| 17 |
|
| 18 |
|
| 19 |
|
| 20 |
|
| 21 |
|
| 22 |
|
| 23 |
|
| 24 |
|
| 25 |
|
| 26 |
|
| 27 |
|
| 28 |
|
| 29 |
|
| 30 |
|
| 31 |
|
| 32 |
|
| 33 |
|
| 34 |
|
/
| 〈 |
|
〉 |


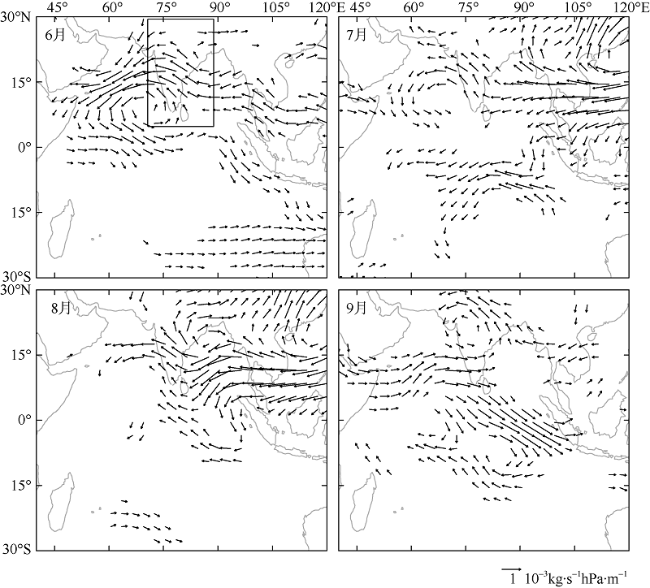
 on NDJ Niño3.4 index at 850 hPa (units: 10-3kg•s-1•hPa-1•m-1) during June-September. Vectors are plotted only where the length of the vector exceeds 0.3 (units: 10-3kg•s-1•hPa-1•m-1)
 对冬季Niño3.4数回归分布
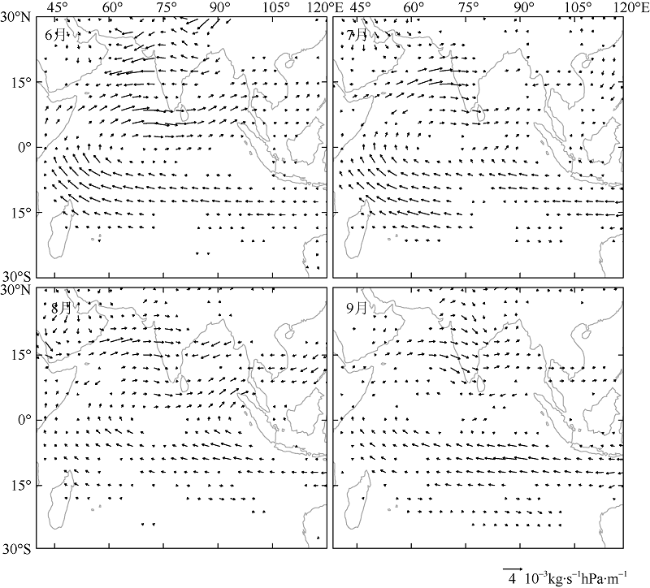
 on Niño3.4 index at 850 hPa during June-September. Vectors are plotted only where the length of the vector exceeds 0.3
 对冬季Niño3.4指数回归分布
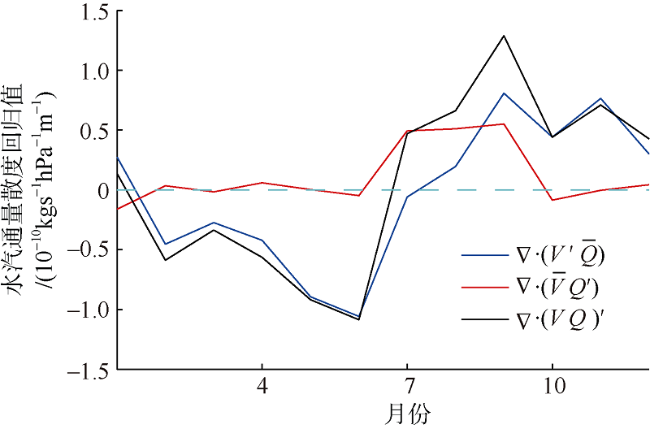
 (red line),
  (blue line) and
  (black line) on Niño3.4 index. The positive value means convergence
 (红线)、异常风场与平均水汽
 (蓝线)、水汽通量异常(
 )的散度(黑线)对Niño3.4指数的回归(正值表示辐合)