
Journal of Tropical Oceanography >
OBS seismic data processing of the Manila Trench subduction zone (21°N) and some preliminary results
Received date: 2016-06-16
Request revised date: 2016-08-30
Online published: 2017-04-06
Supported by
Natural Science Foundation of China (91428204, 41376063, 41449908, 41576070)
Natural Science Foundation of China Open Research Cruise (NORC2015-08)
Strategic Priority Research Program of the Chinese Academy of Science (XDB06030202 )
Copyright
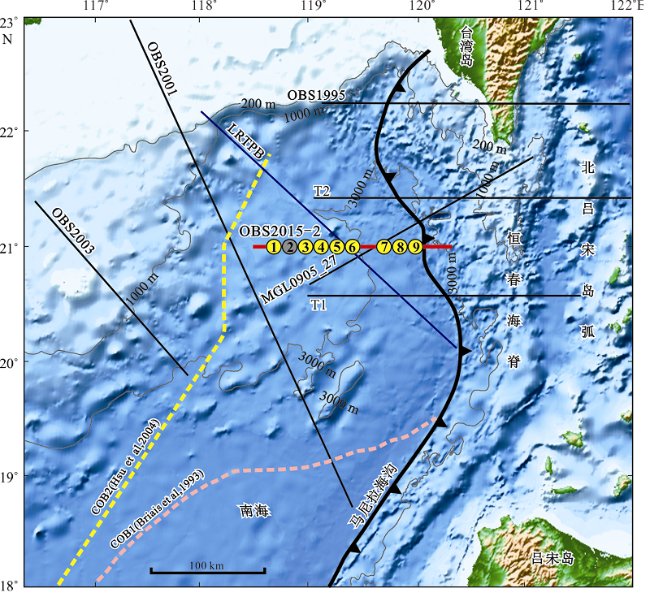
A two-dimensional ocean bottom seismometer (OBS) survey line (OBS2015-2) was carried out in 2015, which was an E-W trending and located in the front of the Manila Trench subduction zone. In this study, we take two OBS stations (OBS04 and OBS08) as examples to introduce the data processing flow for this short-period OBS type of data. The process includes data format transforming from original RAW data to SAC format and then to SEGY format; and it contains shot relocation and OBS position relocation. The preliminary results of data processing demonstrate that the OBS data are of high quality in this experiment. The seismic phases, such as PsP, Pg, PmP, etc. are very clear along the OBSs’ seismic record sections. They are further identified by the forward modeling using the Rayinvr software. Especially, the reflective seismic phases from the Moho interface are abundant and obvious in the incoming plate along the Manila Trench subduction zone, which will provide good constraints for the crustal bottom of the incoming plate.
LIU Siqing , ZHAO Minghui , ZHANG Jiazheng , SUN Longtao , XU Ya , ZHAN Wenhuan , QIU Xuelin . OBS seismic data processing of the Manila Trench subduction zone (21°N) and some preliminary results[J]. Journal of Tropical Oceanography, 2017 , 36(2) : 60 -69 . DOI: 10.11978/2016058
Fig. 1 The bathymetry map (shading) and location of OBS2015-2 line near the Manila Trench subduction zone. |
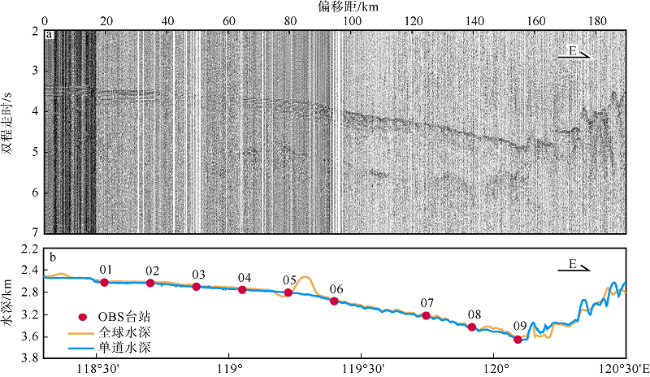
Fig. 2 Single-channel seismic profile along OBS2015-2 (a), and contrasts on water depths extracted from single-channel seismic profile (in blue) and from the 30″×30″ global topographic data (in yellow) (b)图2 单道地震剖面(a)及单道地震剖面水深(蓝色)与30″×30″精度全球水深数据(黄色)对比(b) |
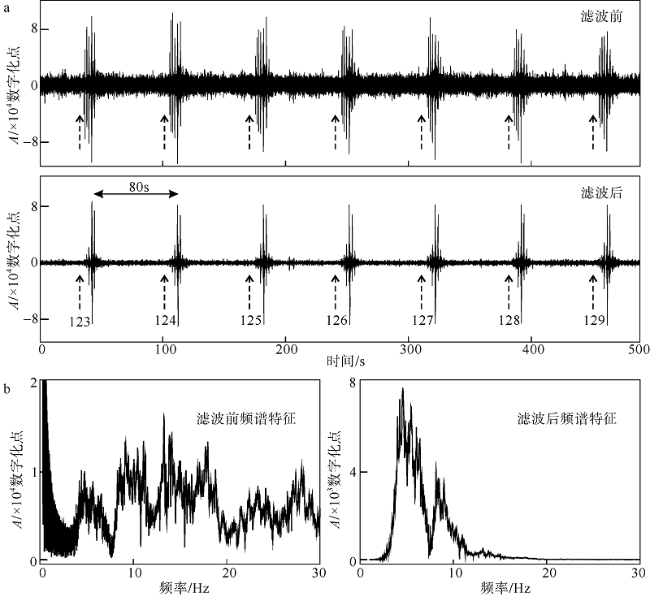
Fig. 3 Shot signal contrasts before and after filtering (a) and spectrum of the 126th shot signal before and after filtering (b). A indicates the digital amplitude. The initial time of the 123th-129th shot signals is 2015-08-13T15:54:13.206图3 OBS04台站滤波前后SAC气枪信号对比(a)及第126炮气枪信号滤波前后频谱图(b) |
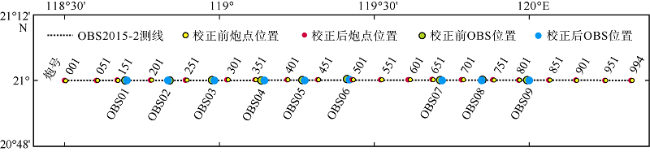
Fig. 4 Shot point locations and OBS locations before and after relocation图4 炮点位置与OBS位置校正前后位置图 |
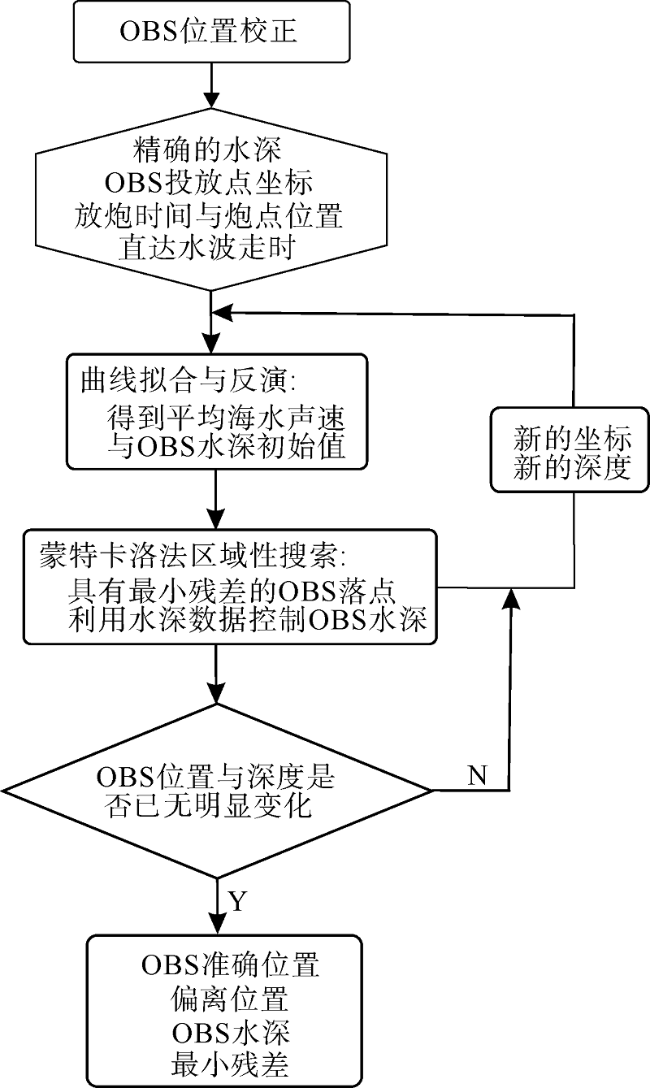
Fig. 5 OBS relocation flow by the Monte-Carlo method图5 蒙特卡洛法位置校正流程 |
Fig. 6 OBS relocation using the Monte-Carlo method (taking OBS04 as an example). a) OBS04 position and water depth; b) theoretical travel time and absolute travel time after relocation; c) searching the minimum residual error; d) theoretical travel-time and absolute travel-time residual error plot图6 蒙特卡洛法位置校正实例(OBS04台站) |
Fig. 7 Contrast of direct water phases (Pw) before and after correction of OBS04图7 OBS04台站直达水波震相Pw校正前后对比 |
Tab. 1 Relocation parameters of OBS stations along the line OBS2015-2表1 OBS2015-2测线OBS位置校正结果及校正参数表 |
| OBS站位 | 回收点位置 | 校正后位置 | Vw /(km·s-1) | 校正后水深/km | 单道水深/km | RMS/s | 偏移距 /km | ||
|---|---|---|---|---|---|---|---|---|---|
| 东经/º | 北纬/º | 东经/º | 北纬/º | ||||||
| 01 | 118.69265 | 21.00089 | 118.69188 | 21.00094 | 1.500 | 2605.69 | 2625.75 | 0.005 | 0.0801 |
| 02 | 118.83431 | 21.00134 | — | — | — | — | — | — | — |
| 03 | 118.98173 | 21.00177 | 118.98016 | 21.00130 | 1.502 | 2680.61 | 2704.50 | 0.019 | 0.1668 |
| 04 | 119.12634 | 21.00227 | 119.12363 | 21.00101 | 1.506 | 2723.99 | 2755.50 | 0.007 | 0.3113 |
| 05 | 119.27071 | 21.00244 | 119.26883 | 21.00141 | 1.483 | 2857.85 | 2809.50 | 0.011 | 0.2224 |
| 06 | 119.41483 | 21.00222 | 119.41351 | 21.00420 | 1.500 | 2930.82 | 2958.75 | 0.009 | 0.2557 |
| 07 | 119.70419 | 21.00212 | 119.70301 | 21.00114 | 1.502 | 3193.43 | 3213.75 | 0.007 | 0.1668 |
| 08 | 119.84892 | 21.00189 | 119.84903 | 21.00217 | 1.499 | 3418.00 | 3399.00 | 0.006 | 0.0332 |
| 09 | 119.99337 | 21.00018 | 119.99345 | 21.00204 | 1.500 | 3615.60 | 3660.75 | 0.009 | 0.2113 |
注: Vw为反演过程所得到的海水声速, 单道水深为单道控制下通过反演得出OBS落点位置所对应的深度值, RMS为走时残差均方根, OBS02数据损坏未处理。 |
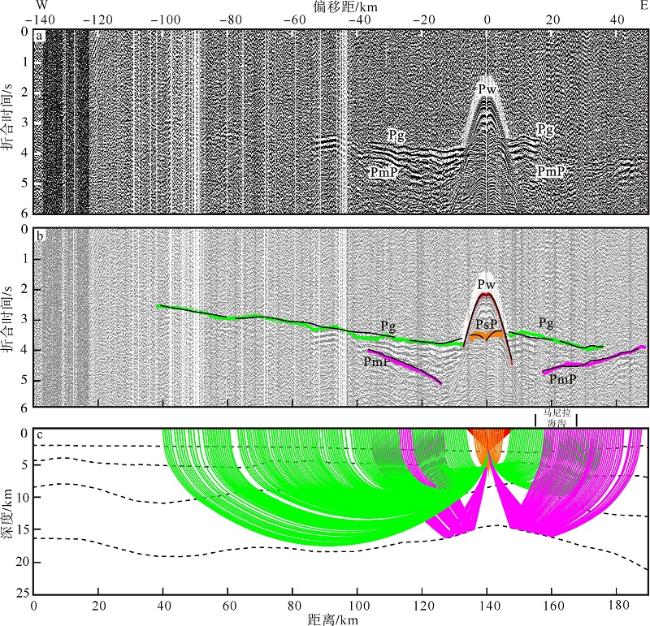
Fig. 8 Travel-time simulation and ray tracing of OBS04. a) Vertical component seismic record profile (the reduced velocity is 6.0 km·s-1); b) observed travel-time curves (color lines) and calculated travel-time curves (black lines), Pw-direct water-wave phase, PsP-basement reflection phase, Pg-refraction phase within the crust, and PmP-Moho reflection phase; c) P-wave model and ray-tracing simulation. The traveling paths with different colors correspond to different calculated travel-time curves图8 OBS04台站垂直分量震相识别与射线追踪(台站位置见 |
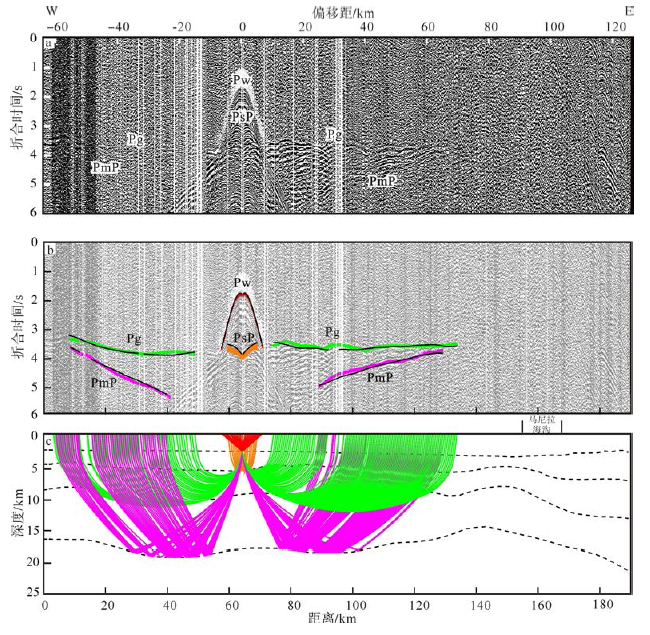
Fig. 9 Travel-time simulation and ray tracing of OBS08. Other legends are the same as those in |
The authors have declared that no competing interests exist.
| 1 |
|
| 2 |
|
| 3 |
|
| 4 |
|
| 5 |
|
| 6 |
|
| 7 |
|
| 8 |
|
| 9 |
|
| 10 |
|
| 11 |
|
| 12 |
|
| 13 |
|
| 14 |
|
| 15 |
|
| 16 |
|
| 17 |
|
| 18 |
|
| 19 |
|
| 20 |
|
| 21 |
|
| 22 |
|
| 23 |
|
| 24 |
|
| 25 |
|
| 26 |
|
/
| 〈 |
|
〉 |


