
Journal of Tropical Oceanography >
Study on the tidal dynamics in Daya Bay, China — Part I. Observation and numerical simulation of tidal dynamic system
Received date: 2016-08-23
Request revised date: 2016-09-22
Online published: 2017-06-01
Supported by
Major State Basic Research Development Program (2015CB452905)
China Postdoctoral Science Foundation (2015T80742)
Copyright
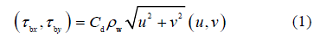
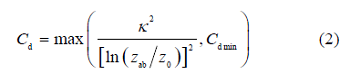
This paper is the first part of our studies on the tidal dynamics in Daya Bay (DYB), China. It illustrates the recent field work results. We establish a three-dimensional, fine resolution, unstructured grid, coastal ocean model to reproduce the tides in DYB. The combination of observation and simulation in this paper gives a better description on the tidal dynamic system in DYB than previous studies. Shallow water tides, especially the sexta-diurnal tides increase fast in DYB, which become the most notable characteristic of DYB tidal dynamic system. In the Fanhe Harbour at the northeastern DYB, the amplitude of M6 tide reaches the maximum, at the same order as M4 and S2 tides. In the open sea outside DYB, the tidal current is dominated by a rotating shape; but once the current enters the bay, it turns to rectilinear quickly. In the main tidal channels, the magnitude of M6 tidal current is even larger than those of M4 and K1 tides. The distribution of tidal energy flux indicates larger tidal energy dissipation for higher frequency tides. In DYB, both the tidal energy dissipation rate and the net tidal energy dissipated in a semi-diurnal period are much larger by M6 tide than by M4, M2 and K1 tides. The observed Euler residual currents show different spring-neap variation in magnitude inside DYB, and reveal the influence of the coastal current outside the bay. The numerical simulation shows a multi-vortex of residual current, and indicates poor water exchange in the bay.
WU Wen , YAN Yuhan , SONG Dehai . Study on the tidal dynamics in Daya Bay, China — Part I. Observation and numerical simulation of tidal dynamic system[J]. Journal of Tropical Oceanography, 2017 , 36(3) : 34 -45 . DOI: 10.11978/2016078
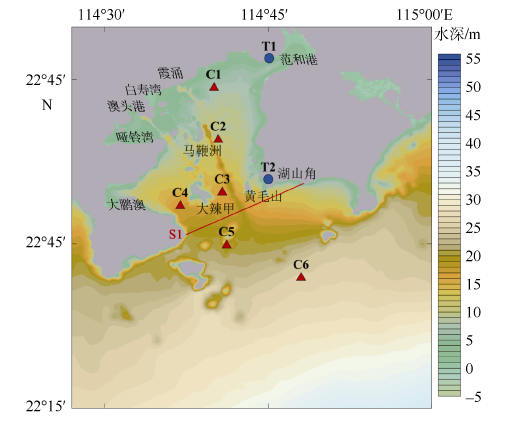
Fig. 1 Bathymetry map of Daya Bay. T1 and T2 indicate tidal elevation stations, C1-C6 indicate tidal current stations, and S1 is the section used for calculating tidal energy flux.图1 大亚湾地形图^T1和T2为水位站; C1~C6为海流站; S1为潮能通量计算断面 |
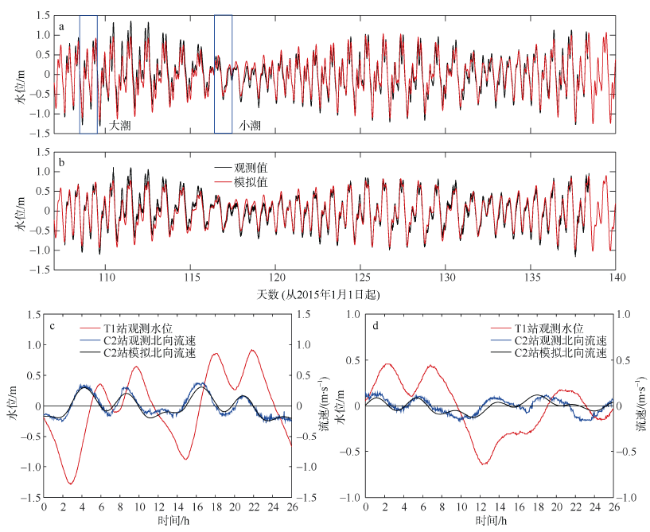
Fig. 2 Observed and simulated water levels and tidal-current velocity. (a) Time series of observed and simulated water level at Station T1, and (b) at Station T2. (c) Observed and simulated vertically-averaged northward tidal-current velocity at Station C2 of spring tides, and (d) of neap tides, with the measured water level at Station T1 used as reference图2 观测与模拟的水位和流速曲线^a. T1站实测和模拟水位序列; b. T2站实测和模拟水位序列; c. 大潮期间实测和模拟的C2站北向垂向平均流速(涨潮为正), 同时给出对应时刻T1站水位序列; d.小潮期间实测和模拟的C2站北向垂向平均流速(涨潮为正), 同时给出对应时刻T1站水位序列。图a蓝色方框中为图c对应的大潮期间水位和图d对应的小潮期间水位 |
Tab. 1 Harmonic constants for the main tides at stations T1 and T2表1 T1和T2站主要分潮的调和常数 |
| 分潮 | T1 | T2 | ||
|---|---|---|---|---|
| 振幅 /cm | 迟角/º | 振幅/cm | 迟角/º | |
| O1 | 27.62 | 245.4 | 27.28 | 244.1 |
| K1 | 33.46 | 296.4 | 32.93 | 294.0 |
| M2 | 36.71 | 257.0 | 33.58 | 254.0 |
| S2 | 14.79 | 286.2 | 13.77 | 283.7 |
| M4 | 13.17 | 288.5 | 8.98 | 280.1 |
| MS4 | 10.81 | 341.7 | 7.22 | 333.3 |
| M6 | 10.80 | 107.0 | 3.83 | 89.9 |
| 2MS6 | 10.69 | 175.2 | 3.78 | 159.2 |

 , 其中: F代表潮汐特征值; a代表分潮振幅]。半日分潮(M2和S2)振幅与全日分潮(O1和K1)振幅相当, 四分之一日分潮(M4和MS4)和六分之一日分潮(M6和2MS6)在T1站较为显著。调和常数在T2站与T1站之间的变化展现了潮波从湾口传播到湾顶过程中的形变。在这一过程中, 半日分潮中M2分潮振幅增长了9.3%, S2分潮振幅增长了7.4%; 四分之一日分潮中M4和MS4分潮振幅分别增长了46.7%和49.7%; 增幅最为显著的是六分之一日分潮, M6和2MS6分潮振幅分别增大了182.0%和183.4%, 到T1站六分之一日分潮的振幅已经与MS4分潮振幅相当, 超过M4分潮的75%, 接近M2分潮的30%。相对而言, 全日分潮振幅在传播过程中仅增长了约1%。可见大亚湾潮波系统的特征之一为六分之一日分潮振幅的成倍提升, 其主要原因为高频分潮共振。六分之一日分潮共振现象只存在于南海北部陆架区域的大亚湾及其邻近的大鹏湾, 其中大亚湾的共振现象更为明显, 主要由地形特征决定(Song et al, 2016)。
Fig. 3 Vertically-averaged current vector (black arrows) and Euler residual current vector (red arrows) on spring tide (a) and neap tide (b), respectively. Numbers indicate the magnitude of Euler residual current图3 大潮(a)和小潮(b)期间垂向平均海流矢量(黑色)和欧拉余流矢量(红色) |
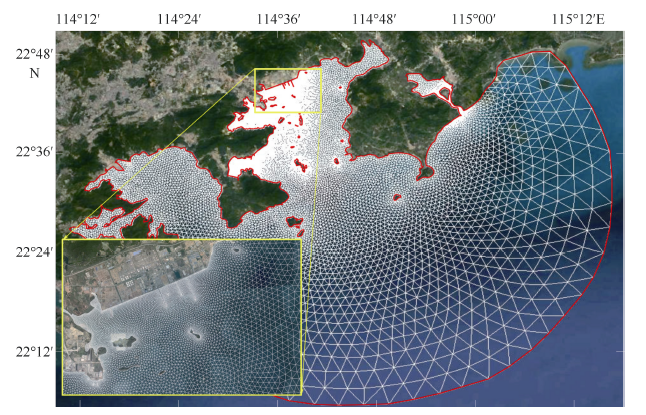
Fig. 4 Mesh grid of the Daya Bay model used in this study, and the basemap obtained from Google Earth图4 大亚湾模型网格示意图, 底图取自谷歌地球 |

Tab. 2 Errors of harmonic constants for the main tides between observation and simulation at stations T1 and T2表2 T1和T2站主要分潮调和常数模拟误差 |
| 分潮 | T1 | T2 | ||||
|---|---|---|---|---|---|---|
| 振幅/cm | 迟角/º | Diff/cm | 振幅/cm | 迟角/º | Diff/cm | |
| O1 | -0.11 | 0.10 | 0.11 | 0.12 | 0.30 | 0.17 |
| K1 | -0.78 | 0.80 | 0.93 | -0.25 | -0.20 | 0.26 |
| M2 | -0.22 | 0.20 | 0.24 | 0.11 | 0.20 | 0.17 |
| S2 | -0.29 | -0.70 | 0.35 | 0.08 | 0.60 | 0.16 |
| M4 | 0.09 | -0.20 | 0.10 | -0.01 | 0.40 | 0.07 |
| MS4 | 0.10 | -0.50 | 0.13 | -0.02 | 0.90 | 0.12 |
| M6 | -0.01 | 0.40 | 0.09 | -0.02 | -0.90 | 0.06 |
| 2MS6 | -0.25 | -0.50 | 0.27 | -0.02 | -0.10 | 0.02 |
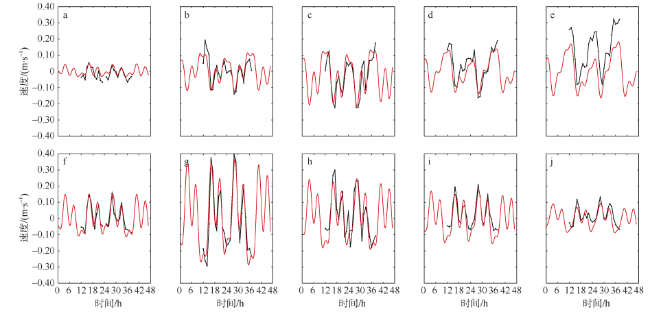
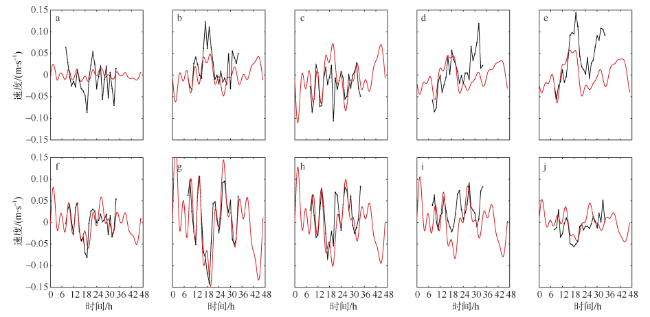
Fig. 5 Comparison between simulated (red) and observed (black) currents during spring tides (u in the top panels and v in bottom panels)图5 大潮期模拟潮流(红色)与实测资料(黑色)对比^上排为东西向分量: a. C1; b. C3; c. C4; d. C5; e. C6。下排为南北向分量: f. C1; g. C3; h. C4; i. C5; j. C6 |
Fig. 6 Comparison between simulated (red) and observed (black) currents during neap tides (u in the top panels and v in bottom panels)图6 小潮期模拟潮流(红色)与实测资料(黑色)对比^上排为东西向分量: a. C1; b. C3; c. C4; d. C5; e. C6。下排为南北向分量: f. C1; g. C3; h. C4; i. C5; j. C6 |
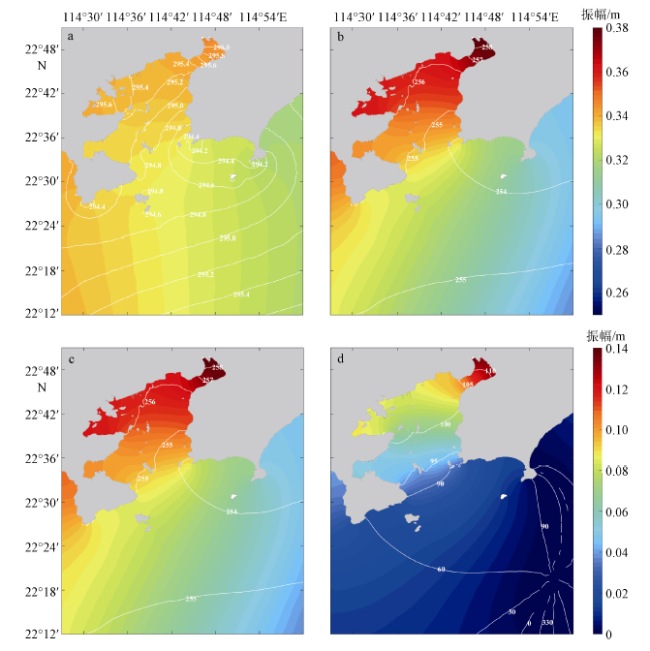
Fig. 7 Co-tidal charts for (a) K1, (b) M2, (c) M4, and (d) M6 with colors for amplitude (units: m) and white lines for phase (units: °).图7 K1 (a)、M2 (b)、M4 (c)、M6 (d)分潮同潮图^填色表示振幅(单位: m); 白线表示迟角(单位: °) |
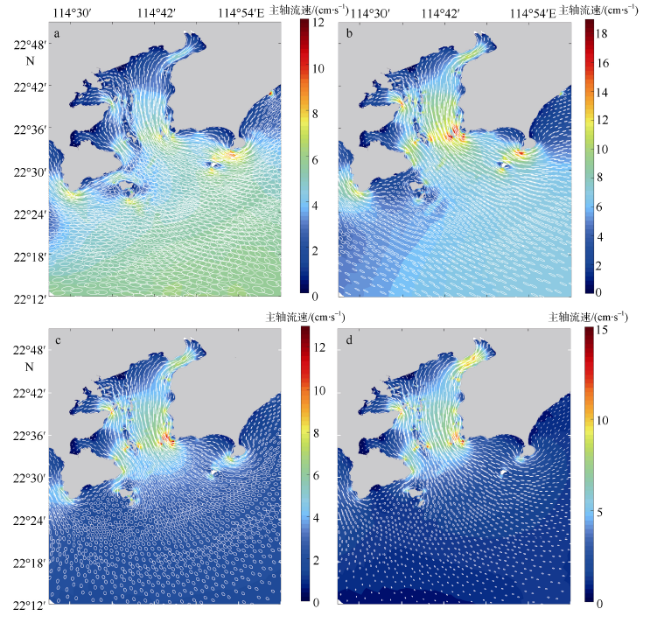
Fig. 8 Tidal current ellipse for (a) K1, (b) M2, (c) M4, and (d) M6 with colors for major-axis length (units: cm·s-1)图8 K1(a)、M2(b)、M4(c)、M6(d)分潮潮流椭圆分布^填色表示主轴流速(单位: cm·s-1); 白色椭圆表示潮流形态 |
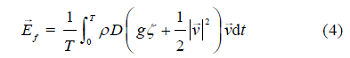
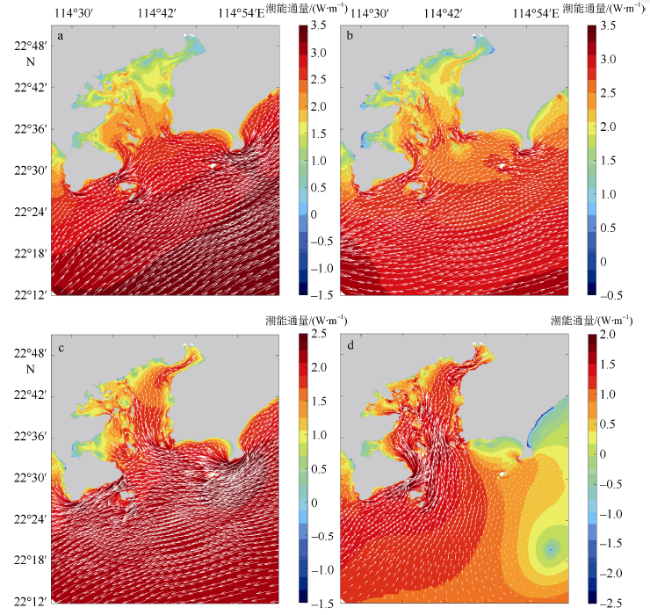
 是速度矢量(单位: m·s-1); ζ代表水位(单位: m); D = H + ζ, H是水深(单位: m); g是重力加速度(单位: m·s-2); ρ是水体密度(单位: kg·m-3); t是时间(单位: s); T代表一个潮周期(单位: s)。研究区域内K1、M2、M4和M6分潮的潮能通量如
Fig. 9 Tidal energy flux for (a) K1, (b) M2, (c) M4, and (d) M6 with colors for magnitude (units: W·m-1) in logarithm based on 10图9 K1 (a)、M2 (b)、M4 (c)、M6 (d)分潮潮能通量分布, 强度用以10为底的对数表示(单位: W·m-1) |
Fig. 10 (a) Vertically-averaged Euler residual currents with colors for magnitude of spring tide (units: cm·s-1) in logarithm based on 10. (b) Same as (a), except for neap tide. The black dots indicate in-situ tidal current stations图10 垂向平均的欧拉余流分布, 大小用以10为底的对数表示(单位: cm·s-1)^a. 大潮期间; b.小潮期间。黑点为观测期间布设的潮流站 |
The authors have declared that no competing interests exist.
| [1] |
|
| [2] |
|
| [3] |
|
| [4] |
|
| [5] |
|
| [6] |
|
| [7] |
|
| [8] |
|
| [9] |
|
| [10] |
|
| [11] |
|
| [12] |
|
| [13] |
|
| [14] |
|
| [15] |
|
| [16] |
|
| [17] |
|
| [18] |
|
/
| 〈 |
|
〉 |


