
Journal of Tropical Oceanography >
Seasonal variability of sea surface salinity in tropical Southern Indian Ocean based on Argo and Aquarius observations
Received date: 2017-01-02
Request revised date: 2017-02-28
Online published: 2017-07-26
Supported by
National Natural Science Foundation of China (41525019, 41506019)
“Global Changes and air-sea interaction” of State Oceanic Administration (GASI-IPOVAI-02)
Independent Project of State Key Laboratory of Tropical Oceanography (South China Sea Institute of Oceanology, Chinese Academy of Sciences) (LTOZZ1501)
Copyright
Based on the monthly mean data of Argo and Aquarius satellite observations, we analyze the seasonal variation of sea surface salinity (SSS) in the tropical South Indian Ocean. The results show that the SSS has significant seasonal variation characteristics, that is, the SSS is lower in winter and higher in summer in the region of 60°-80°E, 5°-15°S. However, the center of anomalous SSS does not correspond to the center of anomalous precipitation. The seasonal variation of precipitation cannot explain the seasonal variation of SSS. Salinity budget analysis indicates that the ocean dynamics contribute to the seasonal variation of SSS. During the summer half of the year, the SSS increasing is attributed to the meridional advection transport high salinity from the equatorial region to the South Indian Ocean, as well as the entrainment strengthening from April to May. In the winter half of the year, precipitation increases, the northward currents transport low-salinity water induced by increasing precipitation to the study region, which favors the accumulation of low-salinity water in the region; at the same time, the westward zonal advection transports the low-salinity water from the Southeastern Indian Ocean to the west, both of which have important contributions to the decreasing SSS.
SUN Qiwei , DU Yan , ZHANG Yuhong . Seasonal variability of sea surface salinity in tropical Southern Indian Ocean based on Argo and Aquarius observations[J]. Journal of Tropical Oceanography, 2017 , 36(4) : 25 -34 . DOI: 10.11978/2017002
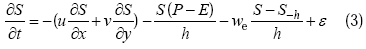
 , ε为误差项。与以前的工作不同的是, 本文不仅考虑了进入混合层对盐度的影响, 同时也考虑了从混合层出去对盐度的影响, Kim 等(2006)系统阐述了其闭合性, 其中w-h为混合层底的垂向卷夹速度, 可以由连续方程
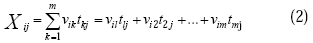
 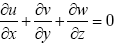 , 在z方向从-h到0积分, 即
 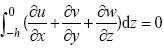 , 可得
, 可得 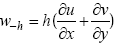 。另外, 在计算Aquarius盐度收支方程时, 混合层底盐度数据采用同时期的Argo混合层底的盐度数据。
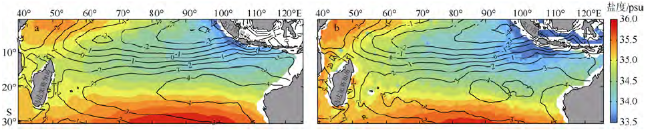
Fig. 1 Annual mean sea surface salinity (shading; units: psu) and freshwater flux (evaporation minus precipitation, contour; units: mm·d-1) of Argo (a) and Aquarius (b)图1 年平均海表盐度(填色)和淡水通量(蒸发减降水, 等值线, 单位: mm·d-1) a. Argo数据; b. Aquarius数据 |
Fig. 2 Seasonal standard deviation and first mode of sea surface salinity (shading; units: psu) and freshwater flux (contour; units: mm/day). a) Seasonal standard deviation of Argo; b) Seasonal standard deviation of Aquarius; c) the first mode for Argo; d) the first mode for Aquarius; e) time coefficient of the first mode for Argo; f) time coefficient of the first mode for Aquarius图2 海表盐度(填色)、淡水通量(等值线, 单位: mm·d-1)的季节标准差和EOF第一模态空间分布图及时间序列 a. Argo的季节标准差; b. Aquarius的季节标准差; c. Argo的EOF第一模态; d. Aquarius的EOF第一模态; e. Argo的EOF第一模态时间变化系数; f. Aquarius的EOF第一模态时间变化系数 |
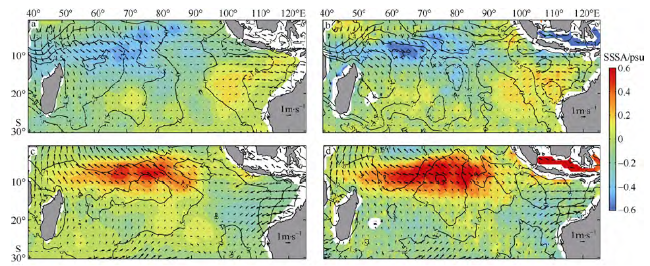
Fig. 3 Spatial distribution of anomalous SSS (shading; units: psu), freshwater flux (contour; units: mm·d-1) and wind (vector; units: m·s-1). a) Anomalous SSS in March; anomalous freshwater flux and wind in January using Argo data. b) Same as a), except using Aquarius data. c) Anomalous SSS in August; anomalous freshwater flux and wind in June using Argo data. d) Same as c), except using Aquarius data图3 海表盐度异常(填色)、淡水通量异常(等值线, 单位: mm·d-1)以及风场异常(矢量, 单位: m·s-1)的空间分布图 a. 3月份Argo的海表盐度异常, 1月份淡水通量及风场异常; b. 3月份Aquarius的海表盐度异常, 1月份淡水通量及风场异常; c. 8月份Argo的海表盐度异常, 6月份淡水通量及风场异常; d. 8月份Aquarius的海表盐度异常, 6月份淡水通量及风场异常 |
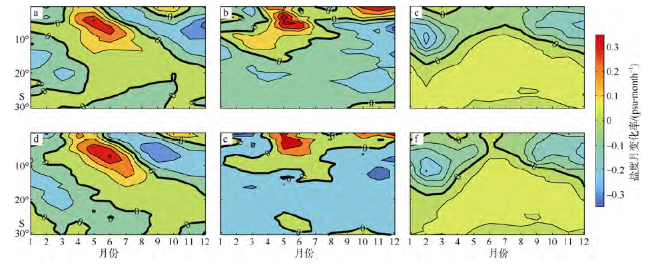
Fig. 4 Latitude-time section of salt budgets using Argo and Aquarius data: a) salinity tendency; b) sum of horizontal (zonal & meridional) advection and entrainment; c) freshwater flux图4 Argo及Aquarius盐度收支方程的时间—纬度分布图 a、d为盐度变化率; b、e为平流及垂向卷夹之和; c、f为淡水通量; 其中a、b和c为Argo结果, d、e和f为Aquarius结果 |
Fig. 5 Seasonal variation of regionally averaged salt budgets using Argo and Aquarius data图5 Argo及Aquarius盐度收支区域平均的季节变化 S/t代表盐度月变化率, SUM (right)代表盐度收支方程右侧各项之和, Residual为残余项, S-adv代表平流及垂向卷夹之和, FWF代表淡水通量, S-advx、S-advy和S-advz分别代表纬向输送、经向输送和垂直项的输送; a、b、c为Argo数据; d、e、f 为Aquarius卫星数据 |
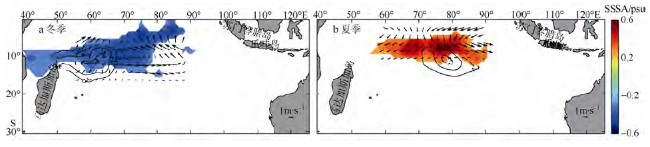
Fig. 6 Sketch of variation of anomalous SSS (shading), currents (vector) and precipitation (contour) of (a) winter and (b) summer图6 海表盐度异常(填色), 流场异常(矢量)、降水异常(等值线)示意图 |
The authors have declared that no competing interests exist.
| [1] |
|
| [2] |
|
| [3] |
|
| [4] |
|
| [5] |
|
| [6] |
|
| [7] |
|
| [8] |
|
| [9] |
|
| [10] |
|
| [11] |
|
| [12] |
|
| [13] |
|
| [14] |
|
| [15] |
|
| [16] |
|
| [17] |
|
| [18] |
|
| [19] |
|
| [20] |
|
| [21] |
|
| [22] |
|
| [23] |
|
| [24] |
|
| [25] |
|
| [26] |
|
| [27] |
|
| [28] |
|
| [29] |
|
| [30] |
|
/
| 〈 |
|
〉 |


