
Journal of Tropical Oceanography >
The seasonal and sporadic variation of the spreading of a small tropical river plume and its associated dynamics
Received date: 2016-10-24
Request revised date: 2017-02-10
Online published: 2017-07-26
Supported by
National Natural Science Foundation of China (40976052, 41576089)
Copyright
A small river plume is distinctly different from a large river plume, more controlled by the variation of river discharge and wind. Taking the Wanquan River plume in Hainan as an example, we focus on the seasonal variation of a small river plume and its response to a river flood event in this study. The dynamics of the plume is investigated through momentum balance analysis. The results indicate that the spreading of the Wanquan River plume features a conspicuously seasonal variability, with the spreading direction being mostly downstream during winter, and being offshore or upstream during summer. The spreading extent is the largest in August and the smallest in December and January. A two-day flood event can greatly increase the plume extent; however, the effect of this river flood quickly disappears, with a recovery time in the order of 3 days. The momentum balance shows the balance in the far-field region is mostly a geostrophic one in the normal direction, while it is dominated by pressure gradient and friction in the stream-wise direction. In the near-field region, the Coriolis force is negligible in the normal direction, which is greatly different from that in the mid-latitude river plume.
Key words: small river plume; seasonal variation; flood event; momentum balance; Hainan
ZHAO Junpeng , LI Yihan , GONG Wenping . The seasonal and sporadic variation of the spreading of a small tropical river plume and its associated dynamics[J]. Journal of Tropical Oceanography, 2017 , 36(4) : 67 -76 . DOI: 10.11978/2016106
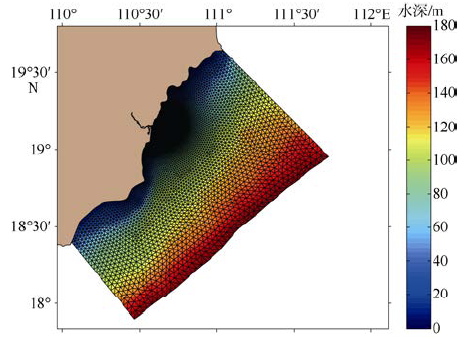
Fig. 1 The study area, model domain and bathymetry图1 研究区位置、模型网格及地形 |
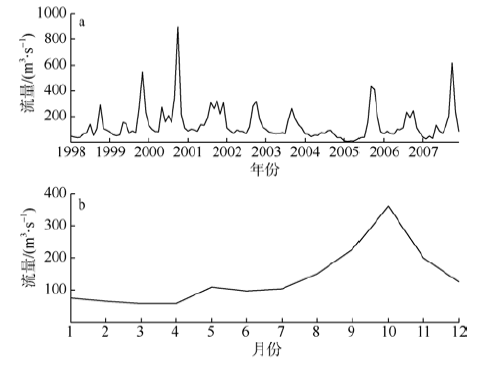
Fig. 2 (a) The monthly discharge from 1998 to 2007 measured and (b) the monthly averaged discharge at the Jiaji hydrologic station图2 (a)加积水位站1998—2007年期间的月流量序列; (b)加积水文站的月平均流量 |
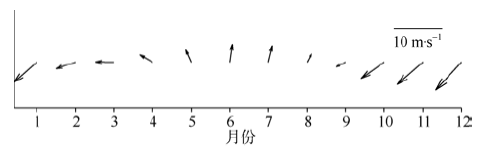
Fig. 3 Monthly averaged wind data at Boao station图3 博鳌地区的月平均风速风向 |
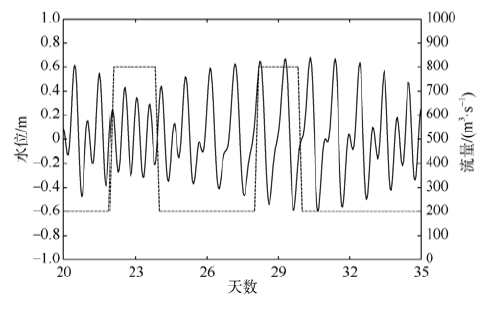
Fig. 4 The schematic of river discharge change. Curve line represents elevation, andfold line denotes discharge图4 数值实验的设置 曲线表示潮汐的变化, 折线表示径流量的变化 |
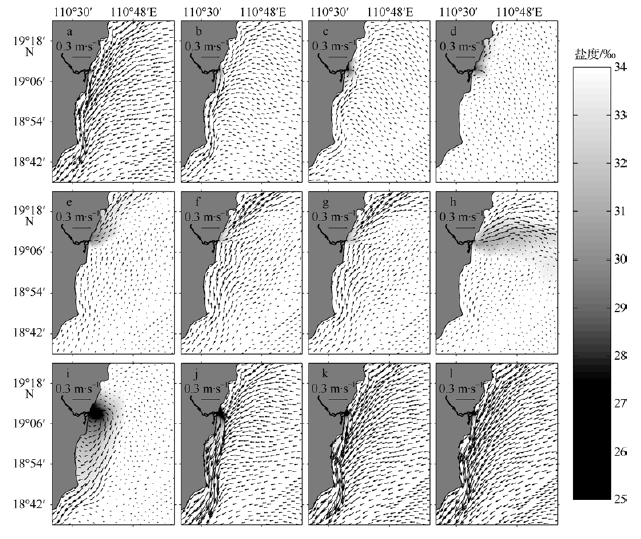
Fig. 5 Monthly averaged surface velocity overlain with salinity图5 每月平均的表层流场和表层盐度 |
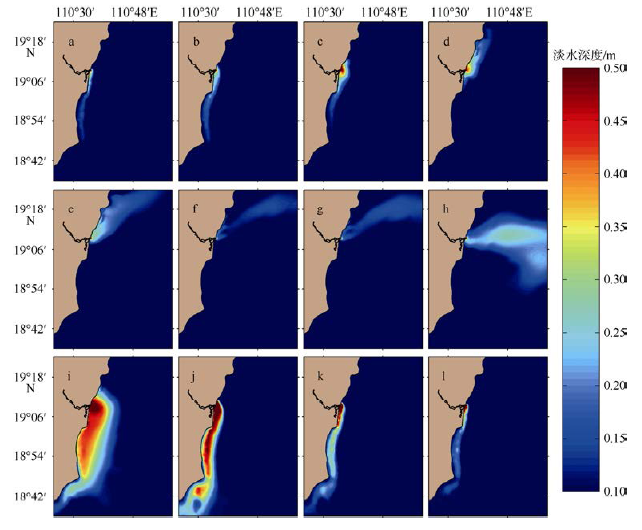
Fig. 6 Monthly-averaged freshwater depth图6 每月平均的淡水深度 |
Fig. 7 Vertically-integrated freshwater transport in Apr. (first column), Jul. (second column), Oct. (third column) and Jan. (last column). The panels in the first, second, third, and fourth rows are total freshwater flux, advection transport, vertical shear transport, and tidal pumping transport, respectively图7 4月(a、e、i、m), 7月(b、f、j、n), 10月(c、g、k、o)和1月(d、h、l、p)的淡水通量比较 自上向下依次为总通量、平流通量、垂向剪切通量和潮泵通量 |
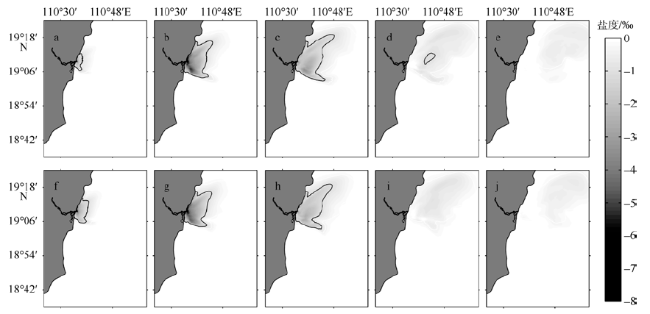
Fig. 8 Variation of surface salinity 1~5 days after discharge increases in spring tide (upper panels) and neap tide (bottom panels) when the wind is southwesterly. The black contour denotes the area where surface salinity reduction is larger than 1.0‰图8 西南风条件下, 小潮期洪水(上)和大潮期洪水(下)条件下1~5天后表层盐度的变化 黑线为表层盐度减小值大于1.0‰的范围 |
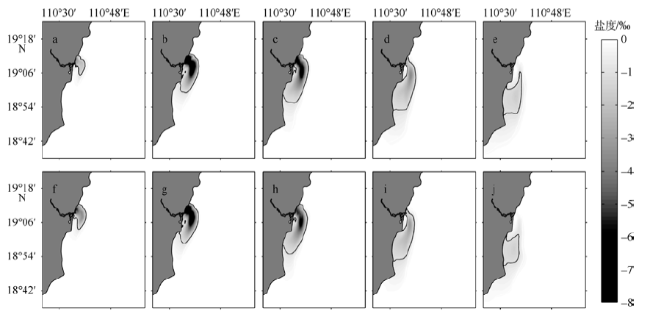
Fig. 9 Variations of surface salinity 1~5 days after discharge increases in spring tide (upper panels) and neap tide (bottom panels) when the wind is northeasterly. The black contour denotes the area where surface salinity reduction is larger than 1.0‰图9 东北风条件下, 小潮期洪水(上)和大潮期洪水(下)条件下1~5天后表层盐度的变化 黑线为表层盐度减小值大于1.0‰的范围 |
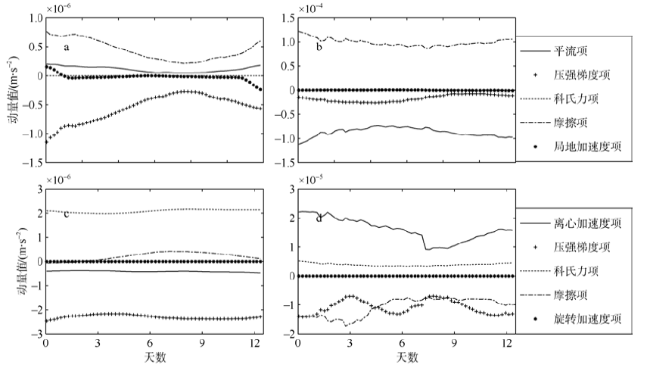
Fig. 10 Time series of the surface momentum balance of the plume. a: Stream-wise in the far-field; b: stream-wise in the near field; c: stream-normal in the far-field; and d: stream-normal in the near field图10 羽流区表层动量平衡项的时间序列分布 a: 远场s向; b: 近场s向; c: 远场n向; d: 近场n向 |
The authors have declared that no competing interests exist.
| [1] |
|
| [2] |
|
| [3] |
|
| [4] |
|
| [5] |
|
| [6] |
|
| [7] |
|
| [8] |
|
| [9] |
|
| [10] |
|
| [11] |
|
| [12] |
|
| [13] |
|
| [14] |
|
| [15] |
|
| [16] |
|
| [17] |
|
| [18] |
|
| [19] |
|
| [20] |
|
| [21] |
|
| [22] |
|
| [23] |
|
| [24] |
|
/
| 〈 |
|
〉 |

