
Journal of Tropical Oceanography >
Seasonal variation of Guangdong coastal thermal front based on merged satellite data
Author:QIU Chunhua.E-mail: qiuchh3@mail. sysu.edu.cn
Received date: 2016-12-01
Request revised date: 2017-01-11
Online published: 2017-09-22
Supported by
National Key R&D Program of China (2017YFC0305804)
Young Scientists Fund of the National Natural Science Foundation of China (41406002)
Natural Science Foundation of Guangdong Province (2015A030313151)
Distinguished Young Teachers of Fundamental Research Funds for the Central Universities (17lgzd11)
Copyright
Based on the Operational Sea Surface Temperature and Sea Ice Analysis (OSTIA) data in 2015, we analyzed the seasonal variation and genesis mechanisms of thermal fronts in Guangdong coastal zone. The Guangdong coastal thermal fronts are strong in winter and weak in summer. In the eastern Guangdong coastal zone, thermal fronts are seen all year round, while in the western Guangdong coastal zone, thermal fronts disappear in summer. In the Pearl River estuary zone, thermal fronts are associated with the Pearl River plumes, which extend east northward in summer and southward in autumn. We suggest wind speed play important roles in the genesis and disappearance of these thermal fronts. Using a simple model, we find that monsoon influences the front strength through air-sea turbulent heat fluxes. Under southwesterly (northeasterly) wind condition, warm and wet (cold and dry) air mass could decrease (increase) the latent heat release near the cold coastal zone, leading to a temperature increase in the cold zone, and finally the front disappears.
QIU Chunhua , CUI Yongsheng , HU Shiqi , HUO Dan . Seasonal variation of Guangdong coastal thermal front based on merged satellite data[J]. Journal of Tropical Oceanography, 2017 , 36(5) : 16 -23 . DOI: 10.11978/2016125
Fig. 1 Study area. Isobaths are water depths. Units: m图1 研究区域图 |

Fig. 2 New coordinates (dashed) and old coordinates (solid)图2 新、旧坐标系 |


 , 最终我们取最大梯度为锋面的梯度:
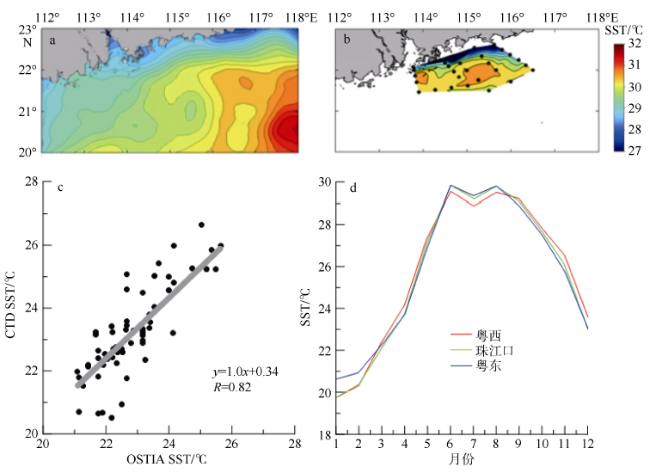
Fig. 3 OSTIA SST (a), in situ SST (b), scatter plots between OSTIA SST and in situ SST (c), and seasonal variation of zonal mean SST (d)图3 2015年 6月14日OSTIA海表温度数据(a)、现场观测数据(b)、观测数据与实测数据的散点图(c)以及不同区域海表温度的季节变化(d) |
Fig. 4 Spatial distributions of SST in (a) winter, (b) spring, (c) summer, and (d) autumn图4 海表温度空间分布 |
Fig. 5 The SST gradient magnitude from (a) maximum gradient method, and (b) gradient magnitude method on Jan. 8th, 2015. (c) Maximum gradient method, and (d) gradient magnitude method on May 3rd, 2015. Units: ℃·(5 km)-1图5 2015年1月8日梯度最大化方法(a)和普通梯度方法(b)以及5月3日梯度最大化方法(c)和普通梯度法(d)得到的温度梯度状况(色柱单位: ℃·(5km)-1) |
Fig. 6 Seasonal variation of SST gradient magnitude in (a) winter, (b) spring, (c) summer, and (d) autumn. Units: ℃·(5 km)-1图6 温度锋面分布图 |
Fig. 7 Monthly mean (a) SST gradient magnitude and (b) wind speed. The error bar stands for the standard deviation of SST gradient magnitude图7 粤东沿岸温度梯度(a)和风速大小(b)的季节变化 |

 为水汽压, qs(t)为饱和比湿, 其值由压强与海表温度给出。

Fig. 8 (a) Spatial distribution of SST, and (b) SST temporal variation at stations A and B. A and B stand for cold ad warm zones, respectively. Purple arrow stands for wind speed图8 温度的空间分布图(a)及变化趋势(b) |
The authors have declared that no competing interests exist.
| [1] |
|
| [2] |
|
| [3] |
|
| [4] |
|
| [5] |
|
| [6] |
|
| [7] |
|
| [8] |
|
| [9] |
|
| [10] |
|
| [11] |
|
| [12] |
|
| [13] |
|
| [14] |
|
| [15] |
|
| [16] |
|
| [17] |
|
| [18] |
|
| [19] |
|
| [20] |
|
| [21] |
|
| [22] |
|
| [23] |
|
| [24] |
|
| [25] |
|
/
| 〈 |
|
〉 |


