
Journal of Tropical Oceanography >
Simulation of CO2-EOR-S in an offshore sandstone reservoir with strong bottom water
Received date: 2017-01-06
Request revised date: 2017-03-28
Online published: 2017-09-22
Supported by
National Natural Science Foundation of China (41372256)
KeyLogic Project of U.S. Department of Energy
Copyright
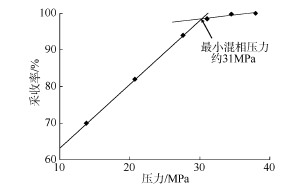
CO2 Enhanced Oil Recovery and Sequestration (CO2-EOR-S) is currently the most effective and economic technology for reducing CO2 emission from fossil fuels. To evaluate the CO2-EOR-S potential of M10 oil reservoir in the HZ21-1 oil field, we conducted a compositional simulation using Petrel and CMG-GEM reservoir simulators. We constructed a geological (including structures and facies) model first and then matched the oil production history and simulated CO2 injection in nine cases with different well patterns and bottom pressures. The results show that 1) the ratio of case number under miscible, near-miscible cases and immiscible conditions is 4︰3︰2, among which miscible flooding has the highest recovery factor (5.48%~8.73%) than the others and the Miscible Minimum Pressure (MMP) in M10 reservoir is about 31 MPa so that CO2 and oil could be near-miscible with oil under the condition of initial formation pressure; 2) the best case after CO2 injected five years is two injection wells with injection pressure at about 41 MPa, increasing oil recovery factor and cumulative oil production from 34.7% to 43.4% and 2.22×10⁶ to 2.78×10⁶ m3 respectively, while decreasing water cut from 96% to 59% with CO2 storage volume of 6.7 Mt, which takes 73% of the whole CO2 injection volume (9.2 Mt), and having a rate of CO2 storage on 1.33×10⁶ t·a-1; 3) when CO2 was injected through one single injection well, the effects on oil recovery factor and CO2 storage volume would be a negative relation while it would turn to a positive relation through two injection wells, which means more injection wells would increase oil recovery factor and carbon storage volume synchronously.
LIU Xueyan , LI Pengchun , ZHOU Di , LU Jiemin , CHEN Guanghao . Simulation of CO2-EOR-S in an offshore sandstone reservoir with strong bottom water[J]. Journal of Tropical Oceanography, 2017 , 36(5) : 72 -82 . DOI: 10.11978/2017005
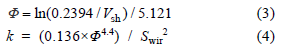
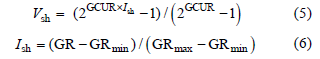
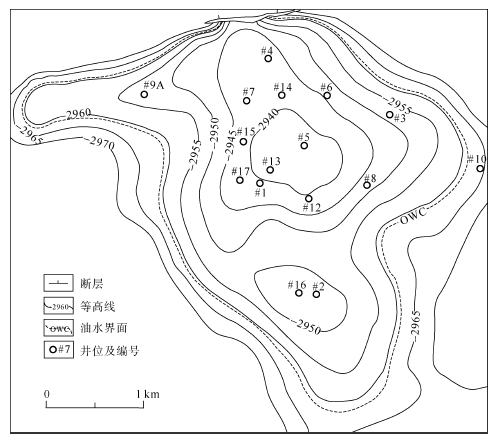
Fig. 1 Top map with contour line of M10 reservoir图1 M10层顶面构造等值线图(《中国油气田开发志》总编纂委员会, 2013) |
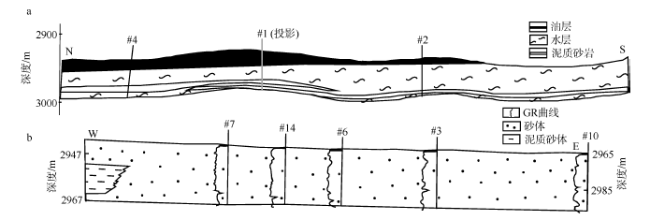
Fig. 2 NS reservoir profile (a) and WE cross well section (b) with Gamma Ray (GR) logs for M10 reservoir图2 M10层近南北向油藏剖面 (a) 和近东西向过井沉积剖面图 (b) |
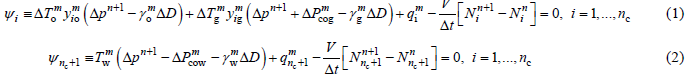
 为油相在m网格块的渗透性差,
  为气相在m的渗透性差,
  为水相在m网格块的渗透性; yij为j相中组分i的摩尔分数,
  是网格块m里油相中组分i的摩尔分数,
  是网格块m里气相中组分i的摩尔分数; Δp为压差,
  为目前压差; γ为比重或流动方程中的重力项,
  为网格块m中油相的比重,
  为网格块m中气相的比重,
  为网格块m中水相的比重; ΔD为深度差;
  为网格块m中的油气毛管力差,
  为网格块m中的油水毛管力差;
  为m中i的注采比; V为网格体积; Δt为时间差; nc为组分数; Ni (i=1, ... , nc)为i组分的摩尔数, 是孔隙度及油、气组分的密度和饱和度的函数,
  是水的摩尔数, 是孔隙度及水的密度和饱和度的函数, 两者均与孔隙摩尔密度、饱和度以及组分含量有关;
  为过去的i组分摩尔数,
  为现在的i组分摩尔数。
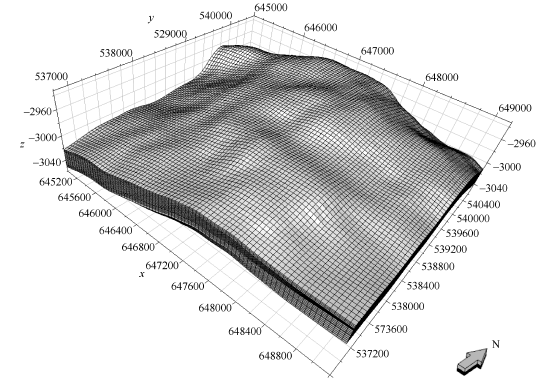
Fig. 3 Grids of M10 structural model图3 M10层构造模型网格剖分 |
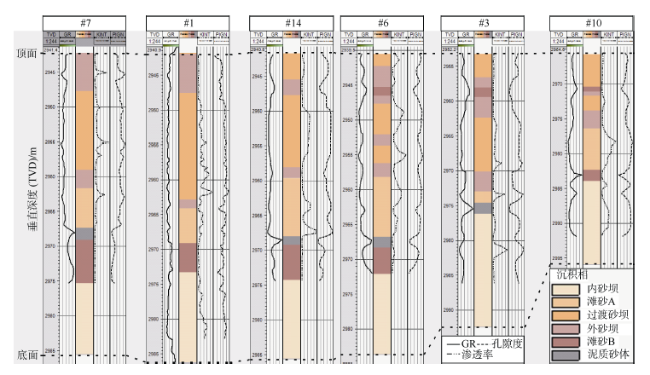
Fig. 4 Well section for M10 reservoir with logging interpretation results. Curves from left to right are GR, sub-facies, permeability and porosity, respectively. GR data of #1 were based on Peng et al (2013) and the other five GR curves are based on the General Editorial Committee of Oil and Gas Field Development in China (2013). The black horizontal dotted line marks the top and bottom of M10 reservoir图4 M10层连井剖面测井数据解释对比图 |
Tab.1 Comparison of main parameters between M10 model and experiment data表1 M10层三维地质模型主要参数与油藏实测数据对比列表 |
| 油藏 | 模型 | 误差/% | |
|---|---|---|---|
| 平均地层厚度/m | 40.2 | 41.7 | 4.23 |
| 平均孔隙度/% | 15.30 | 15.84 | 3.53 |
| 平均渗透率/μm2 | 0.205 | 0.212 | 3.41 |
注: 油藏数据引自文献《中国油气田开发志》总编纂委员会(2013)。 |
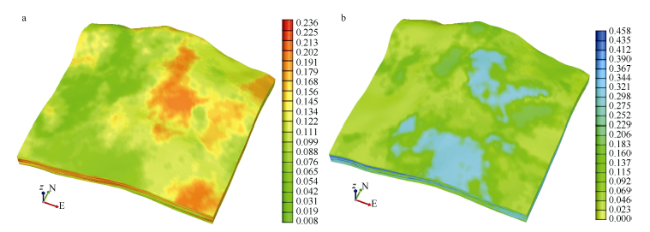
Fig. 5 3D model of porosity (a) and permeability (b) for M10 reservoir with z direction extended 10 times图5 M10层三维孔隙度(a)和渗透率(b)属性模型(z方向放大10倍) |
Tab.2 Lumping and mole fraction of the 8-component oil system for M10 model表2 M10模型中拟合归并的8组分原油成分 |
| 组分 | CO2 | C1 | C2 | C3 | C4 | C5 | C8 | C12+ |
|---|---|---|---|---|---|---|---|---|
| 含量/% | 3.09065 | 47.4423 | 6.9656 | 2.6121 | 2.6121 | 1.7414 | 20.3062 | 15.2297 |
| 摩尔质量/(g·mol-1) | 44.01 | 16.04 | 30.07 | 44.10 | 58.121 | 72.15 | 107.00 | 237.00 |
Fig. 6 Results of 1D slim tube simulation图6 一维细管试验模拟结果 |
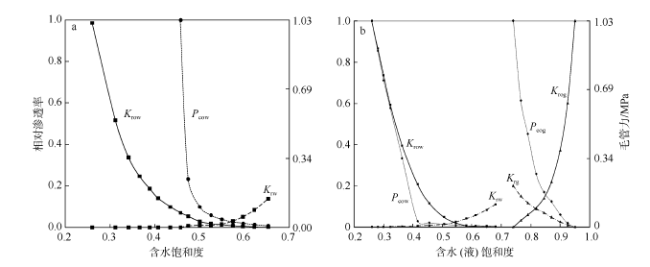
Fig. 7 Relative permeability curves of oil-gas-water phases and capillary curves based on field data (a) and modified process (b). Pcow is oil-water capillary pressure, Krw is relative permeability of water, Krow is oil relative water permeability, Pcog is gas-liquid capillary pressure, Krg is relative permeability of gas, and Krog is oil relative to gas permeability图7 油-水相对渗透率、毛管压力实测曲线 (a) 和调整结果 (b) |
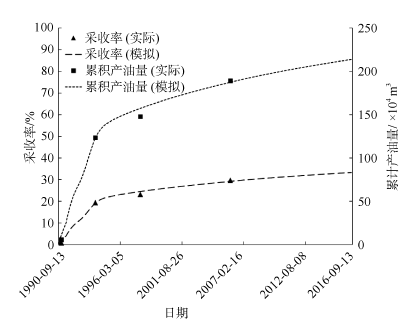
Fig. 8 History matching and production predicting curves of M10 component model. Individual data points are field production data based on the General Editorial Committee of Oil and Gas Field Development in China (2013), and the dotted line is matching results of numerical modeling图8 M10层组分模型历史拟合和生产阶段预测曲线 |
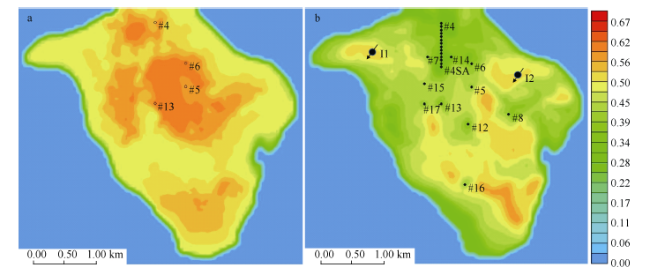
Fig. 9 Contour maps of simulated results. Oil saturation distribution in 1990 (a) and at the beginning of CO2 injection in 2016 (b). The black dots represent production wells with two designed CO2 injection wells of I1 and I2. The CO2-EOR-S simulated process begun in September 2016 after injection wells were opened图9 等值线模拟结果图 |
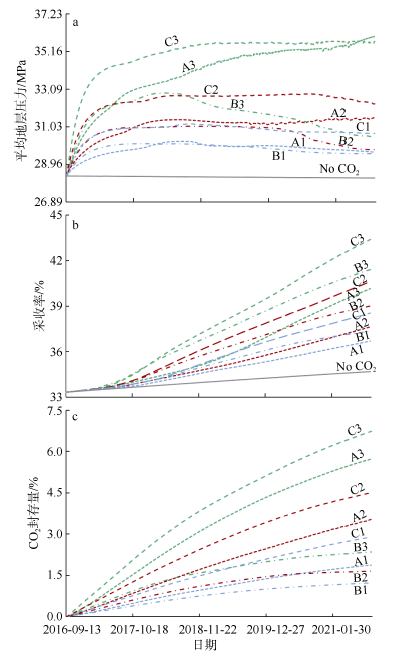
Fig. 10 Curves of average formation pressure (a), recovery ratio (b) and CO2 storage (c) for nine cases图10 模拟结果对比曲线 |
Tab.3 CO2 injection settings表3 CO2注入方案设置及结果统计表 |
| 编号 | 注入井 | 注入压力/MPa | 平均地层压力/MPa | 驱替 机制 | 注入速率/(PV·a-1) | 注入HCPV |
|---|---|---|---|---|---|---|
| A1 | I1 | 35 | 29.85 | 非混相 | 0.010 | 0.399 |
| A2 | I1 | 38 | 30.99 | 近混相 | 0.016 | 0.621 |
| A3 | I1 | 41 | 33.72 | 混相 | 0.023 | 0.905 |
| B1 | I2 | 35 | 29.79 | 非混相 | 0.009 | 0.342 |
| B2 | I2 | 38 | 30.41 | 近混相 | 0.012 | 0.489 |
| B3 | I2 | 41 | 31.67 | 混相 | 0.020 | 0.789 |
| C1 | I1&I2 | 35 | 30.94 | 近混相 | 0.015 | 0.594 |
| C2 | I1&I2 | 38 | 32.26 | 混相 | 0.022 | 0.865 |
| C3 | I1&I2 | 41 | 34.69 | 混相 | 0.031 | 1.252 |
注: 平均地层压力为CO2注入过程中地层的平均压力, 平均地层压力为注入一年后至注入结束时地层最高和最低压力的平均值; 采收率为注CO2驱的采收率; 采收率提高程度为相对于未注CO2驱的采收率增加百分比; 未注CO2时采收率为34.68%。 |
Tab.4 CO2 sequestration queuing of nine cases表4 各方案CO2封存量统计表格 |
| 编号 | 采收 率/% | 采收率提高程度/% | 累积CO2 注入量/Mt | 累积CO2 生产量/Mt | CO2封存 量/Mt |
|---|---|---|---|---|---|
| A1 | 36.69 | 2.01 | 2.581 | 0.767 | 1.814 |
| A2 | 37.64 | 2.96 | 4.241 | 0.776 | 3.466 |
| A3 | 40.16 | 5.48 | 6.650 | 0.984 | 5.665 |
| B1 | 37.35 | 2.67 | 2.195 | 1.034 | 1.161 |
| B2 | 39.01 | 4.33 | 3.293 | 1.687 | 1.606 |
| B3 | 41.41 | 6.73 | 5.593 | 3.298 | 2.295 |
| C1 | 38.56 | 3.88 | 3.874 | 1.034 | 2.840 |
| C2 | 40.64 | 5.96 | 5.969 | 1.520 | 4.450 |
| C3 | 43.41 | 8.73 | 9.222 | 2.558 | 6.663 |
注: 采收率为注CO2驱的采收率; 采收率提高程度为相对于未注CO2驱的采收率增加百分比(未注CO2时采收率为34.68%); 累积CO2注入量、生产量和封存量均为地表条件下。 |
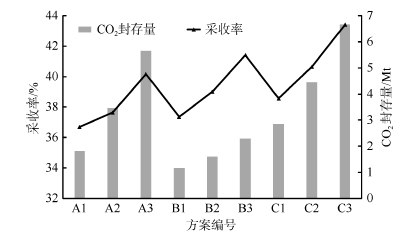
Fig. 11 Curves of CO2 storage mass and oil recovery factor for nine cases图11 各方案CO2封存量及采收率对比曲线 |
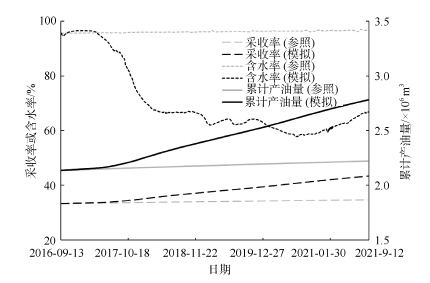
Fig. 12 Recovery factor, water cut and cumulative oil production curves of C3 case. The black line means stimulated results of CO2 injection, and the grey line is a reference with no CO2 injected. The curves of oil recovery factor, water cut and cumulative oil production correspond to long dashed, short dotted and solid lines, respectively图12 方案C3的采收率、含水率和累计产油量模拟结果曲线 |
The authors have declared that no competing interests exist.
| [1] |
|
| [2] |
|
| [3] |
|
| [4] |
|
| [5] |
|
| [6] |
|
| [7] |
|
| [8] |
|
| [9] |
|
| [10] |
|
| [11] |
|
| [12] |
|
| [13] |
|
| [14] |
|
| [15] |
|
| [16] |
|
| [17] |
|
| [18] |
|
| [19] |
|
| [20] |
《中国油气田开发志》总编纂委员会, 2013. 中国油气田开发志——南海东部油气区油气田卷[M]. 北京: 石油工业出版社.
|
| [21] |
|
| [22] |
|
| [23] |
|
| [24] |
|
| [25] |
IPCC, 2014. Climate Change 2014: Synthesis Report. Contribution of Working Groups I, II and III to the Fifth Assessment Report of the Intergovernmental Panel on Climate Change[R]. Geneva: IPCC: 1-151.
|
| [26] |
|
| [27] |
|
| [28] |
|
| [29] |
|
| [30] |
|
| [31] |
|
| [32] |
|
| [33] |
|
/
| 〈 |
|
〉 |
