
Journal of Tropical Oceanography >
Deep crustal structure revealed by ocean bottom seismic profile OBS2015-1 in southwestern Dongsha waters
Received date: 2016-11-23
Request revised date: 2017-01-11
Online published: 2017-09-22
Supported by
National Natural Science Foundation of China (91328205, 41376062)
Security Project of Marine Geology (GZH20110205)
Copyright
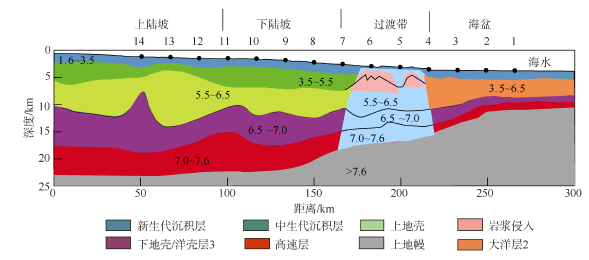
To better understand deep reflectors in the multi-channel seismic profile D80 in the northern South China Sea, a coincident ocean bottom seismic survey line (OBS2015-1) with 15 OBSs was inversed. This OBS line extends ESE 300 km, from 800 m in the upper slope to 3760 m in the abyssal plain. OBS data processing includes position and time corrections, phase identification using Obstool software, and velocity inversion with FAST tomography software. The resultant velocity shows that Cenozoic strata has a velocity of 1.6-3.5 km·s-1 and a depth of 2 km. Mesozoic velocity is 3.5-5.5 km·s-1 with an average depth of 3 km. In the oceanic and continental transition zone (OCT), the sediment basement is greatly affected by Late Cenozoic magmatic activity. Obvious high velocity anomaly and isoline uplift (5 km) were detected in the upper crust of the upper slope, corresponding to chaotic reflection anticline structure in D80; and the overlying Late Cenozoic strata also presents as synchronous deformation, which may result from the Late Cenozoic magmatic intrusion. The crustal thickness decreases gradually from 23-20 km beneath the continental slope to 8 km in the oceanic basin. A high velocity (7.0-7.6 km·s-1) layer was seen in the lower crust, which changes from 5 km in the upper slope to 2 km in the ocean basin. Because of the Late Cenozoic magmatic activity in the continental slope and OCT, we interpret that the high crustal velocity layer originated from magmatic intrusion after the cession of seafloor spreading.
LI Yaqing , YAN Pin , WANG Yanlin , ZHONG Guangjian . Deep crustal structure revealed by ocean bottom seismic profile OBS2015-1 in southwestern Dongsha waters[J]. Journal of Tropical Oceanography, 2017 , 36(5) : 83 -92 . DOI: 10.11978/2016122
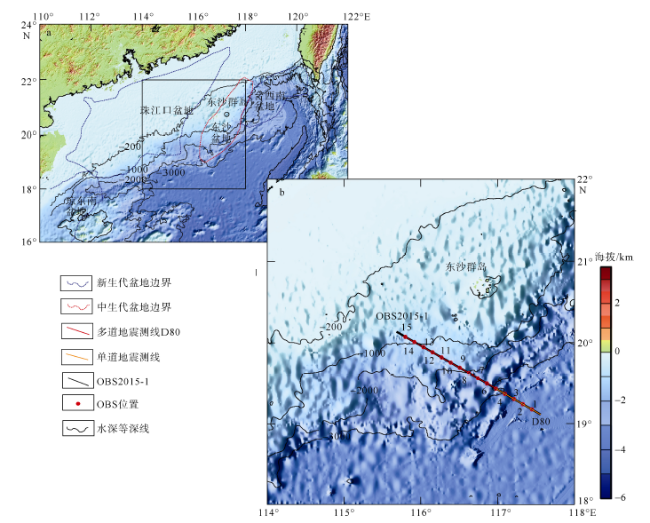
Fig. 1 Location of geological background (a) and survey lines (b). Water depth units: m. The basin boundary is from Yan et al (2014), and the bathymetric data is from http: //www.ngdc.noaa.gov/mgg/bathymetry/relief.html图1 区域地质图(a)和测线位置图(b) |
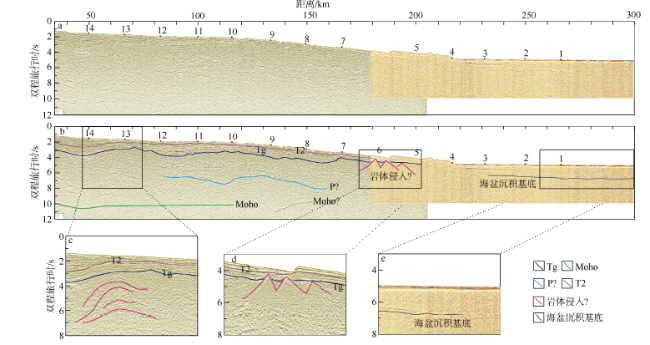
Fig. 2 Uninterpreted (a) and interpreted seismic profiles (b) along OBS2015-1. (c), (d) and (e) are partially enlarged details. Black dots denote the OBS stations图2 沿OBS2015-1测线的未解释地震剖面(a)和解释地震剖面(b) |
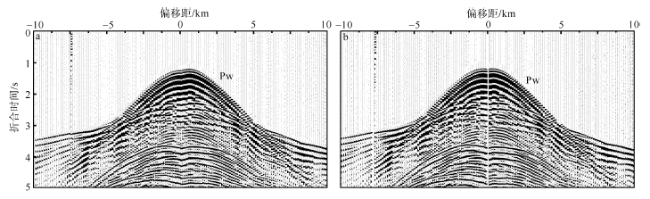
Fig. 3 Comparison of direct water phases (Pw) before (a) and after (b) correction of OBS09. The reduced velocity is 8km·s-1图3 OBS09台站直达水波震相Pw校正前(a)、后(b)对比图 |
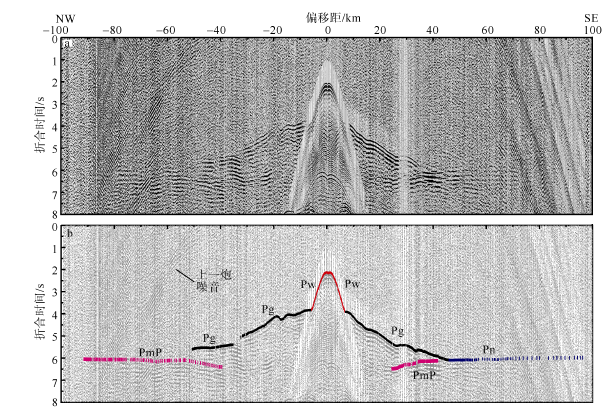
Fig. 4 (a) Seismic section of vertical component of OBS05 along profile OBS2015-1, and (b) the first refracted arrival time picking. The reduced velocity is 8km·s-1. The red dots denote direct water-wave phases Pw, the black dots denote refration phases within the crust Pg, the plum dots denote reflection phases from Moho PmP, and the dark blue dots denote refraction phases from mantle Pn图4 OBS05台站记录(a)和拾取初至(b)图 |
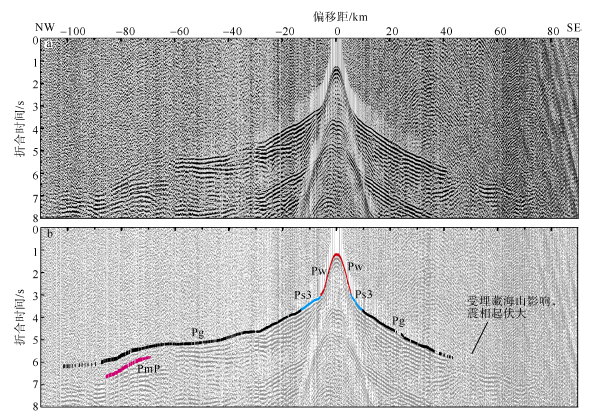
Fig. 5 (a) Seismic section of vertical component of OBS09 along profile OBS2015-1, and (b) the first refracted arrival time picking. The reduced velocity is 8km·s-1. The red dots denote direct water-wave phases Pw, the blue dots denote refraction phases from Mesozoic strata Ps3, and the black dots denote refration phases within the crust Pg图5 OBS09台站记录(a)和拾取初至(b)图 |
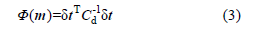
 , 是数据残差矢量; Cd是数据协方差矩阵, 它的元素是每个走时不确定的平方, 作用是降低较大不确定值的走时权重。
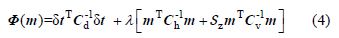
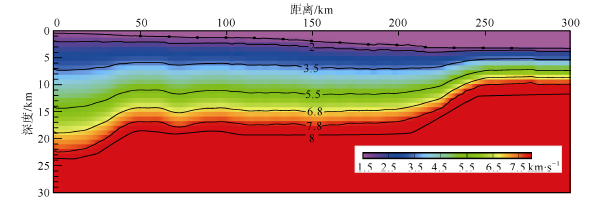
Fig. 6 The initial velocity-depth model of FAST tomography. The black dots denote the OBS stations图6 FAST tomography初始速度-深度模型 |
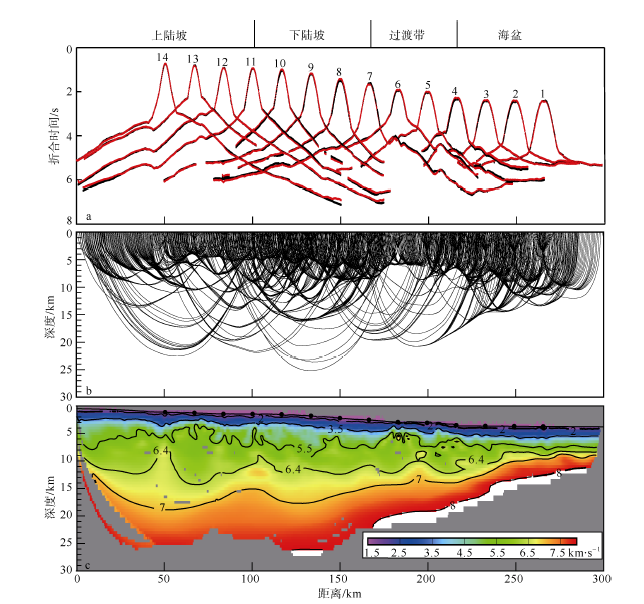
Fig. 7 Results from FAST tomography. (a) Time fitting: the black dots denote observed times and the red dots represent calculated travel time. (b) A ray path diagram. (c) The velocity model result: constant values in the profile denote velocity. The black dots in (c) denote the OBS locations. The reduced velocity is 8km·s-1图7 FAST tomography层析成像结果 |
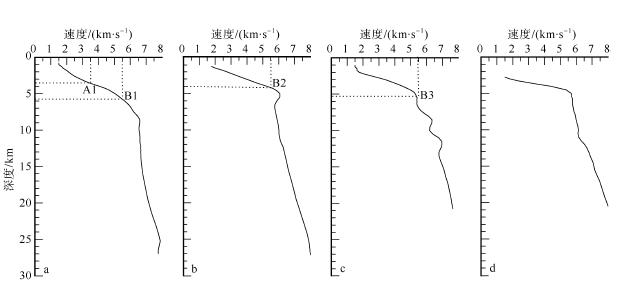
Fig. 8 Vertical velocity profiles. (a) x=50km, (b) x=60km, (c) x=100km, and (d) x=180km. A1 represents the velocity mutation point of Cenozoic strata while B1, B2 and B3 are velocity mutation points of Mesozoic strata图8 垂向速度剖面图 |
Fig. 9 Geological model of FAST tomography图9 FAST tomography层析成像反演速度的地质结构模型 |
The authors have declared that no competing interests exist.
| [1] |
|
| [2] |
|
| [3] |
|
| [4] |
|
| [5] |
|
| [6] |
|
| [7] |
|
| [8] |
|
| [9] |
|
| [10] |
|
| [11] |
|
| [12] |
|
| [13] |
|
| [14] |
|
| [15] |
|
| [16] |
|
| [17] |
|
| [18] |
|
| [19] |
|
| [20] |
|
| [21] |
|
| [22] |
|
| [23] |
|
| [24] |
|
| [25] |
|
| [26] |
|
| [27] |
|
| [28] |
|
| [29] |
|
/
| 〈 |
|
〉 |
