
Journal of Tropical Oceanography >
Indian Summer Monsoon evolution in the Andaman Sea during the Holocene: Evidence from grain size records
Received date: 2016-11-16
Request revised date: 2017-01-02
Online published: 2018-01-18
Supported by
Strategic Leading Science #cod#x00026; Technology Programme, Chinese Academy of Sciences (XDA11030104)
National Natural Science Foundation of China (91228207, 41476040)
Copyright
Based on the sediment grain size analysis of the gravity core ADM-C1 from the Andaman Sea, grain size populations were partitioned using the method of grain size versus standard deviation. It was found that two sensitive grain size populations (1.5~11.9 #cod#x003bc;m and 11.9~74 #cod#x003bc;m) had significant fluctuations, and were mainly controlled by the circulation dynamics in the sea area, which was closely related to the Indian Summer Monsoon (ISM). Evolution history of the ISM in the Andaman Sea during the Holocene is reconstructed based on sensitive grain size populations. The results show that the evolution history of the ISM generally can be divided into three stages: 10.4~8.8 ka BP, when the intensity of the ISM was the weakest of the three stages; 8.8~4.7 ka BP, when percentage and average grain size of the sensitive grain size populations had significant increase, indicating that the intensity of the ISM was at its strongest stage during this period; and 4.7~0 ka BP, when sharp decreases of percentage and average grain size of the sensitive grain size populations indicated that the intensity of the ISM was obviously weaker than those of the previous two stages. The reconstructed evolution history of the ISM shown in this paper is consistent with many other records during the Holocene, and further verifies the feasibility that sensitive grain size can be used as a reliable proxy of the ISM in the Andaman Sea.
HUANG Yun , XIANG Rong , LIU Shengfa , YANG Yiping , LIU Jianguo . Indian Summer Monsoon evolution in the Andaman Sea during the Holocene: Evidence from grain size records[J]. Journal of Tropical Oceanography, 2017 , 36(6) : 19 -26 . DOI: 10.11978/2016116
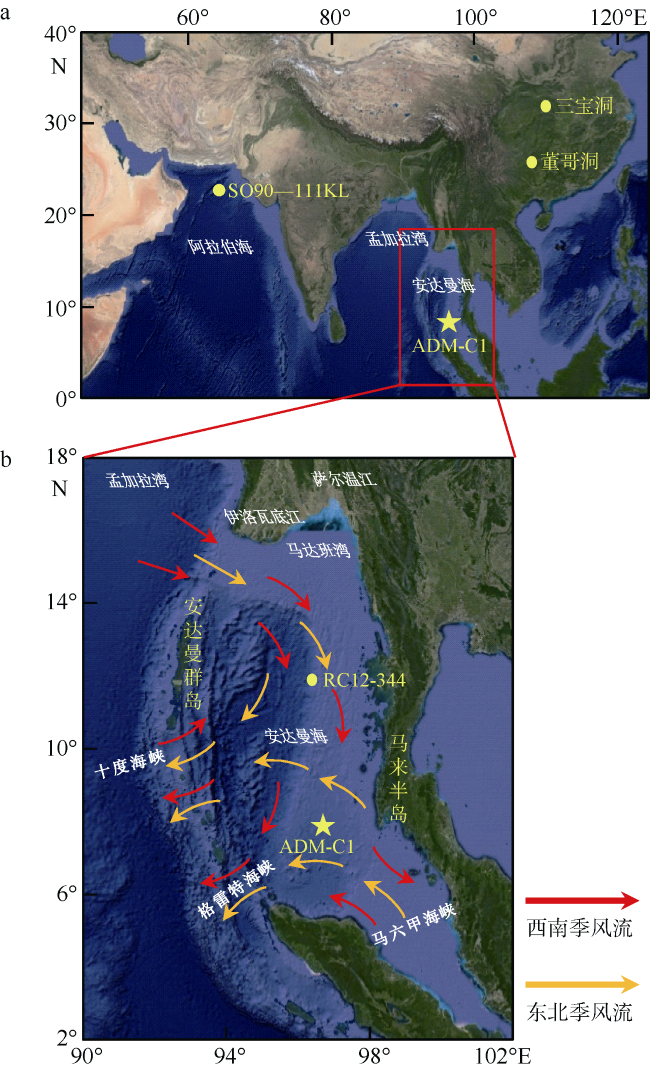
Fig. 1 Circulation pattern of the study area and sampling sites. After. (a) shows positions of ADM-C1 and paleoclimate records: SO90-111kl (Schulz et al, 1998), Dongge cave (Yuan et al, 2004), Sanbao cave (Dong et al, 2010); (b) shows circulation patterns of the ADM-C1 and other paleoclimate sampling site RC12-344 (Rashid et al., 2007)图1 研究区海流模式及取样站位(改自Cao et al, 2015) a. 采样点ADM-C1孔以及其他古气候记录。SO90-111kl (Schulz et al, 1998)、董哥洞(Yuan et al, 2004)、三宝洞(Dong et al, 2010); b. ADM-C1环流图以及其他古气候站位RC12-344(Rashid et al, 2007) |
Tab. 1 Radiocarbon dates for samples from the ADM-C1 core表1 ADM-C1孔测年结果 |
| 编号 | 层位 | 测试材料 | AMS14C年龄(a BP) | 校正年龄范围(2#cod#x003c3;, a BP)a | 校正年龄(a BP) |
|---|---|---|---|---|---|
| Beta-391104 | 31 | 混合有孔虫 | 3370#cod#x000b1;30 | 3345~3105 | 3220 |
| Beta-391105 | 61 | 混合有孔虫 | 5140#cod#x000b1;30 | 5585~5425 | 5485 |
| Beta-391106 | 93 | 混合有孔虫 | 6290#cod#x000b1;30 | 6850~6635 | 6735 |
| Beta-391107 | 125 | 混合有孔虫 | 8170#cod#x000b1;30 | 8775~8535 | 8620 |
| Beta-391108 | 157 | 混合有孔虫 | 10290#cod#x000b1;30 | 11375~11175 | 11245 |
a 根据Marine13 radiocarbon database进行校正(Talma et al, 1993; Reimer et al, 2013) |
Fig. 2 Age (a BP calendar year) versus depth (cm) plot for core ADM-C1. The linear sedimentation rates (LSR) are listed for each interval in cm・ka-1 and dotted lines indicate the extrapolated part of the age model图2 ADM-C1钻孔的年龄深度图 斜线旁边的数据为沉积速率(单位: cm・ka-1), 虚线指示线性外插法推断的年龄 |
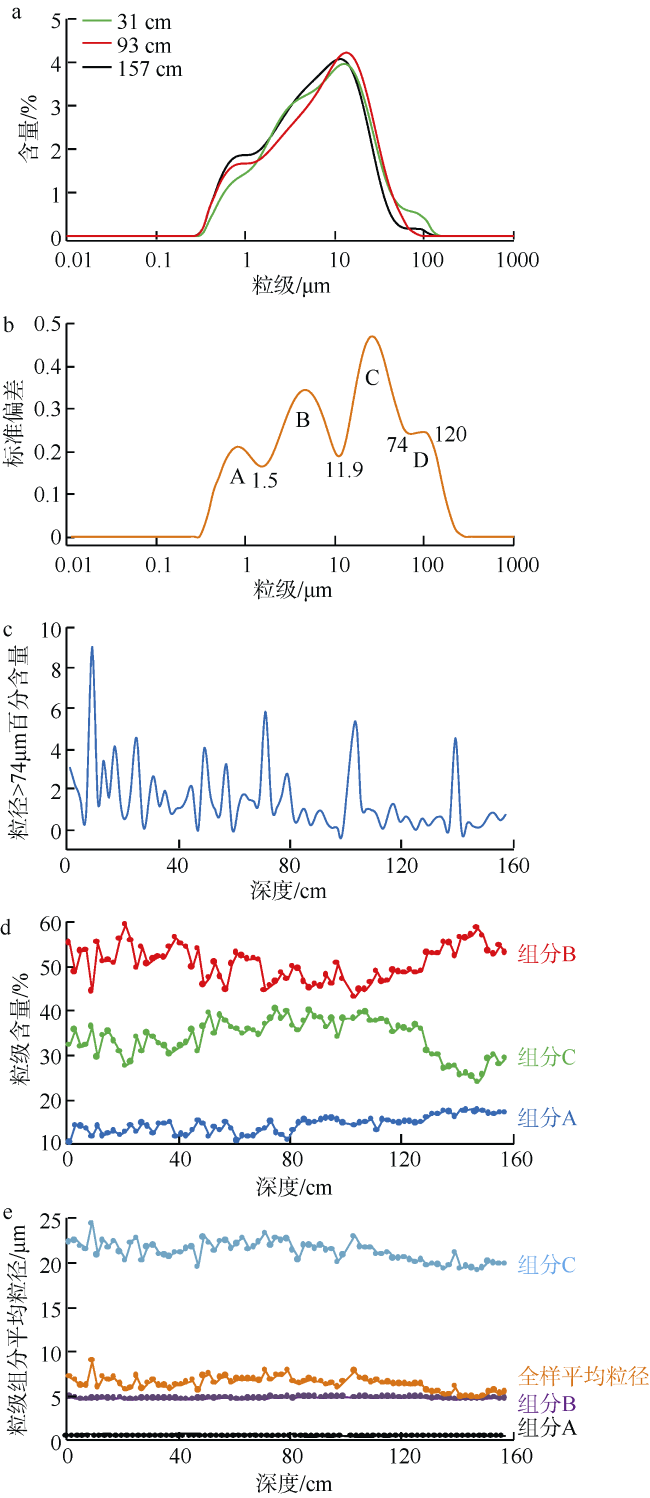
Fig. 3 Results of grain size analysis. (a) Sediment grain size versus frequency at different depths, (b) standard deviation versus grain size, (c) grain size percentage (#cod#x0003E;74 #cod#x003bc;m) versus depth, (d) percentage of sensitive grain size populations (A, B, C) versus depth, and (e) average grain sizes of grain groups A, B and C and of the whole sample versus depth图3 ADM-C1粒度分析结果 a. 不同深度沉积物粒度频率分布曲线; b. 标准偏差随粒级组分变化; c. 各个层位粒度大于74#cod#x003bc;m的百分含量变化; d. 敏感粒级组分的粒级含量变化; e. 敏感粒级组分的平均粒径变化 |
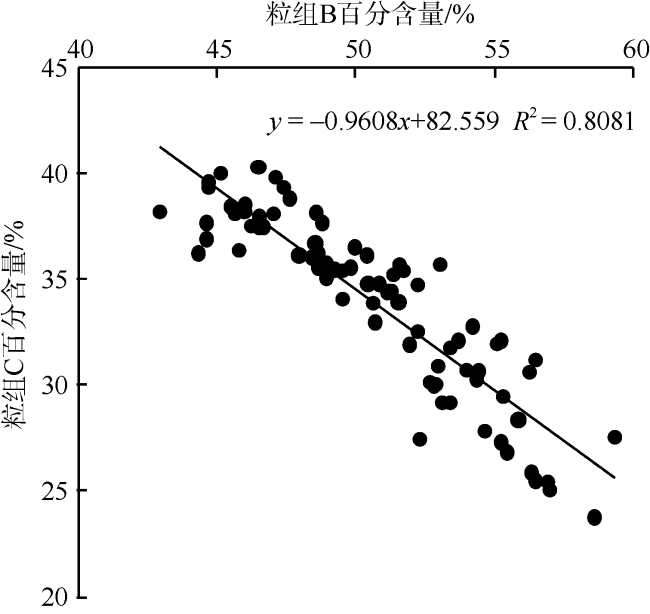
Fig. 4 Linear correlation analysis of percentage of sensitive grain size populations B and C图4 敏感粒级组分B、C百分含量线性相关分析 |
Fig. 5 Percentage and average grain size variations of grain groups B and C图5 敏感粒级组分B、C百分含量变化及平均粒径变化 |
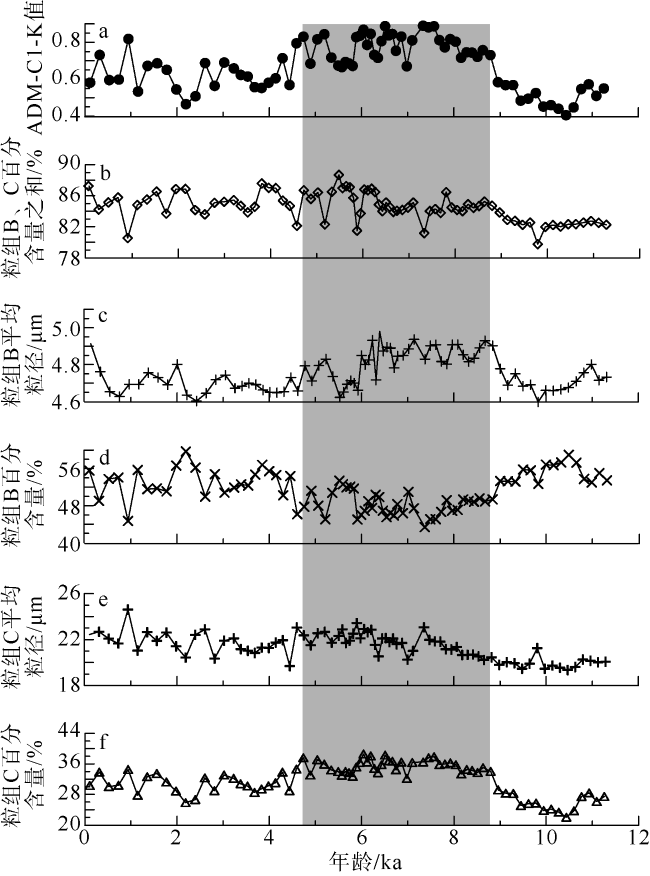
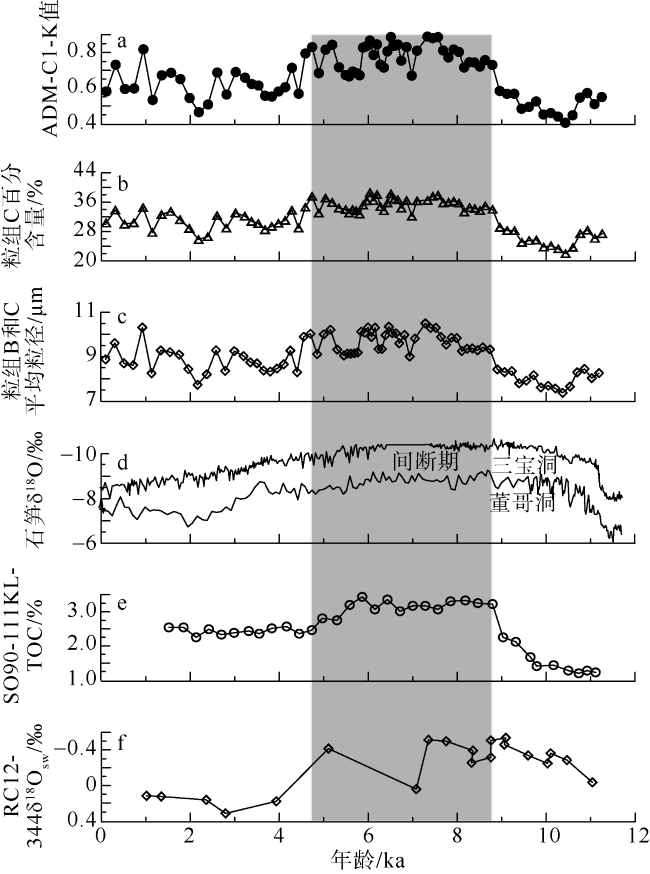
Fig. 6 Percentage variation and average grain size of sensitive grain size populations. (a) The values of K at ADM-C1, (b) the percentage variation of group C, (c) the average grain size variation of grain groups B and C, (d) the records of speleothem #cod#x003b4;18O from the Sanbao Cave (Dong et al, 2010) and the Dongge Cave (Yuan et al, 2004), (e) total organic carbon from SO90-111KL in the Arabian Sea (Schulz et al, 1998), and (f) #cod#x003b4;18Osw of the RC12-344 core in the Andaman Sea (Rashid et al, 2007)图6 敏感粒级组分百分含量变化及平均粒径变化与其他古环境记录指标 a. ADM-C1的K值变化曲线; b. 粒组C百分含量变化曲线; c. 粒组B和C平均粒径变化曲线; d. 三宝洞(Dong et al, 2010)、董哥洞(Yuan et al, 2004)石笋的#cod#x003b4;18O变化曲线; e. 阿拉伯海SO90-111KL总有机碳(TOC)含量变化曲线(Schulz et al, 1998); f. 安达曼海RC12-344 的#cod#x003b4;18Osw含量变化(Rashid et al, 2007) |
| [1] |
CAO PENG, SHI XUEFA, LI WEIRAN, et al, 2015. Rare earth element geochemistry of surface sediments in southeastern Andaman Sea and implications for provenance[J]. Marine Geology #cod#x00026; Quaternary Geology, 35(5): 57-67 (in Chinese).
|
| [2] |
CHEN JING#cod#x02019;AN, WAN GUOJIANG, ZHANG FENG, et al, 2004. Environmental records of lacustrine sediments in different time scales: Sediment grain size as an example[J]. Science in China Series D: Earth Sciences, 47(10): 954-960 (in Chinese).
|
| [3] |
GE QIAN, CHU FENGYOU, YE LIMING, et al, 2012. East Asian Winter Monsoon records from the mud area, northern shelf of the South China Sea over the last 3000 years[J]. Journal of Marine Sciences, 30(3): 56-62 (in Chinese).
|
| [4] |
SUN QIANLI, ZHOU JIE, XIAO JULE, 2001. Grain-size characteristics of Lake Daihai sediments and its paleaoenvironment significance[J]. Marine Geology #cod#x00026; Quaternary Geology, 21(1): 93-95 (in Chinese).
|
| [5] |
WANG WEI, LI ANCHUN, XU FANGJIAN, et al, 2009. Distribution of surface sediments and sedimentary environment in the north yellow sea[J]. Oceanologia et Limnologia Sinica, 40(5): 525-531 (in Chinese).
|
| [6] |
XIANG RONG, YANG ZUOSHENG, SAITO Y, et al, 2006. East Asia Winter Monsoon changes inferred from environmentally sensitive grain-size component records during the last 2300 years in mud area southwest off Cheju Island, ECS[J]. Science in China Series D: Earth Sciences, 49(6): 604-614 (in Chinese).
|
| [7] |
ZHENG HONGBO, CHEN GUOCHENG, XIE XIN, et al, 2008. Grain size distribution and dynamic control of late Quaternary terrigenous sediments in the South China Sea and their implication for East Asian Monsoon evolution[J]. Quaternary Sciences, 28(3): 414-424 (in Chinese).
|
| [8] |
|
| [9] |
|
| [10] |
.
|
| [11] |
|
| [12] |
|
| [13] |
|
| [14] |
|
| [15] |
|
| [16] |
|
| [17] |
|
| [18] |
|
| [19] |
|
| [20] |
|
| [21] |
|
| [22] |
|
| [23] |
|
| [24] |
|
| [25] |
|
| [26] |
|
| [27] |
|
| [28] |
|
| [29] |
|
| [30] |
|
| [31] |
|
| [32] |
|
| [33] |
|
| [34] |
|
| [35] |
|
| [36] |
|
| [37] |
|
| [38] |
|
/
| 〈 |
|
〉 |

