
Journal of Tropical Oceanography >
Analysis and tests on an OBS layout for deep seismic survey in the IODP legs 367-368 area of the South China Sea
Received date: 2017-01-20
Request revised date: 2017-03-13
Online published: 2018-02-02
Supported by
Natural Science Foundation of China (41730532, 91428204, 41576070, 41376063)
National Natural Science Foundation of China Open Research Cruise (NORC2015-08)
Copyright
The third scientific drilling in the South China Sea (SCS) will be carried out during Feb. to Jun. 2017 under the system of the International Ocean Discovery Program (IODP), namely, IODP Legs 367 and 368. The drilling project will improve the research on geology and geophysics of the SCS and bring it to an unprecedented stage. The combination of Ocean Bottom Seismometers (OBS) deep seismic survey with IODP drilling data will improve drilling achievement, and contribute greatly to our understanding of the specific mechanism of rifting and breakup processes in the northern SCS. We first built three original velocity models based on the three geological presumptions of IODP Legs 367 and 368 as follows. 1) the exhumed lower crust, 2) the oldest oceanic crust and 3) the exhumed upper mantle. Second, the ray-tracing and travel-time modelling were performed for different OBS intervals with employment of Rayinvr and Tomo2d software, as well as check-board tests for the models. The testing results suggest that the ray-tracing paths and ray density with the 7 km interval of OBS stations are better than those with the 10 km interval. However, the seismic survey line is 100 km, enough in length to make sure to detect the crustal structure at 30 km depth. And the results of check-board tests show that the 7 km interval of OBS stations is necessary to difference the 20-km-in-size velocity anomaly, which is the uncertainty zone in the seismic profile. The design analysis on the optimal deployment scheme of OBS stations will not only provide a good suggestion for the design of future seismic survey, but also contribute to our understanding of the mechanism of rifting and breakup processes in the SCS.
WANG Qiang , ZHAO Minghui , ZHANG Jiazheng , SUN Longtao , QIU Xuelin . Analysis and tests on an OBS layout for deep seismic survey in the IODP legs 367-368 area of the South China Sea[J]. Journal of Tropical Oceanography, 2018 , 37(1) : 90 -97 . DOI: 10.11978/2017011
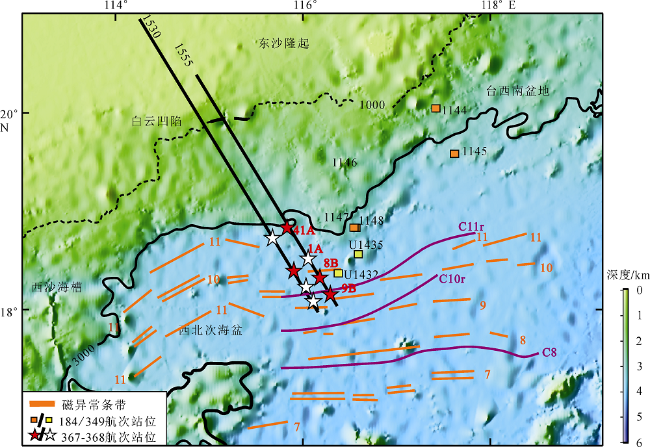
Fig. 1 Map for designed drilling wells of IODP expedition Legs 367-368 in the South China Sea. The black dashed and solid lines show water depth contours of 1000 and 3000 m, respectively. The magnetic anomalies in orange and purple colors are referenced by Briais et al (1993) and Li et al (2014), respectively. Red and white pentagrams represent designed and alternative wells (Sun et al, 2015, 2016), respectively. Lines 1530 and 1555 are two multi-channel seismic profiles across the designed drilling wells图1 南海IODP 367-368航次设计井位位置图 |
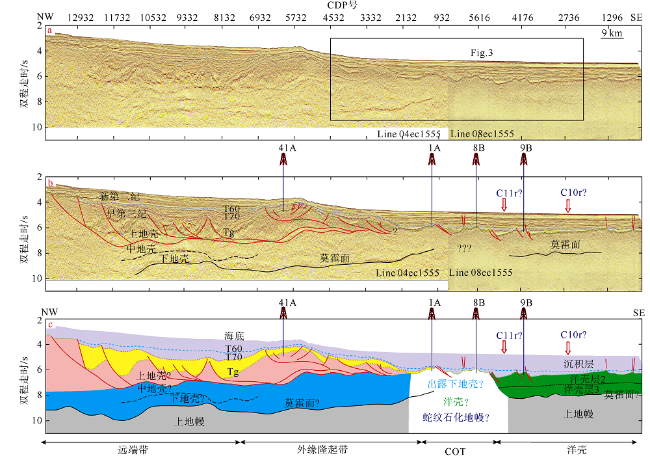
Fig. 2 Multi-channel seismic profile of Line 1555 across the designed drilling wells of IODP expedition Legs 367-368. (a) the original profile of Line 1555, with the blue frame showing the domain for building the initial models in |
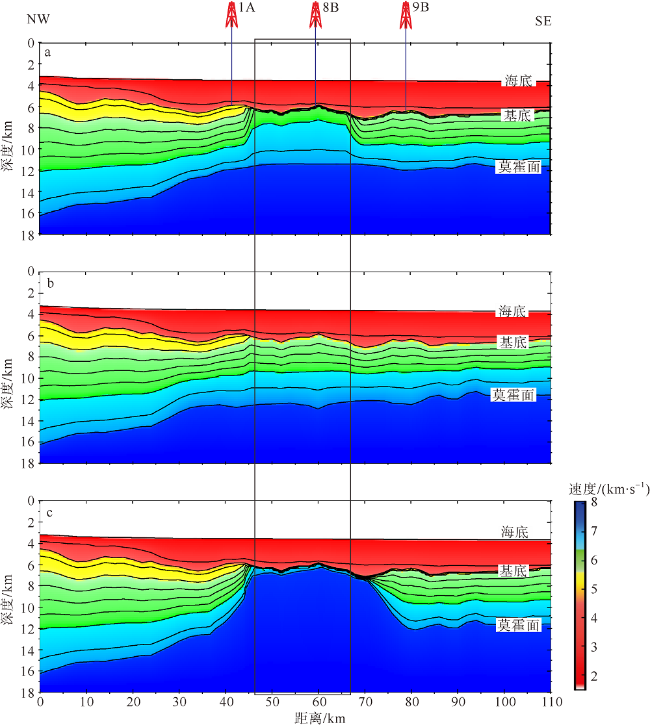
Fig. 3 Three original velocity models based on three geological types of the COT. (a), (b) and (c) refer to the exhumed lower crust, the oldest oceanic crust and the exhumed continental upper mantle, respectively. The black box shows the domain of obscure zone in |
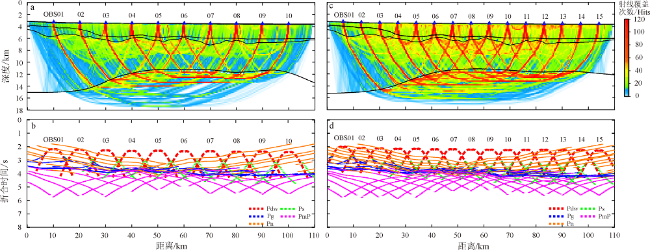
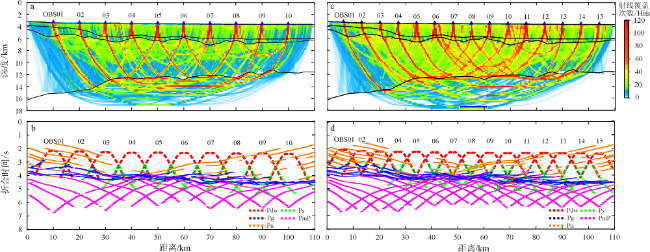
Fig. 4 Comparison of ray-tracing and travel-time simulation between 10 km and 7 km intervals of designed OBS stations based on the initial model 1 ( |
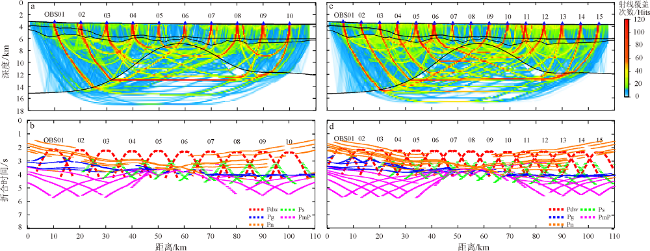
Fig. 5 Comparison of ray-tracing and travel-time simulation between 10 km and 7 km intervals of designed OBS stations based on the initial model 2 ( |
Fig. 6 Comparison of ray-tracing and travel-time simulation between 10 km and 7 km intervals of designed OBS stations based on the initial model 3 ( |
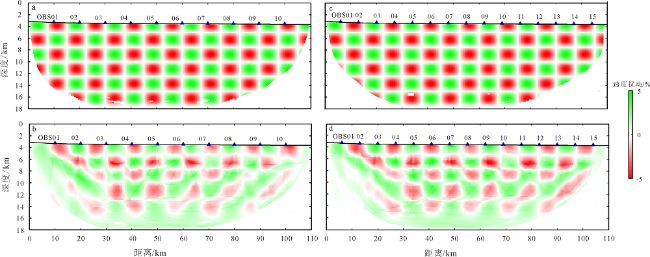
Fig. 7 Check-board test results of the 20-km-in-size velocity anomaly body. (a) and (b) are the input and output models with 10-km OBS interval; and (c) and (d) are the input and output models with 7-km OBS interval, respectively. The grid size is 15 km×5 km图7 速度异常体尺寸为20km时的初始地质模型的分辨率测试 |
The authors have declared that no competing interests exist.
| [1] |
|
| [2] |
|
| [3] |
|
| [4] |
|
| [5] |
|
| [6] |
|
| [7] |
|
| [8] |
|
| [9] |
|
| [10] |
|
| [11] |
|
| [12] |
|
| [13] |
|
| [14] |
|
| [15] |
|
| [16] |
|
| [17] |
|
| [18] |
|
| [19] |
|
| [20] |
|
| [21] |
|
| [22] |
|
| [23] |
|
/
| 〈 |
|
〉 |
