Orginal Article

Spatiotemporal variations of virioplankton and bacterioplankton abundance in Sanya waters and their related environmental factors

  • JING Hongmei , 1 ,
  • WEI Yu 1, 2 ,
  • ZHENG Liping 1 ,
  • XU Qiutong 1, 2 ,
  • ZHANG Yue 1, 2 ,
  • ZHU Wenda 1, 2
Expand
  • 1. Chinese Academy of Sciences Key Lab for Experimental Study under Deep-sea Extreme Conditions, Institute of Deep-sea Science and Engineering, Chinese Academy of Sciences, Sanya 572000, China
  • 2. University of Chinese Academy of Sciences, Beijing 100049, China
Corresponding author: JING Hongmei. Email:

Received date: 2017-05-26

  Request revised date: 2017-09-27

  Online published: 2018-04-11

Supported by

Knowledge Innovation Program of the Chinese Academy of Sciences (SIDSSE-201303)

The National Natural Science Foundation of China (41406180)

Copyright

热带海洋学报编辑部

Abstract

Surface water samples were collected monthly for a total of 12 months from three stations in Sanya. Their virioplankton and bacterioplankton abundances were measured by flow cytometry and their correlationships with evnironmental factors were also studied. The results show that the abundance of virioplankton (7.63×10⁶ viruses·mL-1 on average) was higher than bacterioplankton abundance (1.52×10⁶ cells·mL-1 on average). Virioplankton and bacterioplankton abundances in the Estuary of Sanya River were significantly different from those on the west side of the Luhuitou Peninsula and Xiaodonghai. The highest virioplankton and bacterioplankton abundances appeared in the Estuary of Sanya River, with obvious seasonal variation(P<0.01). The abundances of virioplankton and bacterioplankton were significantly positively correlated (r = 0.800, P<0.01); and chlorophyll a, N nutrients (NO- 2, NO- 2+NO- 3, NH+ 4) are their key ecological factors (P < 0.01).

Cite this article

JING Hongmei , WEI Yu , ZHENG Liping , XU Qiutong , ZHANG Yue , ZHU Wenda . Spatiotemporal variations of virioplankton and bacterioplankton abundance in Sanya waters and their related environmental factors[J]. Journal of Tropical Oceanography, 2018 , 37(2) : 36 -46 . DOI: 10.11978/2017064

浮游细菌(细菌和古细菌)是全球元素循环中不可或缺的调节者, 具有分解和再矿化溶解有机物的独特功能(Bunse et al, 2017), 同时也是水生生态系统中生物地球化学过程的主要驱动力(Kent et al, 2007; Pomeroy et al, 2007), 可促使珊瑚及其共生体产生黏液和其他有机物(Patten et al, 2008; Sorokin et al, 2009)。海洋环境中的浮游细菌的丰度和多样性受多种环境因素的调控, 如温度、盐度、溶解氧含量和养分(Fuhrman et al, 2006; Gilbert et al, 2009)。浮游病毒是水生生态系统中最丰富且具有动态性的组分, 其普遍丰度为 105~108viruses·mL-1(张奇亚, 2002; Suttle, 2005), 具有多样的生物地球化学功能 (Fuhrman, 1999; Suttle, 2007)。相关研究数据表明, 浮游病毒对细菌和单细胞藻类种群有显著影响作用, 在微生物食物网中也发挥着重要作用。海洋中的所有生物, 从微小细菌和古菌到最大的鲸鱼都受病毒感染, 这些感染影响着海洋生物的生态、进化和健康(Steward et al, 2013)。浮游病毒能够直接影响微生物种群动态、群落结构、多样性和基因转移等(Wommack et al, 2000; Weinbauer, 2004), 病毒会引起细菌的裂解, 使颗粒有机物转变为被细菌利用的溶解有机物(dissolved organic matter, DOM), 同时细菌作为病毒的寄主, 对浮游病毒的丰度产生较大的影响 (Suttle, 2005)。病毒丰度随细菌丰度的峰值变化而变化(Thingstad, 2000), 并且受水体环境、生产力等因素的影响, 大多数水体环境中病毒丰度高于细菌的丰度, 二者的比值在不同的季节中也表现出不同的变化趋势(王健, 2013)。海洋中浮游病毒种类较多, 常见的有高荧光病毒即V-I病毒和低荧光病毒即V-Ⅱ病毒, 二者对不同宿主也有不同的偏好性, 它们的比值可能是引起海水中浮游植物细胞或细菌丰度变化的原因之一(Marie et al, 1999)。
三亚市位于海南岛最南端, 是具有热带季风气候的国际旅游城市。三亚河自北向南, 穿越三亚市区注入三亚港, 是三亚湾最大的入海河流。三亚河接纳陆源和海源营养物质, 营养物质丰富(国家海洋局海口海洋环境监测中心站, 2005), 但由于河流沿岸污水排放、河道垃圾堆积等原因, 水体富营养化, 污染严重。鹿回头半岛位于三亚市市区正南端, 是三亚港和榆林港两个小型海湾之间一个向西南方向突出的岬角(赵希涛 等, 1996)。鹿回头半岛西侧以及鹿回头半岛东侧的小东海, 近海均有珊瑚礁覆盖区域, 是国家级自然保护区(思源, 2015)。鹿回头半岛岸礁生态系统受到人类活动和全球变化影响明显, 在近几十年里持续恶化, 珊瑚礁生态系统恶化会导致溶解氧及碳酸盐体系受到影响, 从而影响生物群落结构及多样性(赵美霞 等, 2010; Zhang et al, 2013)。关于鹿回头半岛西侧、小东海近海的研究多为珊瑚礁的发育变化史, 而关于此区域浮游病毒及细菌的丰度分布研究较少。经实地调查发现, 小东海近岸酒店林立, 游客众多; 而鹿回头半岛西侧靠近三亚湾, 远离三亚河口, 近岸同样有商业开发, 但酒店、游客相对较少。通过比较研究这两个站位的浮游病毒和细菌丰度等情况, 可以分析人类活动的影响。本文通过流式细胞技术研究了三亚近海浮游病毒丰度、浮游细菌丰度及其季节性生态分布, 探讨了不同水域环境下浮游病毒、细菌与Chl a、氮盐等环境参数的相关性, 为深入研究近海区域珊瑚礁生态系统中浮游生物群落结构及多样性提供基础数据。

1 材料与方法

1.1 水样采集与保存

2014年6月—2015年5月共12个月, 每月一次采集表层水, 对三亚鹿回头半岛近海进行调查, 共有3个样品采集站位, 如图1所示, 包括鹿回头半岛西侧(SL1), 小东海(SL2), 三亚河口(SL3)。各站位所采水样分别经20μm、2μm及GF/F(0.7μm, 47mm)孔径的滤膜(Millipore)过滤, 收集滤膜, 避光保存于-80℃超低温冰箱中, 用于Chl a测定。经0.22μm PC膜过滤后, 将海水等分加入50mL白色塑料小瓶子, 储存于-20℃, 用于营养盐参数测定。各站所采水样(1.5mL)用0.5%多聚甲醛溶液固定, 于液氮速冻后保存在-80℃超低温冰箱中, 用于浮游病毒及浮游细菌丰度测定。
Fig. 1 Sampling stations off the Luhuitou Peninsula

图1 鹿回头半岛近海采样站位
SL1: 鹿回头半岛西侧; SL2: 小东海; SL3: 三亚河口

1.2 环境参数测定

温度、盐度及pH分别用温度计、盐度计和pH计(梅特勒FE20K)测定, 营养盐数据采用经典比色法由AA3自动分析仪(Bran-Lube)获得, 参考Dai等(2008)的方法。Chl a (>20μm)、Chl a (2~20μm)及Chl a (GF/F)用Trilogy多功能荧光测定仪(Model No. Trilogy 040)测定。

1.3 浮游病毒和浮游细菌丰度检测

从各站位采集的水样, 用流式细胞仪(flow cytometry, FCM)检测浮游病毒和浮游细菌的丰度。检测时, 先将保存在-80℃超低温冰箱中的样品取出, 置于37℃的水浴箱中融化, 接着用核酸染料SYBR Green Ⅰ染色。浮游病毒丰度检测SYBR Green Ⅰ终浓度为0.5×10⁻⁴, 避光孵育10min, 加入1μm的标准荧光小球作为内参; 细菌丰度检测SYBR Green Ⅰ终浓度为1×10⁻⁴, 避光孵育15min。上样至流式细胞仪(Becton- Dickson FACSCalibur)检测, 根据侧向散射及荧光强度高低将病毒分为V-I病毒和V-Ⅱ病毒, 并分析数据(Marie et al, 1999)。流式细胞仪检测获得的浮游病毒丰度与浮游细菌丰度, 两者之间的比值为VBR(virus-to- bacterium ratio), 常用于分析浮游病毒与其他微型浮游生物之间的相互关系(卢龙飞 等, 2013)。

1.4 数据处理和分析

采用SigmaPlot软件对各站位的浮游病毒和浮游细菌丰度进行分析作图。运用SPSS软件对三个站位浮游病毒和浮游细菌丰度进行差异性分析, 浮游病毒丰度与浮游细菌丰度及其与相关环境因子之间的相关性用Pearson相关系数法及CANOCO进行分析。其他数据处理由Microsoft Excel 97-2003及WPS文字软件完成。

2 结果

2.1 浮游细菌的丰度

鹿回头半岛西侧海域浮游细菌丰度范围为2.22×10⁵~2.00×10⁶cells·mL-1, 浮游细菌丰度最低的是2015年3月份, 最高的是2014年6月份, 平均值为6.56±5.00×10⁵cells·mL-1。小东海浮游细菌丰度范围为1.61×10⁵~1.88×10⁶cells·mL-1, 最低值是2015年5月份, 最高值在2014年6月份, 平均值为5.85±4.93×10⁵cells·mL-1。三亚河口浮游细菌丰度范围为4.34×10⁵~8.75×10⁶cells·mL-1, 浮游细菌丰度最低值出现在2015年11月份, 最高值出现在2015年3月份, 平均值为3.33±2.92×10⁶cells·mL-1(图2)。2014年6—11月, 各站位浮游细菌丰度相对均匀, 2014年11月—2015年5月, 三亚河口的浮游细菌丰度明显高于其他两个站位, 呈现季节暴发性生长状态。
Fig. 2 Total abundance of bacterioplankton at the three stations

图2 三个站位浮游细菌丰度

三个站位浮游细菌丰度的差异性检验显示, 鹿回头半岛西侧与小东海的浮游细菌丰度无显著差异, 而三亚河口与鹿回头半岛西侧、小东海的浮游细菌丰度之间均有极显著差异(P<0.01)(表1), 这与不同站位浮游病毒丰度间的差异性具有相似性。
Tab. 1 Differences in total abundances of bacterioplankton and virioplankton at the three stations

表1 三个站位浮游细菌丰度差异性

站位 细菌 病毒V-Ⅰ 病毒V-Ⅱ 总病毒
鹿回头半岛西侧 小东海 鹿回头半岛西侧 小东海 鹿回头半岛西侧 小东海 鹿回头半岛西侧 小东海
小东海 0.73 0.812 0.469 0.492
三亚河口 0.009** 0.008** 0.000** 0.000** 0.000** 0.000** 0.000** 0.000**

注: *P<0.05; ** P<0.01。

2.2 浮游病毒的丰度

2.2.1 鹿回头半岛西侧海域
此站位V-Ⅱ病毒丰度范围为1.04×10⁶~ 4.93×10⁶viruses·mL-1, 最低丰度出现在2014年12月, 最高丰度出现在2014年10月, 平均值为2.03± 1.10×10⁶viruses·mL-1。V-I病毒丰度范围为0.34×10⁵~ 2.95×10⁵viruses·mL-1, 最低丰度出现在2014年7月, 最高丰度出现在2014年10月, 平均值为1.56±0.83 ×10⁵viruses·mL-1(图3)。
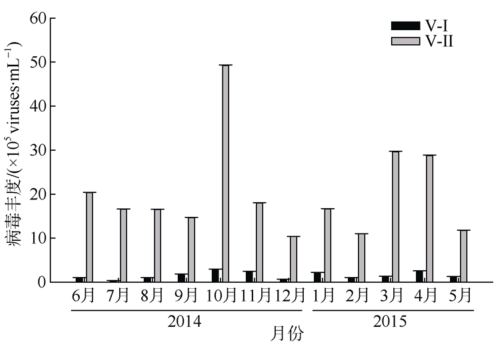
Fig. 3 Abundance of virioplankton on the west side of the Luhuitou Peninsula

图3 鹿回头半岛西侧海域浮游病毒丰度

2.2.2 小东海海域
此站位V-Ⅱ病毒丰度范围为1.16×10⁶~4.51 ×10⁶viruses·mL-1, 最低丰度出现在2014年12月, 最高丰度出现在2014年6月, 平均值为2.37± 1.14×10⁶viruses·mL-1。V-I病毒丰度范围为0.64×10⁵~ 3.37×10⁵viruses·mL-1, 最低丰度出现在2014年9月, 最高丰度出现在2014年11月, 平均值为1.48± 0.80×10⁵viruses·mL-1(图4)。
Fig. 4 Abundance of virioplankton in Xiaodonghai

图4 小东海浮游病毒丰度

2.2.3 三亚河口水域
此站位V-Ⅱ病毒丰度范围为2.43×10⁶~ 3.76×10⁷viruses·mL-1, 最低丰度出现在2014年7月, 最高丰度出现在2015年3月, 平均值为1.62±0.98× 10⁷viruses·mL-1。V-I病毒丰度范围为1.90×10⁵~ 3.86×10⁶ viruses·mL-1, 最低丰度出现在2014年9月, 最高丰度出现在2014年11月, 平均值为2.01± 1.14×10⁵ viruses·mL-1(图5)。
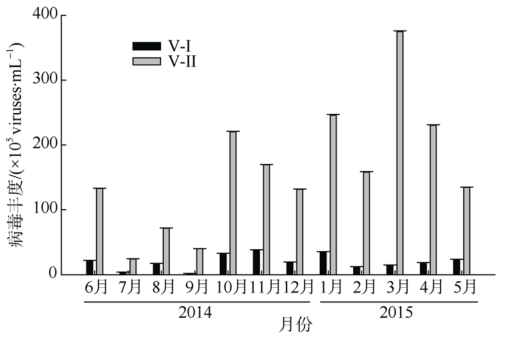
Fig. 5 Abundance of virioplankton in Sanya River Estuary

图5 三亚河口浮游病毒丰度

2.2.4 各站位V-I、V-Ⅱ病毒丰度
三个站位的V-I病毒丰度范围为0.34×10⁵~ 3.86×10⁶ viruses·mL-1, 平均值为7.72×10⁵viruses·mL-1; V-Ⅱ病毒丰度范围为1.04×10⁶~3.76×10⁷viruses·mL-1, 平均值为6.85×10⁶viruses·mL-1(图6)。
2.2.5 总病毒丰度
三个站位的总浮游病毒丰度范围为1.10×10⁶~ 3.91×10⁷viruses·mL-1, 平均值为7.63×10⁶viruses·mL-1 (图7)。
浮游病毒丰度的差异性检验显示, 不同站位之间V-I、V-Ⅱ和总浮游病毒丰度的差异性一致, 鹿回头半岛西侧与小东海之间无显著差异, 而三亚河口与鹿回头半岛西侧、小东海的浮游病毒丰度之间均有极显著差异(P<0.01)(表1)。
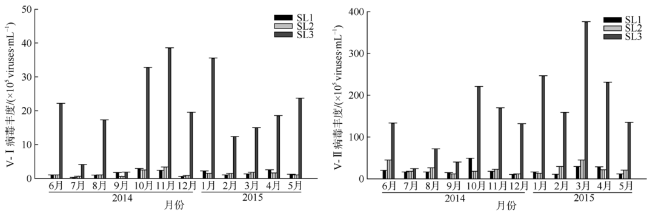
Fig. 6 Total abundance of low and high DNA virioplankton at the three stations

图6 三个站位V-Ⅰ(左图)、V-Ⅱ(右图)病毒丰度

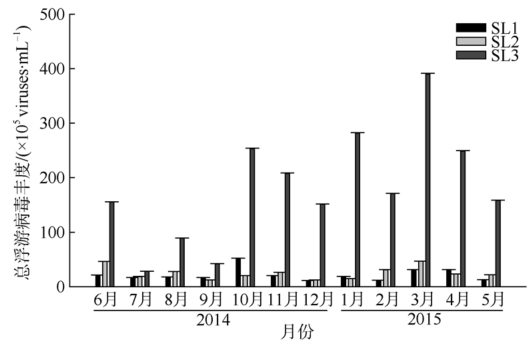
Fig. 7 Total abundance of virioplankton at the three stations

图7 三个站位总浮游病毒丰度

2.3 浮游病毒、细菌与环境因子的相关性分析

三亚近海SL1、SL2和SL3三个站位12个月的VBR分布范围分别为1.07~14.01、1.84~17.54和2.70~47.95, 平均值分别为4.99、7.28、12.03。通过对比发现, 三个站位中三亚河口(SL3)的VBR平均值最高, 且三个站位中VBR最高值(47.95)出现在此站。
通过Pearson相关性分析方法对浮游病毒、浮游细菌、VBR与主要环境因子的相关性进行分析。结果表明, 鹿回头半岛西侧海域(SL1)浮游病毒丰度与VBR(r=0.632)、Chl a (>20μm)(r=0.637)、Chl a (GF/F)(r=0.636)显著正相关(P<0.05)。浮游细菌丰度与NO- 2、NO- 2+NO- 3、NH+ 4极显著正相关(分别为r=0.838; r=0.799; r=0.777, P<0.01)(表2)。
Tab. 2 Pearson correlation coefficients between abundance of virioplankton, bacterioplankton and environmental parameters at station SL1

表2 站位SL1浮游病毒丰度与浮游细菌、环境参数间的Pearson相关系数

相关影响因子 Vir Bac VBR Sal Tem pH Chl a
(>20μm)
Chl a (2~20μm) Chl a
(GF/F)
NO- 2 NO- 2
+NO- 3
PO3- 4 SiO2- 3
Bac -0.034
VBR 0.632* -0.549
Sal -0.310 -0.337 -0.068
Tem 0.039 0.668* -0.396 -0.826**
pH 0.395 0.287 -0.267 -0.221 0.371
Chl a (>20μm) 0.637* -0.192 0.163 0.267 -0.335 0.507
Chl a (2~20μm) -0.052 -0.424 0.060 0.724** -0.769** -0.134 0.571
Chl a (GF/F) 0.636* -0.224 0.173 0.069 -0.124 0.669* 0.891** 0.387
NO- 2 -0.031 0.838** -0.333 -0.185 0.397 0.087 -0.184 -0.194 -0.188
NO- 2+NO- 3 0.154 0.799** -0.288 -0.281 0.432 0.188 0.022 -0.157 0.011 0.957**
PO3- 4 0.163 -0.410 0.431 0.155 -0.509 -0.036 0.265 0.545 0.204 -0.214 -0.206
SiO2- 3 0.049 0.686* -0.230 -0.070 0.191 0.040 -0.001 -0.013 -0.057 0.942** 0.949** -0.062
NH+ 4 0.005 0.777** -0.238 -0.203 0.432 0.073 -0.235 -0.258 -0.147 0.955** 0.893** -0.311 0.857**

注: *P < 0.05; **P < 0.01。Vir: 浮游病毒丰度; Bac: 浮游细菌丰度; VBR: 病毒/细菌比值; Sal: 盐度; Tem: 温度; Chl a (>20μm): >20μm的Chl a浓度; Chl a (2~20μm): 2~20μm的Chl a浓度; Chl a (GF/F) : GF/F的Chl a浓度; NO- 2: 亚硝酸盐浓度; NO- 2+NO- 3: 硝酸盐和亚硝酸盐浓度; PO3- 4: 磷酸盐浓度; SiO2- 3: 硅酸盐浓度; NH+ 4: 铵盐浓度。下同。

小东海海域(SL2), 浮游病毒丰度与NH4+显著正相关(r=0.638, P<0.05)。浮游细菌与VBR呈显著负相关(r=-0.636, P<0.05), 与温度显著正相关(r=0.610, P<0.05)(表3)。三亚河口区域(SL3), 浮游病毒丰度与浮游细菌显著正相关(r=0.677, P<0.05)。浮游细菌与Chl a (>20μm)极显著正相关(r=0.724, P<0.01), 与盐度显著正相关(r=0.593, P<0.05), 与温度呈显著负相关(r=-0.686, P<0.05)(表4)。
总体水平, 浮游病毒丰度与浮游细菌丰度显著正相关(r=0.800, P<0.01), 与Chl a、氮盐(NO- 2、NO- 2+NO3-、NH+ 4)显著正相关(P<0.01), 与VBR、SiO32-显著正相关(P<0.05)。浮游细菌丰度与Chl a、氮盐(NO- 2、NO- 2+NO- 3、NH+ 4)显著正相关(P<0.01)(表5)。
Tab. 3 Pearson correlation coefficients between abundance of virioplankton, bacterioplankton and environmental parameters at station SL2

表3 站位SL2浮游病毒丰度与浮游细菌、环境参数间的Pearson相关系数

相关影响因子 Vir Bac VBR Sal Tem pH Chl a
(>20μm)
Chl a
(2~20μm)
Chl a
(GF/F)
NO- 2 NO- 2+NO- 3 PO3- 4 SiO2- 3
Bac 0.332
VBR 0.446 -0.636*
Sal -0.019 -0.378 0.327
Tem 0.046 0.610* -0.446 -0.791**
pH -0.042 0.138 -0.210 0.064 0.369
Chl a(>20μm) 0.424 -0.408 0.553 0.393 -0.589* -0.183
Chl a(2~20μm) -0.114 -0.412 0.315 0.027 0.068 0.514 0.002
Chl a(GF/F) 0.278 -0.422 0.438 -0.015 -0.146 0.318 0.605* 0.601*
NO- 2 -0.491 0.046 -0.499 -0.486 0.348 0.255 -0.433 -0.103 -0.112
NO- 2+NO- 3 -0.247 0.241 -0.525 -0.541 0.450 0.023 -0.488 -0.241 -0.311 0.613*
PO3- 4 -0.285 0.148 -0.311 0.406 -0.193 -0.083 0.157 -0.364 -0.347 -0.18 -0.318
SiO2- 3 -0.290 0.036 -0.328 0.065 -0.240 -0.156 -0.305 -0.121 -0.254 0.353 0.334 -0.164
NH+ 4 0.638* 0.492 0.123 -0.074 0.253 0.281 -0.116 -0.052 0.057 -0.079 -0.303 -0.188 -0.200
Tab. 4 Pearson correlation coefficients between abundance of virioplankton, bacterioplankton and environmental parameters at station SL3

表4 站位SL3浮游病毒丰度与浮游细菌、环境参数间的Pearson相关系数

相关影响因子 Vir Bac VBR Sal Tem pH Chl a
(>20μm)
Chl a
(2~20μm)
Chl a
(GF/F)
NO- 2 NO- 2+NO- 3 PO3- 4 SiO2- 3
Bac 0.677*
VBR 0.164 -0.539
Sal 0.474 0.593* -0.127
Tem -0.563 -0.686* 0.205 -0.680*
pH 0.059 -0.409 0.720** -0.140 0.433
Chl a(>20μm) 0.469 0.724** -0.257 0.638* -0.597* -0.138
Chl a(2~20μm) 0.406 0.539 -0.230 0.367 -0.549 -0.219 0.089
Chl a(GF/F) 0.456 0.564 -0.167 0.394 -0.316 0.047 0.312 0.759**
NO- 2 0.531 0.452 0.159 0.351 -0.719** -0.143 0.220 0.633* 0.250
NO- 2+NO- 3 0.109 0.078 0.153 -0.132 -0.517 -0.196 0.001 0.266 -0.171 0.776**
PO3- 4 0.403 -0.018 0.528 -0.002 -0.327 0.233 0.091 0.298 0.130 0.488 0.449
SiO2- 3 -0.033 -0.104 0.183 -0.257 -0.359 -0.137 -0.193 0.088 -0.351 0.600* 0.930** 0.397
NH+ 4 0.277 0.167 0.203 -0.016 -0.521 -0.074 -0.033 0.604* 0.181 0.851** 0.837** 0.712** 0.738**
Tab. 5 Pearson correlation coefficients between abundance of virioplankton, bacterioplankton and environmental parameters fo the overall level at the surveyed stations

表5 调查海域总体水平浮游病毒丰度与浮游细菌、环境参数间的Pearson相关系数

相关影响因子 Vir Bac VBR Sal Tem pH Chl a
(>20μm)
Chl a
(2~20μm)
Chl a
(GF/F)
NO- 2 NO- 2+NO- 3 PO3- 4 SiO2- 3
Bac 0.800**
VBR 0.331* -0.230
Tem -0.211 -0.218 -0.054 -0.621**
pH -0.117 -0.273 0.236 -0.014 0.389*
Chl a(>20μm) 0.546** 0.614** 0.033 0.280 -0.461** -0.042
Chl a(2~20μm) 0.582** 0.639** -0.029 0.071 -0.303 -0.178 0.251
Chl a(GF/F) 0.689** 0.683** 0.087 -0.002 -0.180 -0.006 0.503** 0.804**
NO- 2 0.792** 0.697** 0.275 -0.147 -0.235 -0.187 0.379* 0.700** 0.556**
NO- 2+NO- 3 0.587** 0.497** 0.225 -0.405* -0.086 -0.173 0.254 0.462** 0.315 0.887**
PO3- 4 0.134 -0.010 0.244 0.137 -0.250 0.049 0.088 0.133 0.030 0.143 0.086
SiO2- 3 0.359* 0.271 0.198 -0.353* -0.142 -0.161 0.072 0.275 0.067 0.720** 0.908** 0.078
NH+ 4 0.714** 0.571** 0.312 -0.335* -0.146 -0.162 0.271 0.677** 0.536** 0.938** 0.905** 0.204 0.771**

3 讨论

3.1 浮游细菌的丰度

采样期间, 均选择在非降雨、潮位最低时刻进行, 尽量减小降雨、径流带来的差异。三个站位中, 浮游细菌丰度最高的是三亚河口, 丰度最低为小东海。鹿回头半岛西侧与小东海的浮游细菌丰度相近, 但比三亚河口低1个数量级左右。三亚河口站位位于三亚河入海口, 有陆源营养物质输入, 营养盐浓度约为鹿回头半岛西侧的1.5~11倍, 是小东海的0.6~40倍, 河口浮游植物Chl a 浓度远远超过l0μg·L-1, 表明三亚河口污染程度比鹿回头半岛西侧与小东海的更严重, 导致水体富营养化程度更高, 为浮游细菌提供更丰富的营养物质, 从而使三亚河口有更高的浮游细菌存活量(刘晶晶 等, 2011a; 王海丽 等, 2011)。
就季节变化而言, 鹿回头半岛西侧与小东海的细菌丰度变化趋势较一致, 均为从2014年6月至次年5月, 丰度逐渐降低, 浮游细菌丰度夏季显著高于冬季。这可能是由于鹿回头半岛西侧和小东海的受污染程度小, 浮游细菌的生长环境较三亚河口简单。而三亚河口浮游细菌丰度分布变化有明显的季节特征, 冬春季显著高于夏秋季节。这可能由于冬、春季三亚市游客增多, 污水排放量增多, 水体富营养化程度更高, 更利于细菌生长(周伟华 等, 2006, 2007)。
有研究表明, 受到有机污染较严重的海域, 有比较高的细菌丰度(周伟华 等, 2007), 我国其他海区如长江及其临近海域细菌丰度要高于鹿回头西侧和小东海海域(史君贤 等, 1992), 而与同样位于海南的10年前三亚湾相比(表6), 鹿回头西侧和小东海海域年度细菌平均丰度与三亚湾不同季节的细菌丰度相当, 表明近10年来三亚海域环境保护得当。但三亚河口细菌丰度远高于三亚湾, 说明河口区域受到陆源污染, 应着重进行环境保护。
Tab. 6 Comparison with existing studies about Sanya Bay

表6 与已有的三亚湾研究进行比较

研究 细菌丰度/(×108cells·L-1) 时间 站位
周伟华 等(2006) 11.32±7.26 2004秋 三亚湾
周伟华 等(2007) 6.70±2.49 2005春 三亚湾
8.41±2.51 2005夏 三亚湾
5.78±2.81 2005秋 三亚湾
8.84±4.67 2005冬 三亚湾
本研究 6.56±5.00 2014—2015 鹿回头西侧
5.85±4.93 2014—2015 小东海
33.3±29.19 2014—2015 三亚河口

3.2 浮游病毒的丰度

三个站位的V-Ⅰ丰度均无明显的季节变化特征。V-Ⅱ丰度均高于高DNA含量的浮游病毒丰度。V-Ⅱ丰度在鹿回头半岛西侧与小东海无明显的季节变化; 而三亚河口, 病毒丰度在春冬季节增高, 高于夏秋季节的病毒丰度, 有较为明显的季节变化特征。
总体水平上, 三亚河口的V-Ⅱ丰度分布有明显的季节性变化, 而鹿回头半岛西侧和小东海V-Ⅱ丰度分布较均匀。总浮游病毒丰度也有相似特征, 三亚河口病毒丰度显著高于鹿回头半岛西侧和小东海, 且分布有明显季节变化, 与浮游细菌丰度的季节性分布较一致。三亚河口浮游病毒丰度在冬、春季显著高于夏、秋季, 与刘晶晶报道的夏季长江口及邻近海域浮游病毒丰度数量显著高于冬季的结果相反(刘晶晶 等, 2011b), 可能是由于三亚河口病毒与其宿主细菌同样具有明显的季节性变化。鹿回头半岛西侧和小东海病毒丰度分布较均匀, 但与浮游细菌从2014年6月至次年5月丰度逐渐降低的变化不一致, 可能由于此两站位的浮游病毒宿主除了细菌还有其他浮游植物。研究海域总体浮游病毒丰度比浮游细菌丰度高1个数量级左右, 与长江口(刘晶晶 等, 2011b)、黄海、东海(赵三军 等, 2003)、渤海(白洁 等, 2003)等海域的调查结果相近。

3.3 V-Ⅰ、V-Ⅱ、细菌丰度与相关环境因子年度变化

不同的海洋环境中病毒有不同类群, 最常见的是V-Ⅰ及V-Ⅱ。与V-Ⅱ相比, V-Ⅰ类群有高荧光、大个体、数量相对较少的特征, 同时研究表明, 不同类群的病毒受到的宿主作用有所不同(Marie et al, 1999)。
3.3.1 V-I与Chl a年度变化
对不同区域不同类群病毒与不同宿主的年度变化分析(图8)表明, SL1和SL2站位在每月采样中, V-I病毒随着不同粒径浮游植物的增加而增多, 随着浮游植物的减少而减少, 并且在10、11月均有高值, 呈现出较一致的变化趋势, 可推测在鹿回头半岛西侧和小东海, V-I类群受到浮游植物细胞作为其宿主的影响, 这与(Marie et al, 1999)的推论一致。
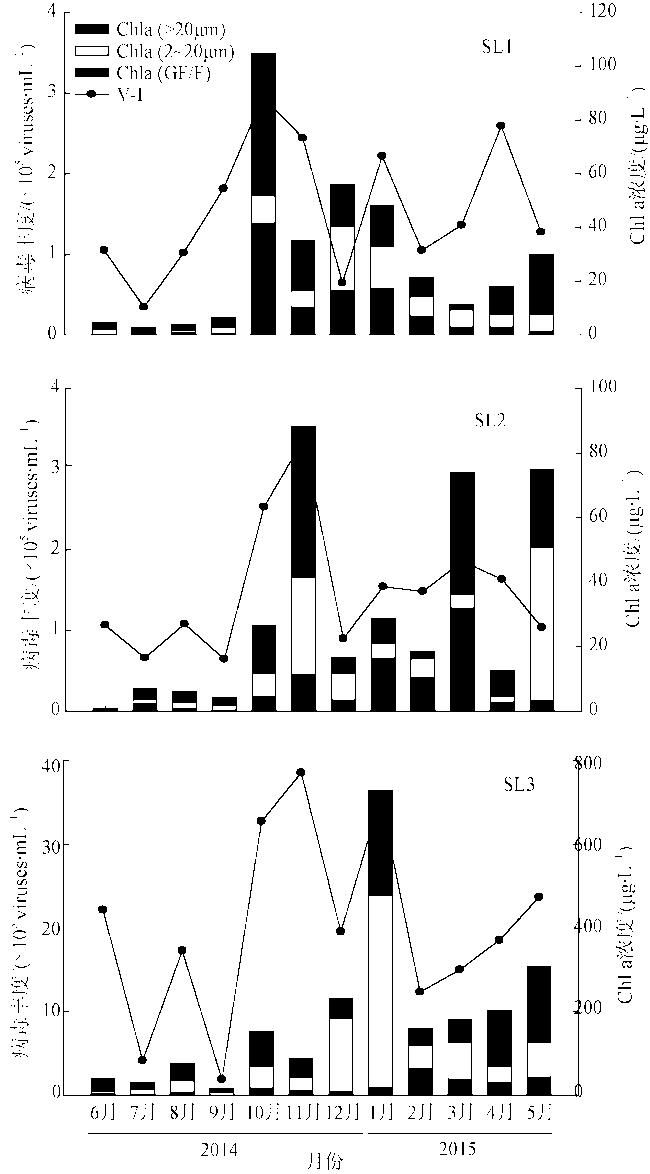
Fig. 8 Annual variation of V-I and Chl a at the three stations

图8 三个站位的V-I病毒丰度与Chl a年度变化

V-I类群如何受到其宿主浮游植物细胞的影响还有待进一步研究。与其他地区的研究结果相似(Cochran et al, 1998), 在三亚河口、鹿回头半岛西侧和小东海, 病毒的峰值出现在秋季10、11月。但在三亚河口, 11月浮游植物呈现相对低值, 可能是10月份浮游植物在河口区域的增加为病毒提供了丰富的饵料, 较高浓度的浮游病毒导致随后11月份浮游植物生物量的减少。
3.3.2 V-I与浮游细菌丰度年度变化
图9上可以看出, 细菌随着时间改变而呈现逐渐减小的趋势, 而V-I病毒的丰度并没有随着时间而逐渐减小, 由此推断, 不同粒径浮游植物宿主对V-I病毒有显著的影响, 而细菌对V-I病毒的影响不明显。
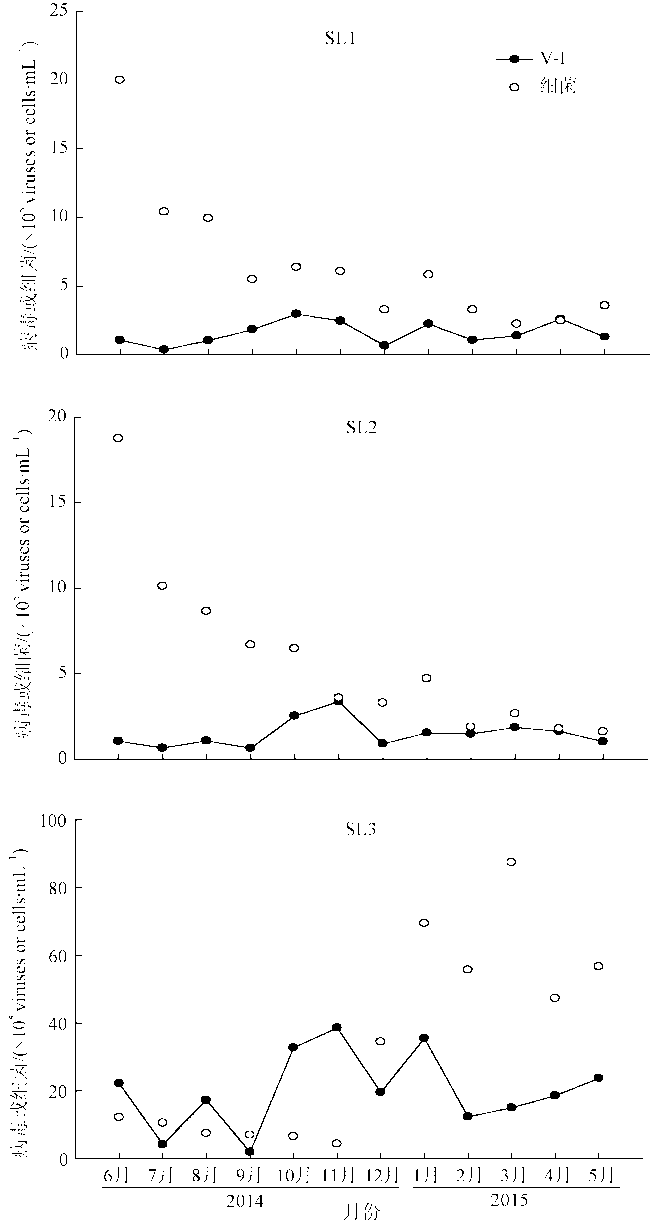
Fig. 9 Annual variation of V-I and bacterioplankton abundance at the three stations

图9 三个站位SL1、SL2、SL3的V-I与浮游细菌丰度年度变化

3.3.3 V-Ⅱ与浮游细菌丰度年度变化
总体上看, 在SL1和SL2站位, V-Ⅱ病毒与细菌随着时间改变而呈现逐渐减小的趋势(图10), 推测在鹿回头半岛西侧和小东海, V-Ⅱ类群受到细菌作为其宿主的影响, 这与Marie 等(1999)的推论一致。而在SL3站位, 病毒与细菌随着时间并没有规律性的变化趋势, 但病毒的低值或高值总是与细菌的低值或高值相伴, 也体现出V-Ⅱ类群受到细菌的影响。
3.3.4 V-Ⅱ与Chl a年度变化
图11上可以看出, V-Ⅱ病毒与不同粒径浮游植物并无明显一致的变化趋势。V-Ⅱ病毒的高值与浮游植物高值不同时出现, 二者的低值也不同时出现。由此推断, 与V-Ⅰ病毒不同, V-Ⅱ病毒受到细菌作为其宿主的影响。
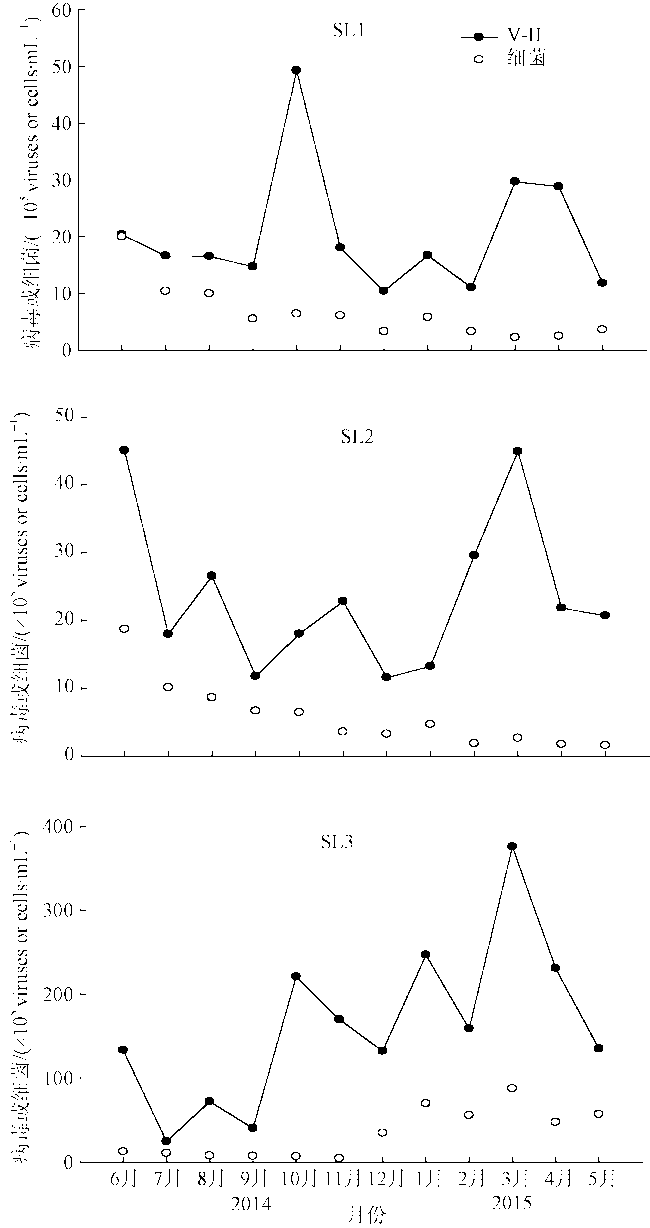
Fig. 10 Annual variation of V-Ⅱ and bacterioplankton abundance at the three stations

图10 三个站位SL1、SL2、SL3的V-Ⅱ与浮游细菌丰度年度变化

3.4 浮游病毒、细菌丰度与环境因子的相关性分析

将三个站位浮游病毒、浮游细菌及环境参数进行冗余分析, 即RDA(redundancy analysis)分析(图12), 可以看出, 细菌丰度与Chl a、营养盐浓度有正相关关系, 尤其与2μm以上粒级的浮游植物有最密切的正相关关系。Chl a是浮游藻类现存量的重要指标, 是推算浮游藻类生产量的重要参量(王建 等, 1984), 由此推断, 浮游细菌分布与浮游藻类生长密切相关, 也可能由此间接影响浮游病毒丰度。浮游病毒、细菌丰度与氮盐(NO- 2、NO- 2+NO- 3、NH+ 4)有正相关关系, 说明氮盐可能通过影响调查海域宿主浮游细菌的生长来影响浮游病毒的生长。
Fig. 11 Annual variation of V-Ⅱ and Chl a at the three stations

图11 三个站位SL1(左图)、SL2(中图)、SL3(右图)V-Ⅱ与Chl a年度变化

综上所述, 三个站位中, 浮游病毒和细菌丰度在三亚河口最高, 具有明显的季节变化, 冬、春季高于夏、秋季, 浮游病毒数量比浮游细菌丰度高1个数量级左右。总体上, 浮游病毒和细菌的生长受Chl a、氮盐等关键生态因子的影响。
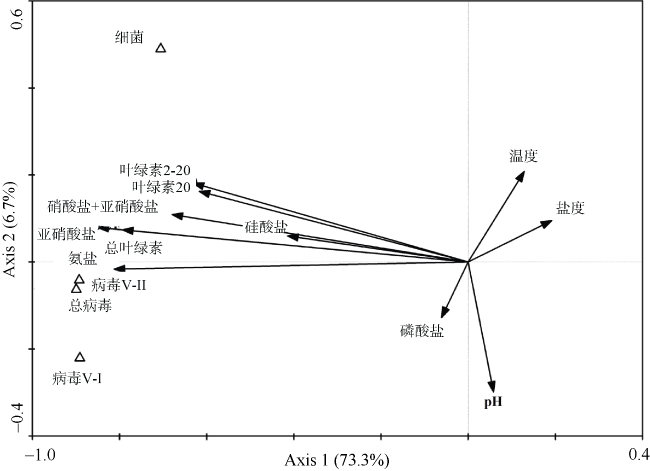
Fig. 12 RDA results of virioplankton, bacterioplankton and environmental parameters of the overall level of the surveyed stations

图12 调查海域浮游病毒、浮游细菌与环境参数间的RDA分析结果

The authors have declared that no competing interests exist.

[1]
白洁, 李岿然, 李正炎, 等, 2003. 渤海春季浮游细菌分布与生态环境因子的关系[J]. 青岛海洋大学学报, 33(6): 841-846.

BAI JIE, LI KUIRAN, LI ZHENGYAN, et al, 2003. Relationship between the environmental factors and distribution of bacterioplankton in the Bohai Sea[J]. Journal of Ocean University of Qingdao, 33(6): 841-846 (in Chinese with English abstract).

[2]
国家海洋局海口海洋环境监测中心站, 2005. 三亚湾海滩“泥化”和海岸侵蚀原因及治理对策研究报告[R]. 海口: 国家海洋局海口海洋环境监测中心站.

[3]
刘晶晶, 杜萍, 曾江宁, 等, 2011a. 夏季长江口浮游细菌和浮游病毒的分布特征及环境制约因素[J]. 海洋学研究, 29(3): 118-124.

LIU JINGJING, DU PING, ZENG JIANGNING, et al, 2011b. Distribution of bacterioplankton and virioplankton and their relationship with the environmental factors in summer in Changjiang River Estuary and its adjacent East China Sea[J]. Journal of Marine Sciences, 29(3): 118-124 (in Chinese with English abstract).

[4]
刘晶晶, 曾江宁, 杜萍, 等, 2011b. 长江口及邻近海域夏、冬季浮游病毒丰度分布[J]. 应用生态学报, 22(3): 793-799.

LIU JINGJING, ZENG JIANGNING, DU PING, et al, 2011a. Abundance distribution of virioplankton in Yangtze River estuary and its adjacent East China Sea in summer and winter[J]. Chinese Journal of Applied Ecology, 22(3): 793-799 (in Chinese with English abstract).

[5]
卢龙飞, 汪岷, 梁彦韬, 等, 2013. 东海、黄海浮游病毒及异养细菌的分布研究[J]. 海洋与湖沼, 44(5): 1339-1346.

LU LONGFEI, WANG MIN, LIANG YANTAO, et al, 2013. Distribution of virioplankton, heterotrophic bacteria in the Yellow Sea and East China Sea[J]. Oceanologia et Limnologia Sinica, 44(5): 1339-1346 (in Chinese with English abstract).

[6]
史君贤, 陈忠元, 宁修仁, 等, 1992. 长江口及其附近海域细菌和三磷酸腺苷的分布特征[J]. 海洋与湖沼, 23(3): 288-296.

SHI JUNXIAN, CHEN ZHONGYUAN, NING XIUREN, et al, 1992. The distribution patterns of bacteria and ATP in the Changjiang River estuary and its adjacent east China Sea[J]. Oceanologia et Limnologia Sinica, 23(3): 288-296 (in Chinese with English abstract).

[7]
思源, 2015. 三亚海洋“热带雨林”保护现状[J]. 海洋世界, (10): 20-23.

[8]
王海丽, 杨季芳, 屠霄霞, 等, 2011. 象山港海洋病毒时空分布特征及其环境影响因素[J]. 中国环境科学, 31(5): 834-844.

WANG HAILI, YANG JIFANG, TU XIAOXIA, et al, 2011. Spatiotemporal distribution of marine viruses with related to environmental factors in the Xiangshan Bay[J]. China Environmental Science, 31(5): 834-844 (in Chinese with English abstract).

[9]
王建, 王骥, 1984. 浮游植物叶绿素与脱镁叶绿素的测定方法[J]. 植物科学学报, 2(2): 321-328.

WANG JIAN, WANG JI.1984The method for the determination of chlorophyll and phaeopigments in phytoplankton[J]. Wuhan Botanical Research, 2(2): 321-328 (in Chinese with English abstract).

[10]
王健, 2013. 渤海浮游病毒的时空分布及其与异养细菌的相关性研究[D]. 青岛: 中国海洋大学.

WANG JIAN, 2013. The spatial and temporal distribution of virioplankton and correlation with heterotrophic bacteria in the Bohai Sea[D]. Qingdao:Ocean University of China (in Chinese with English abstract).

[11]
赵美霞, 余克服, 张乔民, 等, 2010. 近50年来三亚鹿回头岸礁活珊瑚覆盖率的动态变化[J]. 海洋与湖沼, 41(3): 440-447.

ZHAO MEIXIA, YU KEFU, ZHANG QIAOMIN, et al, 2010. Long-term change in coral cover in Luhuitou fringing reef, Sanya[J]. Oceanologia et Limnologia Sinica, 41(3): 440-447 (in Chinese with English abstract).

[12]
赵三军, 肖天, 岳海东, 2003. 秋季东、黄海异养细菌(Heterotrophic Bacteria)的分布特点[J]. 海洋与湖沼, 34(3): 295-305.

ZHAO SANJUN, XIAO TIAN, YUE HAIDONG, 2003. The distribution of heterotrophic bacteria and some related factors in the east China and Yellow Sea during fall[J]. Oceanologia et Limnologia Sinica, 34(3): 295-305 (in Chinese with English abstract).

[13]
赵希涛, 陈欣树, 郑范, 等, 1996. 海南三亚鹿回头半岛珊瑚礁和连岛坝的发育[J]. 第四纪研究, 16(1): 48-58.

ZHAO XITAO, CHEN XINSHU, ZHENG FAN, et al, 1996. Development of the coral reefs and tombolo of Luhuitou peninsula, Sanya City, Hainan Province[J]. Quaternary Sciences, 16(1): 48-58 (in Chinese with English abstract).

[14]
周伟华, 王汉奎, 董俊德, 等, 2006. 三亚湾秋、冬季浮游植物和细菌的生物量分布特征及其与环境因子的关系[J]. 生态学报, 26(8): 2633-2639.

ZHOU WEIHUA, WANG HANKUI, DONG JUNDE, et al, 2006. Phytoplankton and bacterial biomass and their relationship with the environmental factors in autumn and winter in the Sanya Bay, China[J]. Acta Ecologica Sinica, 26(8): 2633-2639 (in Chinese with English abstract).

[15]
周伟华, 王汉奎, 董俊德, 等, 2007. 海南岛三亚湾浮游植物和细菌生物量时空分布特征及环境制约因素研究[J]. 海洋学报, 29(6): 110-119.

ZHOU WEIHUA, WANG HANKUI, DONG JUNDE, et al, 2007. Spatial-temporal variations of phytoplankton and bacterioplankton biomass and their environmental limiting factors in the Sanya Bay, Hainan Island, China[J]. Acta Oceanologica Sinica, 29(6): 110-119 (in Chinese with English abstract).

[16]
张奇亚, 2002. 浮游病毒[J]. 水生生物学报, 26(6): 691-696.

ZHANG QIYA, 2002. Virioplankton[J]. Acta Hydrobiology Sinica, 26(6): 691-696 (in Chinese with English abstract).

[17]
BUNSE C, PINHASSI J, 2017. Marine bacterioplankton seasonal succession dynamics[J]. Trends in Microbiology, 25(6): 494-505.

[18]
COCHRAN P K, PAUL J H, 1998. Seasonal abundance of lysogenic bacteria in a subtropical estuary[J]. Applied and Environmental Microbiology, 64(6): 2308-2312.

[19]
DAI MINHAN, WANG LIFANG, GUO XIANGHUI, et al, 2008. Nitrification and inorganic nitrogen distribution in a large perturbed river/estuarine system: the Pearl River Estuary, China[J]. Biogeosciences, 5(5): 1227-1244.

[20]
FUHRMAN J A, 1999. Marine viruses and their biogeochemical and ecological effects[J]. Nature, 399(6736): 541-548.

[21]
FUHRMAN J A, HEWSON I, SCHWALBACH M S, et al, 2006. Annually reoccurring bacterial communities are predictable from ocean conditions[J]. Proceeding of the National Academy of Sciences of the United States of America, 103(35): 13104-13109.

[22]
GILBERT J A, FIELD D, SWIFT P, et al, 2009. The Seasonal structure of microbial communities in the Western English Channel[J]. Environmental Microbiology, 11(12): 3132-3139.

[23]
KENT A D, YANNARELL A C, RUSAK J A, et al, 2007. Synchrony in aquatic microbial community dynamics[J]. The ISME Journal, 1(1): 38-47.

[24]
MARIE D, BRUSSAARD C P D, THYRHAUG R, et al, 1999. Enumeration of marine viruses in culture and natural samples by flow cytometry[J]. Applied and environmental Microbiology, 65(1): 45-52.

[25]
PATTEN N L, MITCHELL J G, MIDDELBOE M, et al, 2008. Bacterial and viral dynamics during a mass coral spawning period on the Great Barrier Reef[J]. Aquatic Microbial Ecology, 50(3): 209-220.

[26]
POMEROY L R, WILLIAMS P J I, AZAM F, et al, 2007. The microbial loop[J]. Oceanography, 20(2): 28-33.

[27]
SOROKIN Y I, SOROKIN P Y, 2009. Analysis of plankton in the southern Great Barrier Reef: abundance and roles in throphodynamics[J]. Journal of the Marine Biological Association of the United Kingdom, 89(2): 235-241.

[28]
STEWARD G F, CULLEY A I, WOOD-CHARLSON E M, 2013. Marine viruses[M]//LEVIN S A. Encyclopedia of Biodiversity. 2nd ed. London, United Kingdom: Elsevier Inc.: 127-144.

[29]
SUTTLE C A, 2005. Viruses in the sea[J]. Nature, 437(7057): 356-361.

[30]
SUTTLE C A, 2007. Marine viruses—major players in the global ecosystem[J]. Nature Reviews Microbiology, 5(10): 801-812.

[31]
THINGSTAD T F, 2000. Elements of a theory for the mechanisms controlling abundance, diversity, and biogeochemical role of lytic bacterial viruses in aquatic systems[J]. Limnology and Oceanography, 45(6): 1320-1328.

[32]
WEINBAUER M G, 2004. Ecology of prokaryotic viruses[J]. FEMS Microbiology Reviews, 28(2): 127-181.

[33]
WOMMACK K E, COLWELl R R, 2000. Virioplankton: viruses in aquatic ecosystems[J]. Microbiology and Molecular Biology Reviews, 64(1): 69-114.

[34]
ZHANG CHENGLONG, HUANG HUI, YE CHENG, et al, 2013. Diurnal and seasonal variations of carbonate system parameters on Luhuitou fringing reef, Sanya Bay, Hainan Island, South China Sea[J]. Deep Sea Research Part II: Topical Studies in Oceanography, 96: 65-74.

Outlines

/