
Journal of Tropical Oceanography >
Current slip rate and strain accumulation in different tectonic sections of Red River fault zone
Received date: 2017-10-12
Request revised date: 2017-12-18
Online published: 2018-07-16
Supported by
National Natural Science Foundation of China (41461087)
Copyright
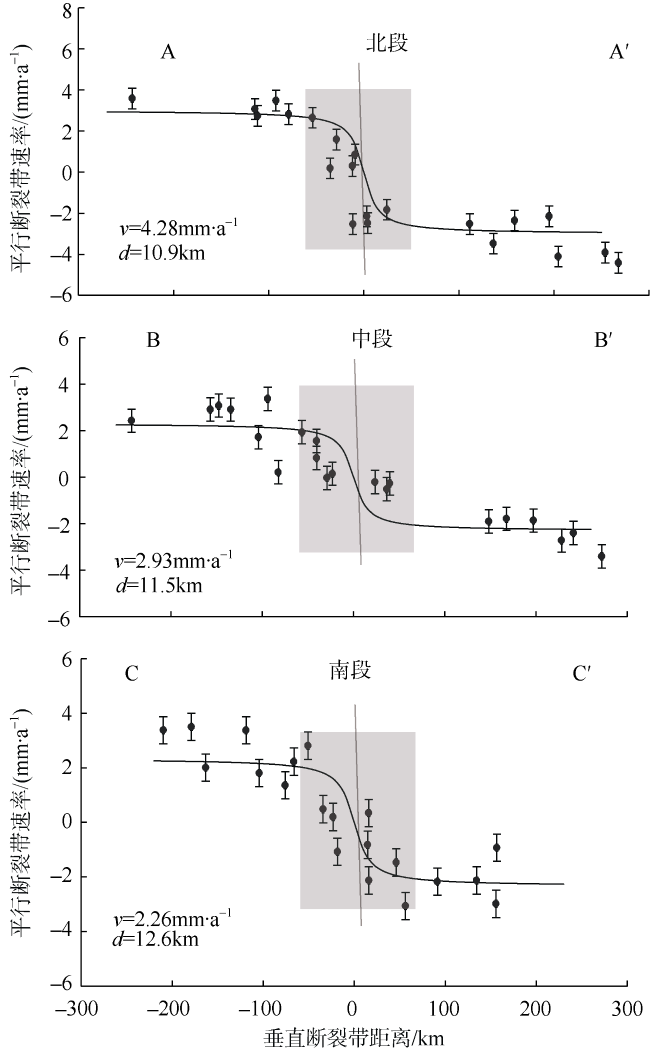
The GPS data from the period of 1999—2015 are part of the project of “Crustal Movement Observation Network of China”. Based on the block model and the spiral dislocation model under elastic half space, the slip rate and locking depth of different Red River fault sections are inversed, and the strain accumulation is calculated by the interpolated uniform grid method. The results indicate that the strike-slip rate and locking depth of Red River fault zone in the northern, central and southern parts are, respectively, about (4.76±0.78) mm•a-1 and 10.9 km, (3.24±0.56) mm•a-1 and 11.5 km and (2.83±0.34) mm•a-1 and 12.6 km. The tension characteristics of the northern and middle sections are obvious, and the extrusion characteristics of the southern section is obvious. The northern part tensile strain value is (20~40)×10-9•a-1, and the southern part compressive strain value is (30~50)×10-9•a-1. The maximum shear strain accumulation in the middle section is relatively weak, with the value of (0~30)×10-9•a-1; the maximum shear strain accumulation in the northern and southern sections are stronger, with the value of (40~80)×10-9•a-1. The maximum shear strain high value area appears in the northern and southern sections of Yuanyang, and the earthquake risk there is large.
Key words: Red River fault; GPS; strain accumulation; slip rate
SUN Yunmei , LI Jinping . Current slip rate and strain accumulation in different tectonic sections of Red River fault zone[J]. Journal of Tropical Oceanography, 2018 , 37(4) : 89 -96 . DOI: 10.11978/2017110
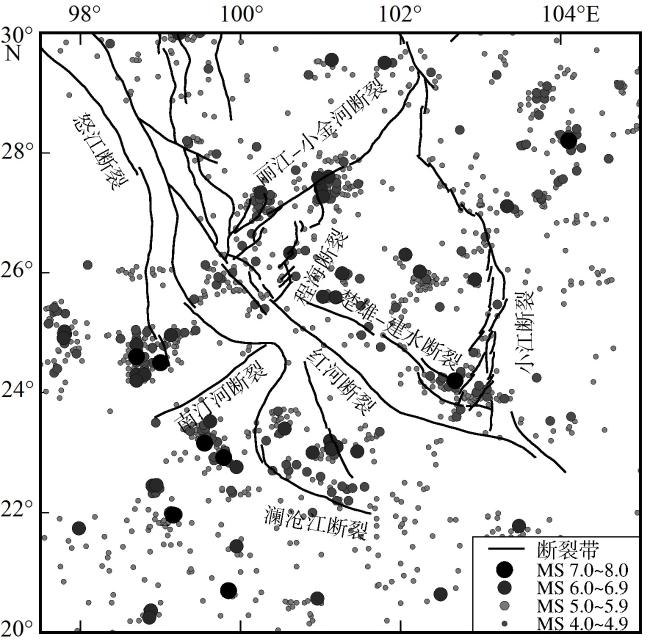
Fig. 1 Tectonic setting and earthquakes distribution of the Red River fault zone图1 红河断裂带构造背景及地震分布图 |
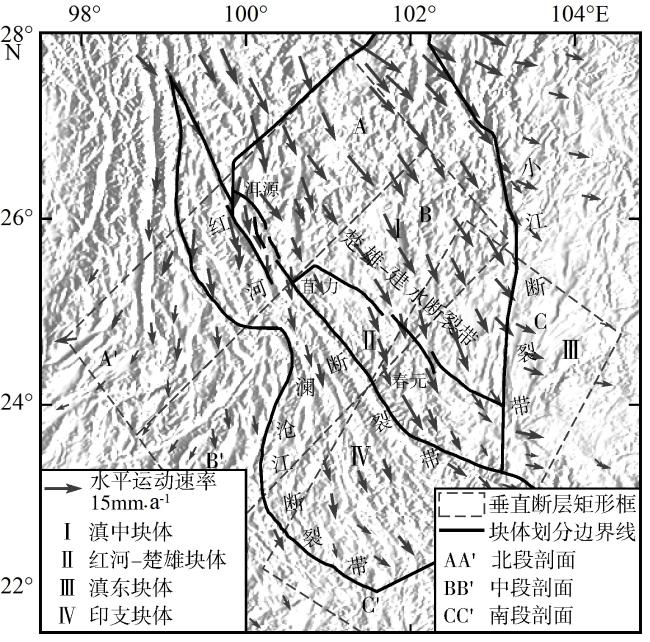
Fig. 2 Profiles of different tectonic sections of the Red River fault zone, and selected calculation blocks图2 红河断裂带不同构造区段剖面及选取的计算块体 |
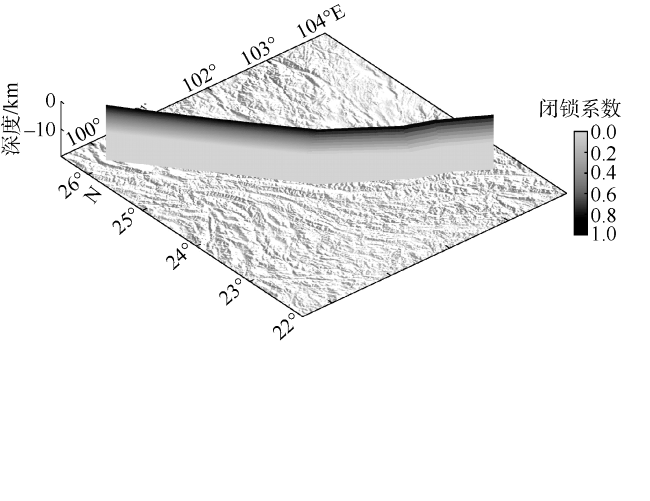
Fig. 3 Locking level of the Red River fault zone图3 红河断裂带的闭锁程度 |
Fig. 4 GPS velocity profile of the northern, middle and southern sections of the Red River fault zone图4 红河断裂带北、中、南三分段的GPS速度剖面 |
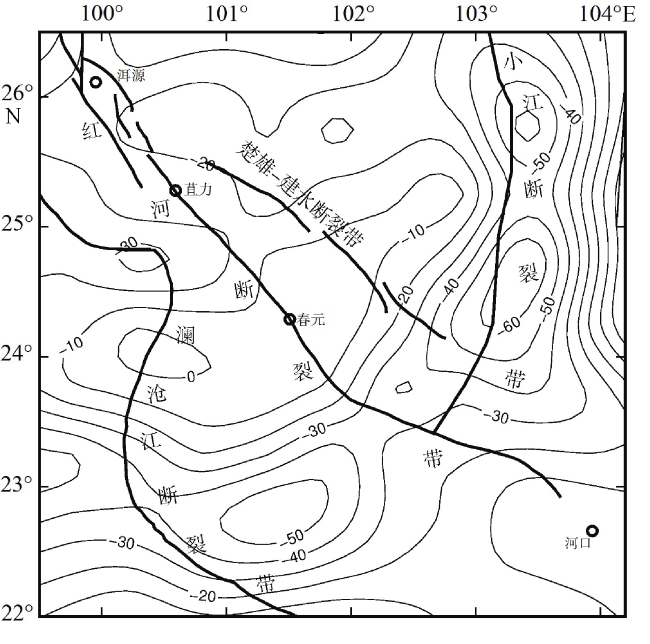
Fig. 5 Extrusion contour of the Red River fault zone图5 红河断裂带挤压应变等值线 |
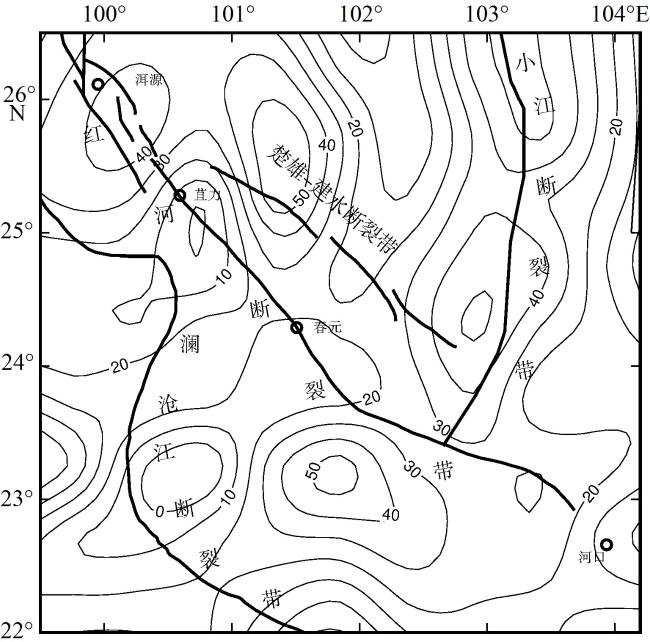
Fig. 6 Tensile contour of the Red River fault zone图6 红河断裂带拉张应变等值线 |
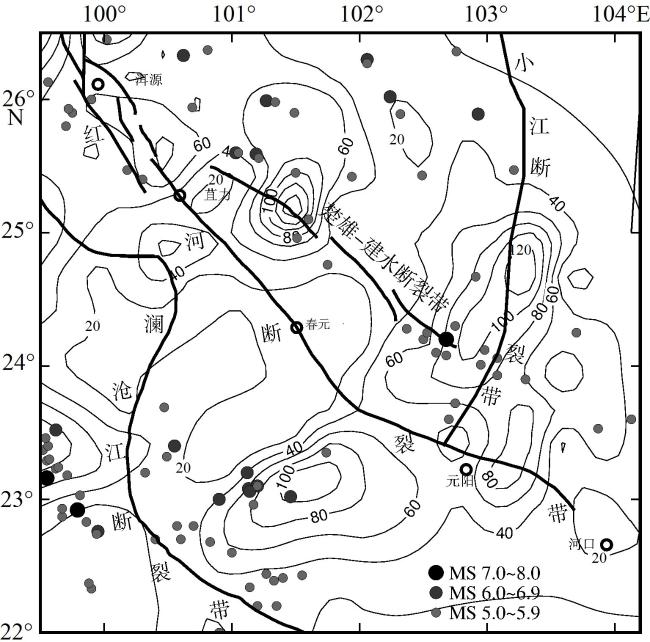
Fig. 7 Max shear contour of the Red River fault zone图7 红河断裂带最大剪应变等值线 |
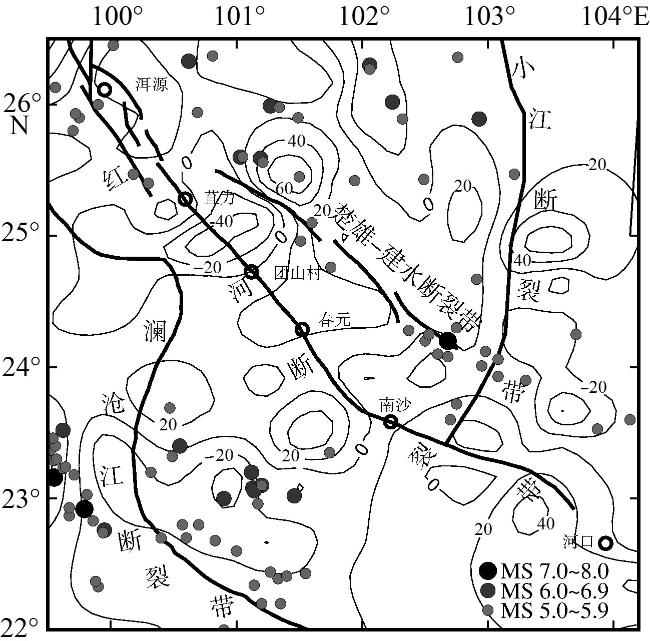
Fig. 8 Surface expansion contour of the Red River fault zone图8 红河断裂带地区面膨胀等值线 |
Tab.1 Calculation of the slip rate of the Red River fault zone based on different models表1 基于不同模型计算红河断裂带的滑动速率 |
| 分段 | 基于块体负位错模型 | 基于弹性半空间下的螺旋位错模型 | 地质测定 | ||
|---|---|---|---|---|---|
| 走滑速率/(mm•a-1) | 闭锁深度/km | 走滑速率/(mm•a-1) | 闭锁深度/km | 走滑速率/(mm•a-1) | |
| 北段 | 4.8±0.8 | 10.0 | 4.3±0.5 | 10.9 | 3.6 (虢顺民 等, 2001), 2~5 (Allen et al, 1984) |
| 中段 | 3.2±0.6 | 10.0 | 2.9±0.6 | 11.5 | 2.7 (虢顺民 等, 2001), 3~4 (向宏发 等, 2006) |
| 南段 | 2.8±0.3 | 10.0 | 2.3±0.1 | 12.6 | 2.8 (虢顺民 等, 2001) |
注: 走滑速率为正表示右旋走滑 |
The authors have declared that no competing interests exist.
| 1 |
|
| 2 |
|
| 3 |
|
| 4 |
|
| 5 |
|
| 6 |
|
| 7 |
|
| 8 |
|
| 9 |
|
| 10 |
|
| 11 |
|
| 12 |
|
| 13 |
|
| 14 |
|
| 15 |
|
| 16 |
|
| 17 |
|
| 18 |
|
| 19 |
|
| 20 |
|
| 21 |
|
| 22 |
|
| 23 |
|
| 24 |
|
/
| 〈 |
|
〉 |
