
Journal of Tropical Oceanography >
Design and application of data collecting system and data receiving system for water quality monitoring buoy
Received date: 2018-01-04
Request revised date: 2018-03-19
Online published: 2018-10-13
Supported by
National Key Research and Development Plan (2017YFC0506305)
Welfare Project of the Oceanic Administration (201305019)
National Natural Science Foundation of China (41406205)
Science and Technology Planning Project of Guangzhou City China (201504010034)
Copyright
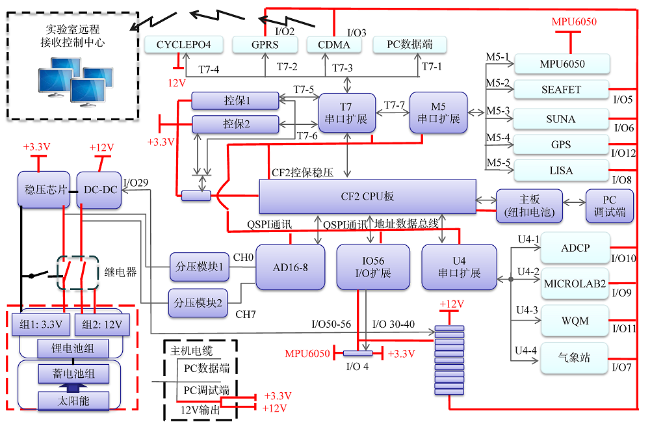
To obtain stable time series observations at low power consumption, a data acquisition system for water quality monitoring buoy was designed. It includes CPU module, control/protection module, communication positioning module, and interface expansion module. In this data acquisition system, a CF2 mainboard was used as the CPU module, with the assistant of a multi-functional board, which uses a single chip microcomputer as a control unit. All the following functions, such as collecting data, saving data and communication, and expanding the modules to realize counting, I/O control, AD (Analog to Digital) conversion, timing, and other functions can be accomplished. A double “watchdog” was designed for the control/protection module to achieve the entire process of independent work unattended in all-weather conditions. The water quality monitoring data system was designed for the purposes of remote receiving, storing and displaying of water quality monitoring data. It includes four key components: data acquisition module, data processing module, systematic early warning module, and data display module, which have the following advantage characters: easy operation, high degree of automation, and graphical display intuitively easy to read.
CAO Wenxi , SUN Zhaohua , LI Cai , ZOU Guowang . Design and application of data collecting system and data receiving system for water quality monitoring buoy[J]. Journal of Tropical Oceanography, 2018 , 37(5) : 1 -6 . DOI: 10.11978/2018003
Fig. 1 Hardware structure of the data acquisition and control system for water quality monitoring buoy. CYCLEPO4: phosphate sensor; SEAFET: pH sensor; LISA: chemical oxygen demand sensor; SUNA: nitrate sensor; ADCP: acoustic doppler current profiler sensor; MICROLAB2: ammonium sensor; WQM: water quality sensor图1 水质浮标在线监测系统数据采集及控制硬件设计框图 |
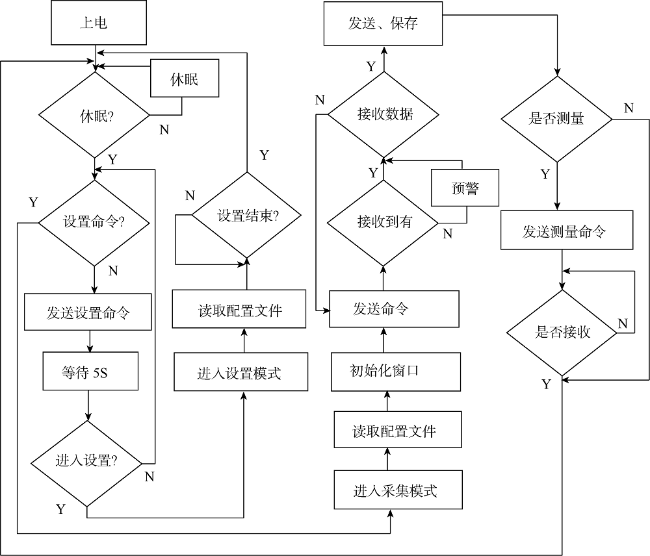
Fig. 2 Software flow diagram of data acquisition system for water quality monitoring buoy图2 水质浮标数据采集系统软件流程图 |
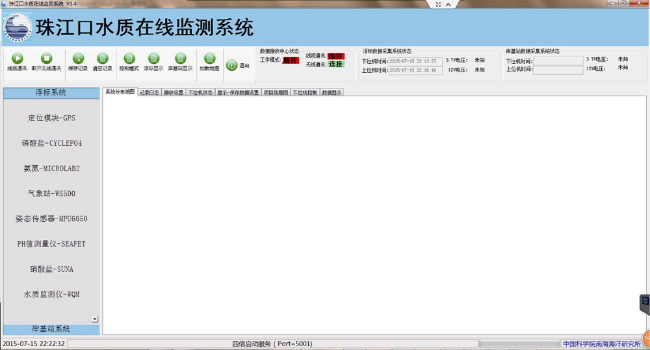
Fig. 3 The interface of data receiving system for water quality monitoring buoy图3 水质浮标数据接收中心界面 |
Tab. 1 The functions of the data receiving software for water quality monitoring buoy表1 水质浮标数据接收软件功能表 |
| 序号 | 名称 | 描述 |
|---|---|---|
| 1 | 工具栏 | 工具栏按钮包括接收数据控制、日志记录操作、数据显示画面切换、地图加载、程序退出 |
| 2 | 状态栏 | 包括浮标、岸基站的电压以及时间显示、数据接收中心状态 |
| 3 | 传感器列表 | 传感器列表包含该项目的所有集成仪器, 单击可以看到该个传感器的数据显示, 如序号5 |
| 4 | 地图 | 地图加载、定位显示 |
| 5 | 单个传感器显示 | 图表显示单个传感器数据 |
| 6 | 状态框 | 显示数据接收中心系统时间、最新日志记录、预警信息 |
| 7 | 项目信息 | 显示项目现场图、地理信息图、项目信息 |
| 8 | 日志记录 | 显示系统全部的运行信息 |
| 9 | 显示日期设置 | 选择需要显示的日期和接收方式 |
| 10 | 数据路径选择 | 选择传感器数据、日志记录、错误日志保存路径 |
| 11 | 全屏显示界面 | 显示整个项目的传感器数据、项目信息 |
| 12 | 接收参数设置 | 设置接收的参数 |
| 13 | 系统配置 | 配置数据采集系统的采集参数 |
| 14 | 握手设置 | 选择握手方式 |
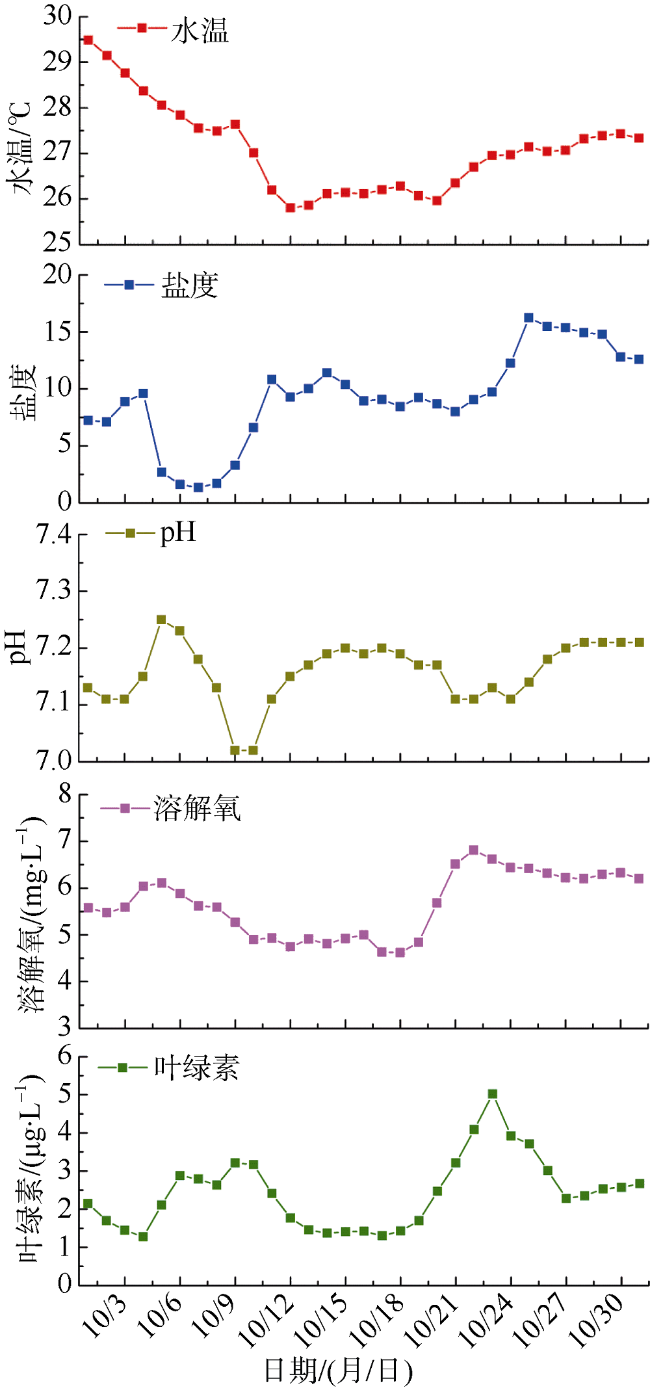
Fig. 4 Examples of the diurnal variation of water quality data obtained by the monitoring buoy图4 浮标所在海域水温、盐度、pH、溶解氧、叶绿素日均值变化 |
The authors have declared that no competing interests exist.
| [1] |
|
| [2] |
|
| [3] |
|
| [4] |
|
| [5] |
|
| [6] |
|
/
| 〈 |
|
〉 |
