
Journal of Tropical Oceanography >
Vertical variability of chlorophyll a concentration and its responses to hydrodynamic processes in the northeastern South China Sea in summer
Received date: 2017-11-10
Request revised date: 2018-03-07
Online published: 2018-10-13
Supported by
National Natural Science Foundation of China (41776045, 41376042, 41576030, 41776044)
Open Project Program of the State Key Laboratory of Tropical Oceanography (South China Sea Institute of Oceanology, Chinese Academy of Sciences) (LTOZZ1602)
Copyright
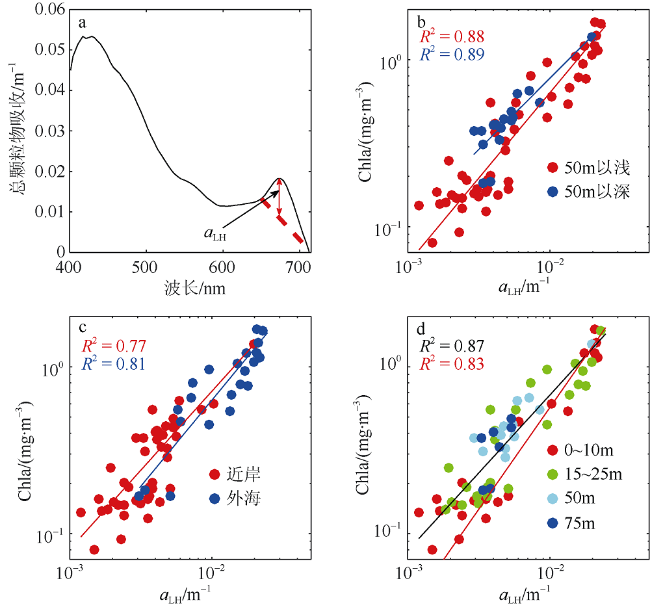
Chlorophyll a (Chla) concentration is an important indicator of phytoplankton biomass for estimating primary production, which exhibits inhomogeneous vertical distribution. In this study, optical measurements with high vertical resolution were used for studying the spatio-temporal variability of Chla profiles and its influencing mechanism, providing us much insights for understanding marine environmental dynamics in the South China Sea. In this study, an optical inversion method was proposed to retrieve Chla profiles from in situ measurements with high-spectral absorption/attenuation spectrophotometer in the northeastern South China Sea. Based on the in situ data of the Kuroshio Cruise in summer 2015, an empirical relationship between the absorption line height at 676 nm and Chla was developed for inverting Chla with a high accuracy (Chla=49.96×(aLH(676) (676))0.9339, the coefficient of determination R2=0.87, the root mean square error RMSE=0.16 mg·m-3). Moreover, the response characteristics of Chla profiles to different hydrodynamic processes were studied. Results showed that large spatial differences existed in the vertical distribution of Chla. In the nearshore area, surface Chla varied from 0.42 to 1.57 mg·m-3, which generally followed a decreasing trend with depth. Uniform vertical distribution of Chla in upper ocean was observed in the coastal upwelling region. The Subsurface Chlorophyll Maximum (SCM) layer is nearly ubiquitous in stratified waters of the open ocean, with its vertical structure being influenced by mesoscale processes. The depth of SCM ranged between 34 and 100 m, which showed consistent variability with the isopycnal depth of 1023 kg·m-3. The SCM layer was uplifted to about 34 m due to the mixing effect in the upper ocean caused by Kuroshio intrusion in the western area of Luzon Island. The uplifting and widening of the SCM layer were also observed in the area affected by a cold eddy, with obviously different features in the eddy center from that on the eddy edge.
XU Wenlong , WANG Guifen , ZHOU Wen , XU Zhantang , CAO Wenxi . Vertical variability of chlorophyll a concentration and its responses to hydrodynamic processes in the northeastern South China Sea in summer[J]. Journal of Tropical Oceanography, 2018 , 37(5) : 62 -73 . DOI: 10.11978/2017121
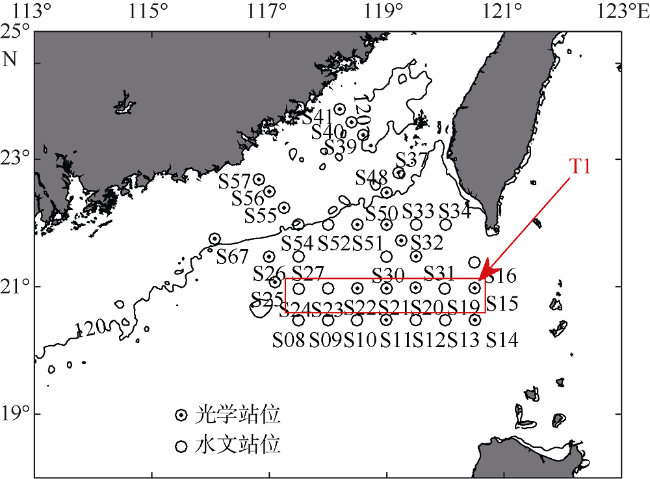
Fig. 1 Sampling sites in the northern South China Sea during August 2015. The section profile (T1) used in |
Fig. 2 Estimation of Chlorophyll a concentration from a bio-optical algorithm. The description of absorption line height (a) and scatter plots of the absorption line height in 676 nm and chlorophyll a concentration, for a variety of standards of division (b, c, d). (d) Black line is the regression obtained in this study, while the red line is based on Boss et al (2013). The coefficient of determination between the logarithms of aLH(676) and Chla is 0.87, and the root mean square error (RMSE) is 0.16 mg·m-3. N=69图2 叶绿素a浓度生物光学反演算法 |
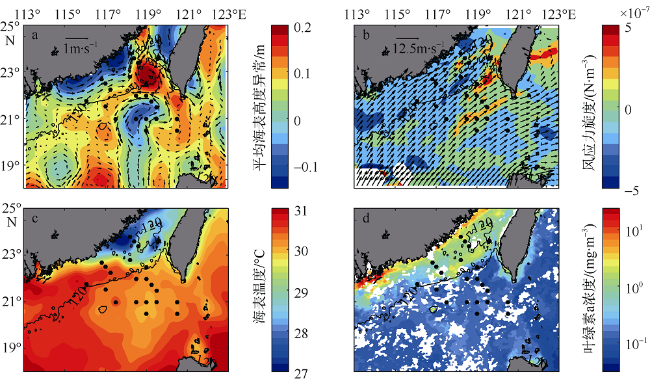
Fig. 3 Spatial distributions of mean sea level anomaly and geostrophic velocities (a), sea surface wind and wind stress curl (b), and sea surface temperature (c), together with sea surface chlorophyll during the survey (d). All data are downloaded from the websites (MSLA: ftp.aviso.altimetry.fr; SSW: ftp://eclipse.ncdc.noaa.gov/pub/seawinds/; SST: http://www.ghrsst-pp.org; Chla: http://hermes. acri.fr). Vectors in (a) and (b) are surface geostrophic currents and wind speed, respectively. Geostrophic current is from the AVSIO data. MSLA, SeaWind, SST, and Chla are 13-day-mean data during the period 5-17 August 2015. Wind stress curl is the data of 7 August 2015图3 航次期间南海北部遥感数据分布 |
Fig. 4 Chlorophyll a profiles estimated from absorption line height. Red/black solid lines represent stations with water depth lower/higher than 120 m图4 基于吸收线性高度反演得到的叶绿素垂向分布剖面 |
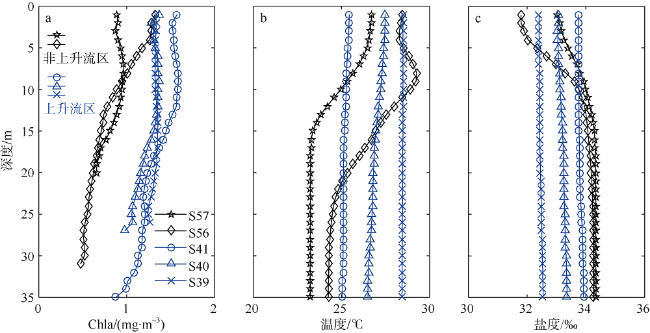
Fig. 5 Vertical distributions of chlorophyll a concentration (a), temperature (b) and salinity (c). Blue and red are marked inside and outside the upwelling influenced area, respectively图5 近岸叶绿素a浓度(a)、温度(b)和盐度(c)及分布剖面 |
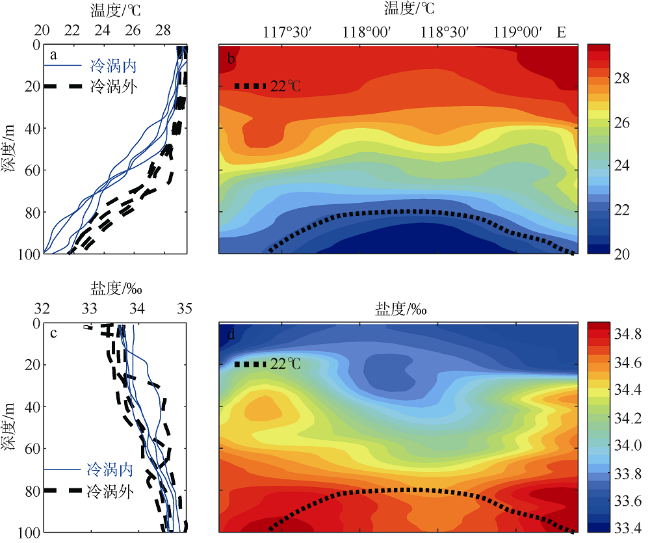
Fig. 6 Temperature (a) and salinity (b) profiles within the cold eddy. Sectional distribution of temperature (c) and salinity (d) along transect T1. The black dashed line corresponds to the thermocline (defined as the 22°C contour)图6 冷涡断面(T1)的温度及盐度分布 |
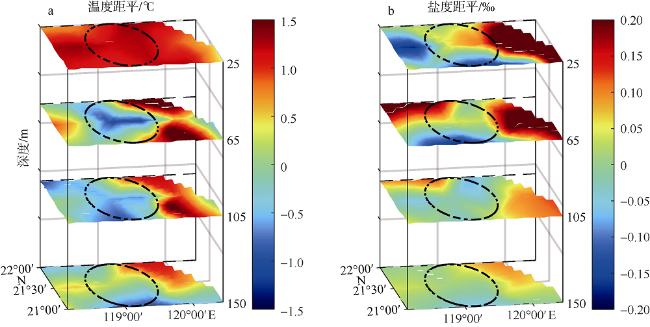
Fig. 7 Three-dimensional structures of temperature anomaly (°C)(a) and salinity anomaly (‰)(b). The black dashed line indicates the area affected by the cold eddy图7 冷涡影响范围温度距平(°C) (a)和盐度距平(‰)切面图(b) |
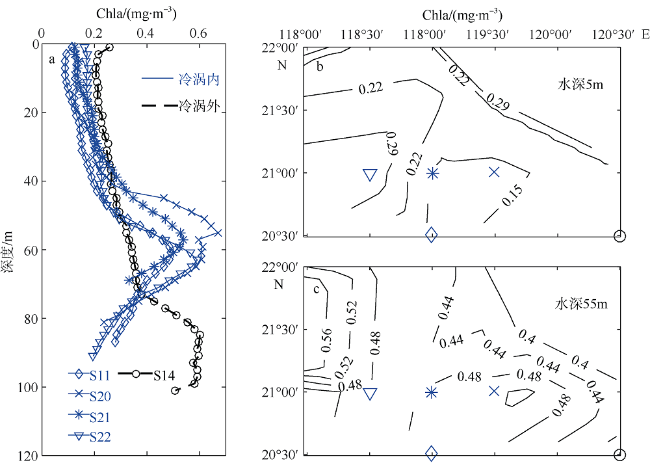
Fig. 8 Vertical distribution of chlorophyll a concentration (mg·m-3) in a cold eddy in (a). Horizontal distribution of chlorophyll a concentration (mg·m-3) in a cold eddy (b, c); the contour intervals in (b) and (c) are 0.07 mg·m-3 and 0.04 mg·m-3, respectively. The symbols represent the station information used in (a)图8 冷涡叶绿素a浓度(mg·m-3)分布剖面及切面 |
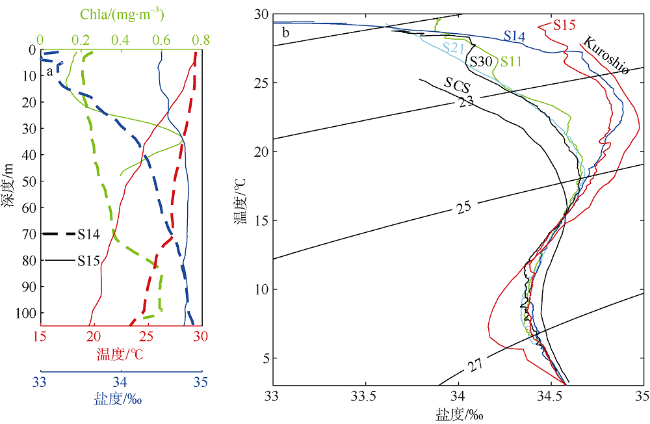
Fig. 9 Observed chlorophyll a concentration (green), temperature (red) and salinity (blue) profiles at the two sites in the western area of Luzon Island (a) and temperature versus salinity plots for five stations in the western area of Luzon Island (b). Typical South China Sea (SCS) and Kuroshio T/S curves are based on measurements made by Chen and Huang (1996). Solid lines are isopycnal contour lines (units: kg·m-3 ). S11, S20 and S21 are located in the western Luzon Strait; S14 and S15 are close to the region of Kuroshio intrusion图9 黑潮影响区叶绿素a浓度及温盐分布 |
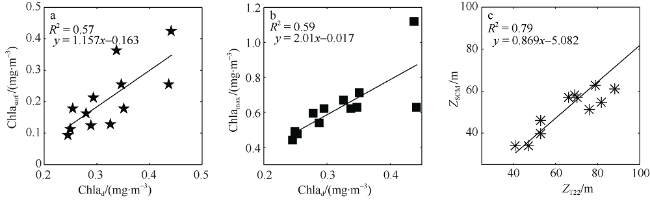
Fig. 10 Statistical analysis of related parameters. Chlad: The average of water column integrated chlorophyll a concentration;, Chlamax: subsurface chlorophyll maximum; ZSCM: subsurface chlorophyll maximum layer; ZT22: depth of 22°C; N=12图10 相关参数统计分析图 |
The authors have declared that no competing interests exist.
| [1] |
|
| [2] |
|
| [3] |
|
| [4] |
SHAN,
|
| [5] |
|
| [6] |
|
| [7] |
|
| [8] |
|
| [9] |
|
| [10] |
|
| [11] |
|
| [12] |
|
| [13] |
|
| [14] |
|
| [15] |
|
| [16] |
|
| [17] |
|
| [18] |
|
| [19] |
|
| [20] |
|
| [21] |
|
| [22] |
|
| [23] |
|
| [24] |
|
| [25] |
|
| [26] |
|
| [27] |
|
| [28] |
|
| [29] |
|
| [30] |
|
| [31] |
|
| [32] |
|
| [33] |
|
| [34] |
|
| [35] |
|
| [36] |
|
| [37] |
|
| [38] |
|
| [39] |
|
| [40] |
|
| [41] |
|
| [42] |
|
/
| 〈 |
|
〉 |

