
Journal of Tropical Oceanography >
Bottom water temperature measurements in the South China Sea, eastern Indian Ocean and western Pacific Ocean*
Received date: 2017-10-20
Request revised date: 2018-02-27
Online published: 2018-10-13
Supported by
Instrument Developing Project of the Chinese Academy of Sciences (YZ201136)
National Natural Science Foundation of China (41106086, 41474065, 41376059, 41376061, 91428205, 41576036, 41076028, 41476167, and 41606080)
Chinese Academy of Sciences Scholarship, the Strategic Priority Research Program of the Chinese Academy of Sciences (XDA11040303, XDA13010104 and XDA11030301)
National High Technology Research and Development Program of China (“863” Program) (2006AA07A203 and 2009AA09A201-05)
China Geological Survey Program (1212011220117)
Open Project of Key Laboratory of Submarine Geosciences, State Oceanic Administration (KLSG1502)
and Mariana Trench Project of the Chinese Academy of Sciences (Y4SL021001).
Copyright
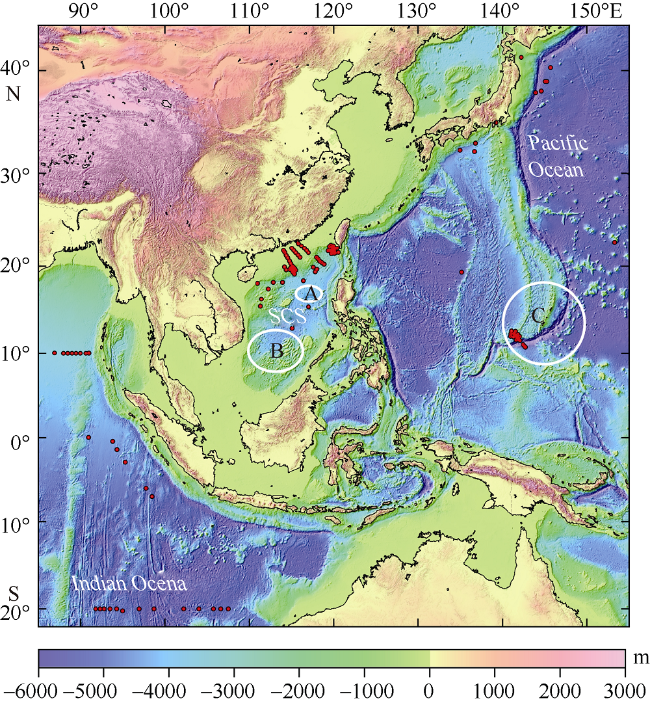
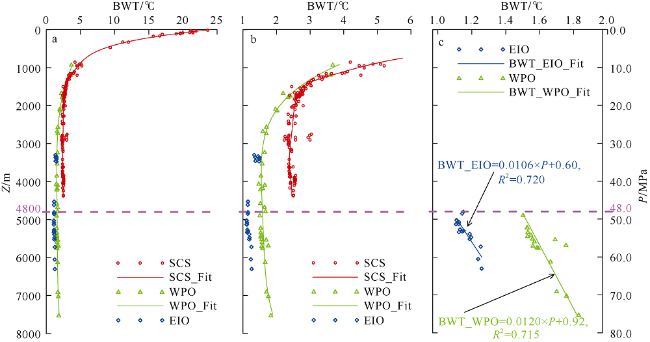
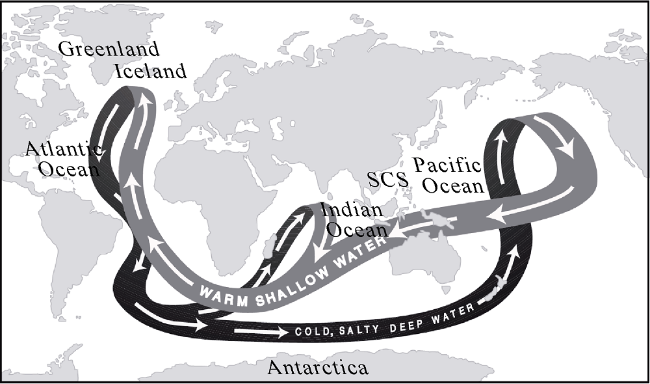
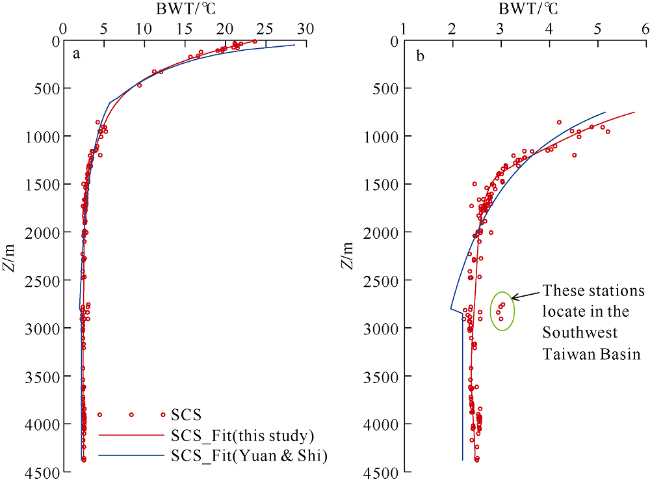
In this paper, we reported the latest bottom water temperature (BWT) data, from 158 stations in the South China Sea (SCS), 30 stations in the eastern Indian Ocean (EIO) and 37 stations in the western Pacific Ocean (WPO). Based on the new data in the SCS and WPO, we obtained good empirical relationships between BWT and water depth. They can provide accurate and reliable boundary conditions for geophysics and physical oceanography in the SCS and WPO. Furthermore, it will be very helpful for the investigation and assessment of oil and gas resources in the oceans. The measured BWT in the SCS (~2.47°C) is higher than that in the EIO (~1.34°C) and WPO (~1.60°C) where the water depth is deeper than 3500 m. This is consistent with the model of the great ocean conveyor belt since the cold and saline deep water, which is from Greenland, Iceland in the North Atlantic and the sea area around the Antarctica, enters the Indian and Pacific oceans from the south. In the Southwest Taiwan Basin, the BWTs at several stations are around 3.00°C, which is clearly higher than the average value (~2.33°C) at other stations with the same water depth range (2700~3000 m) in this basin. The local high anomaly of BWT is probably caused by the hydrothermal activity in the Southwest Taiwan Basin. In the EIO and WPO, the BWT increases slightly at the rates of 10.6 mK·MPa-1 and 12.0 mK·MPa-1, respectively, when the water depth is deeper than 4800 m. The rising rates are consistent with the estimated adiabatic pressure derivative of the temperature of the deep bottom water. It indicates that the BWT rising is mainly caused by the adiabatic compression in the deep water.
YANG Xiaoqiu , SHI Xiaobin , ZHAO Junfeng , YU Chuanhai , GAO Hongfang , CHEN Aihua , LU Yuanzheng , CEN Xianrong , LIN Weiren , ZENG Xin , XU Hehua , REN Ziqiang , ZHOU Shengqi , XU Ziying , SUN Jinlong , KAMIYA Nana , LIN Jian . Bottom water temperature measurements in the South China Sea, eastern Indian Ocean and western Pacific Ocean*[J]. Journal of Tropical Oceanography, 2018 , 37(5) : 86 -97 . DOI: 10.11978/2017113
Fig. 1 Distribution of BWT stations in the South China Sea, eastern Indian Ocean and western Pacific Ocean. Parts of BWT stations located in areas A, B and C are not shown because their location information is still not released to the public according the Data Management Policy |
Fig. 2 (a) BWT verses water depth (Z) in the South China Sea (SCS; red circle), eastern Indian Ocean (EIO; blue diamond) and western Pacific Ocean (WPO; green triangle). The red and green solid lines are the fitted BWT curves shown in Eq. (1) and Eq. (2), respectively. (b) is an enlarged figure for BWT < 6°C. (c) shows the relationships between BWT and water pressure (P) in the EIO and WPO for water depth deeper than 4800 m |
Fig. 3 The model of the great ocean conveyor belt. Modified from Broecker (2010) |
Tab. 1 Estimate of β of bottom water in the eastern Indian Ocean and western Pacific Ocean |
| No. | T0/°C | T0/K | P/MPa | S/‰ | αv×10-6 /°C-1 | ρ×103 /(kg·m-3) | cp×103 /(J·kg-1·°C-1) | (ρcp) /(MJ·m-3·°C-1) | β=(∂T/∂P)s /(°C·MPa-1) | Sea Area |
|---|---|---|---|---|---|---|---|---|---|---|
| 1 | 1.200 | 274.350 | 48.0 | 34.698 | 179.9 | 1.049 | 3.861 | 4.051 | 0.0122 | EIO |
| 2 | 1.200 | 274.350 | 50.0 | 34.698 | 183.9 | 1.050 | 3.857 | 4.050 | 0.0125 | EIO |
| 3 | 1.200 | 274.350 | 60.0 | 34.698 | 203.1 | 1.054 | 3.838 | 4.046 | 0.0138 | EIO |
| 4 | 1.200 | 274.350 | 70.0 | 34.698 | 221.1 | 1.058 | 3.821 | 4.044 | 0.0150 | EIO |
| 5 | 1.200 | 274.350 | 80.0 | 34.698 | 237.9 | 1.062 | 3.805 | 4.043 | 0.0161 | EIO |
| 6 | 1.665 | 274.815 | 48.0 | 34.698 | 183.5 | 1.049 | 3.863 | 4.053 | 0.0124 | WPO |
| 7 | 1.665 | 274.815 | 50.0 | 34.698 | 187.4 | 1.050 | 3.859 | 4.052 | 0.0127 | WPO |
| 8 | 1.665 | 274.815 | 60.0 | 34.698 | 206.3 | 1.054 | 3.840 | 4.048 | 0.0140 | WPO |
| 9 | 1.665 | 274.815 | 70.0 | 34.698 | 224.0 | 1.058 | 3.823 | 4.046 | 0.0152 | WPO |
| 10 | 1.665 | 274.815 | 80.0 | 34.698 | 240.5 | 1.062 | 3.807 | 4.045 | 0.0163 | WPO |
Notes: 1) T0, P and S are the deep ocean temperature, pressure, and salinity, respectively; 2) αv, ρ, cp, (ρcp), and β=(∂T/∂P)s are the coefficient of volumetric thermal expansion, density, heat capacity, volumetric heat capacity, and the adiabatic pressure derivative of the temperature of sea water. All αv, ρ and cp were calculated at the constant salinity of 34.698‰ and different temperatures and pressures by TEOS-10. The official source of information about the Thermodynamic Equation of Seawater - 2010 is at http://www.marine.csiro.au/~jackett/TEOS-10 |
Fig. 4 Relationships between BWT and water depth in the SCS in this study (red solid curve) and the previous work (blue solid curve). The red circles are the BWT data in this study. The BWT ranges from 0 to 30°C (a) and 0 to 6°C (b), respectively |
Appendix 1 The detailed information of the bottom water temperature (BWT) stations |
| No. | Station | Longitude | Latitude | Water Depth /m | BWT /°C | Method | Sea Area | Measurement Time/(Year. Month) | Cruise or Reference |
|---|---|---|---|---|---|---|---|---|---|
| 1 | SCS2010HF-Test03 | 110°57′48″E | 18°4′11″N | 1158 | 3.479 | HF Probe | SCS | 2010.03 | (1) |
| 2 | SCS2010HF01 | 117°58′22″E | 21°0′2″N | 1440 | 2.916 | HF Probe | SCS | 2010.08-09 | (1) |
| 3 | SCS2010HF02 | 118°11′27″E | 20°47′44″N | 2230 | 2.347 | HF Probe | SCS | 2010.08-09 | (1) |
| 4 | SCS2010HF03 | 118°22′21″E | 20°33′48″N | 2410 | 2.353 | HF Probe | SCS | 2010.08-09 | (1) |
| 5 | SCS2010HF04 | 118°36′1″E | 20°23′46″N | 2810 | 2.362 | HF Probe | SCS | 2010.08-09 | (1) |
| 6 | SCS2010HF05 | 118°51′24″E | 20°12′20″N | 2866 | 2.309 | HF Probe | SCS | 2010.08-09 | (1) |
| 7 | SCS2012HF01 | 114°46′47″E | 19°38′20″N | 1516 | 2.850 | HF Probe | SCS | 2012.09 | (2) |
| 8 | SCS2013-OBS05 | 111°26′58″E | 16°15′43″N | 856 | 4.198 | OBS | SCS | 2013.05-06 | (3) |
| 9 | SCS2013-OBS10 | 112°15′42″E | 17°25′57″N | 1204 | 3.255 | OBS | SCS | 2013.05-06 | (3) |
| 10 | SCS2014-OBS30 | 117°35′41″E | 19°52′16″N | 2815 | 2.254 | OBS | SCS | 2014.05-06 | (4) |
| 11 | SCS2014-OBS33 | 117°49′22″E | 19°22′47″N | 3616 | 2.494 | OBS | SCS | 2014.05-06 | (4) |
| 12 | SCS2014-OBS36 | 118°0′51″E | 19°39′3″N | 3168 | 2.454 | OBS | SCS | 2014.05-06 | (4) |
| 13 | SCS2015-Test01 | 115°41′12″E | 22°44′42″N | 14 | 23.636 | SBC | SCS | 2015.06-07 | (5) |
| 14 | SCS2015CTD-01 | 115°48′22″E | 22°29′50″N | 31 | 21.141 | CTD | SCS | 2015.06-07 | (5) |
| 15 | SCS2015CTD-02 | 116°9′56″E | 22°14′59″N | 47 | 21.165 | CTD | SCS | 2015.06-07 | (5) |
| 16 | SCS2015CTD-03 | 116°30′3″E | 21°59′58″N | 86 | 19.961 | CTD | SCS | 2015.06-07 | (5) |
| 17 | SCS2015CTD-04 | 116°45′10″E | 21°45′20″N | 165 | 16.618 | CTD | SCS | 2015.06-07 | (5) |
| 18 | SCS2015CTD-05 | 116°59′42″E | 21°29′46″N | 328 | 11.193 | CTD | SCS | 2015.06-07 | (5) |
| 19 | SCS2015CTD-06 | 115°59′37″E | 20°59′53″N | 330 | 12.025 | CTD | SCS | 2015.06-07 | (5) |
| 20 | SCS2015CTD-07 | 115°45′28″E | 21°14′22″N | 123 | 16.974 | CTD | SCS | 2015.06-07 | (5) |
| 21 | SCS2015CTD-08 | 115°30′10″E | 21°30′6″N | 109 | 19.027 | CTD | SCS | 2015.06-07 | (5) |
| 22 | SCS2015CTD-09 | 115°14′53″E | 21°45′2″N | 90 | 19.619 | CTD | SCS | 2015.06-07 | (5) |
| 23 | SCS2015CTD-10 | 115°0′11″E | 22°0′11″N | 59 | 21.465 | CTD | SCS | 2015.06-07 | (5) |
| 24 | SCS2015CTD-11 | 114°3′36″E | 21°45′48″N | 39 | 21.925 | CTD | SCS | 2015.06-07 | (5) |
| 25 | SCS2015CTD-12 | 114°12′1″E | 21°31′12″N | 55 | 21.448 | CTD | SCS | 2015.06-07 | (5) |
| 26 | SCS2015CTD-13 | 114°22′39″E | 21°12′35″N | 76 | 20.997 | CTD | SCS | 2015.06-07 | (5) |
| 27 | SCS2015CTD-14 | 114°33′6″E | 20°53′53″N | 82 | 21.471 | CTD | SCS | 2015.06-07 | (5) |
| 28 | SCS2015CTD-15 | 114°44′1″E | 20°35′57″N | 108 | 19.624 | CTD | SCS | 2015.06-07 | (5) |
| 29 | SCS2015CTD-16 | 114°55′6″E | 20°18′0″N | 174 | 15.669 | CTD | SCS | 2015.06-07 | (5) |
| 30 | SCS2015CTD-17 | 114°44′1″E | 20°35′57″N | 1008 | 4.610 | CTD | SCS | 2015.06-07 | (5) |
| 31 | SCS2015CTD-17-3 | 115°6′43″E | 20°0′4″N | 904 | 4.872 | CTD | SCS | 2015.06-07 | (5) |
| 32 | SCS2015HF-01(CTD) | 114°58′5″E | 19°41′57″N | 1612 | 2.755 | CTD | SCS | 2015.06-07 | (5) |
| 33 | SCS2015HF-02(CTD) | 115°5′11″E | 19°30′25″N | 1734 | 2.577 | CTD | SCS | 2015.06-07 | (5) |
| 34 | SCS2015HF-01 | 114°58′36″E | 19°41′48″N | 1636 | 2.763 | HF Probe | SCS | 2015.06-07 | (5) |
| 35 | SCS2015HF-02 | 115°6′1″E | 19°29′55″N | 1758 | 2.578 | HF Probe | SCS | 2015.06-07 | (5) |
| 36 | SCS2015HF-03-1 | 115°13′52″E | 19°18′5″N | 1859 | 2.565 | HF Probe | SCS | 2015.06-07 | (5) |
| 37 | SCS2015HF-04 | 115°20′27″E | 19°6′30″N | 2296 | 2.436 | HF Probe | SCS | 2015.06-07 | (5) |
| 38 | SCS2015HF-05 | 115°16′52″E | 19°13′59″N | 2019 | 2.513 | HF Probe | SCS | 2015.06-07 | (5) |
| 39 | SCS2015HF-06 | 115°10′29″E | 19°23′24″N | 1775 | 2.607 | HF Probe | SCS | 2015.06-07 | (5) |
| 40 | SCS2015HF-07 | 115°2′37″E | 19°35′30″N | 1775 | 2.678 | HF Probe | SCS | 2015.06-07 | (5) |
| 41 | SCS2015HF-08 | 114°54′53″E | 19°47′43″N | 1140 | 4.034 | HF Probe | SCS | 2015.06-07 | (5) |
| 42 | SCS2015-ST01 | 111°20′28″E | 15°27′30″N | 1105 | 4.113 | ST | SCS | 2015.07-2016.10 | (5, |
| 43 | SCS2016CTD-A20 | 114°9′46″E | 19°55′10″N | 472 | 9.370 | CTD | SCS | 2016.09 | (7) |
| 44 | SCS2016CTD-A21 | 114°20′42″E | 19°35′57″N | 954 | 5.206 | CTD | SCS | 2016.09 | (7) |
| 45 | SCS2016HF-01 | 115°4′45″E | 19°45′30″N | 1653 | 2.756 | HF Probe | SCS | 2016.09 | (7) |
| 46 | SCS2016HF-02 | 115°9′26″E | 19°38′9″N | 1907 | 2.597 | HF Probe | SCS | 2016.09 | (7) |
| 47 | SCS2016HF-03 | 115°12′1″E | 19°32′9″N | 1998 | 2.513 | HF Probe | SCS | 2016.09 | (7) |
| 48 | SCS2016HF-04 | 115°16′11″E | 19°26′26″N | 2044 | 2.472 | HF Probe | SCS | 2016.09 | (7) |
| 49 | SCS2016HF-06 | 115°28′37″E | 19°33′19″N | 2285 | 2.439 | HF Probe | SCS | 2016.09 | (7) |
| 50 | SCS2016HF-07 | 115°22′27″E | 19°43′15″N | 1900 | 2.602 | HF Probe | SCS | 2016.09 | (7) |
| 51 | SCS2016HF-08 | 114°55′24″E | 19°44′59″N | 1395 | 3.008 | HF Probe | SCS | 2016.09 | (7) |
| 52 | SCS2016HF-09 | 114°59′15″E | 19°39′30″N | 1679 | 2.720 | HF Probe | SCS | 2016.09 | (7) |
| 53 | SCS2016HF-10 | 115°4′24″E | 19°35′3″N | 1738 | 2.651 | HF Probe | SCS | 2016.09 | (7) |
| 54 | SCS2016HF-11 | 115°6′32″E | 19°27′46″N | 1728 | 2.638 | HF Probe | SCS | 2016.09 | (7) |
| 55 | SCS2016HF-12 | 115°9′8″E | 19°19′46″N | 1718 | 2.658 | HF Probe | SCS | 2016.09 | (7) |
| 56 | 617sy | 113°55′12″E | 18°10′48″N | 2974 | 2.371 | HF Probe | SCS | 2008.06 | (8) |
| 57 | 621sy-1 | 112°51′36″E | 18°10′12″N | 2476 | 2.374 | HF Probe | SCS | 2008.06 | (8) |
| 58 | 621sy-2 | 112°51′36″E | 18°10′12″N | 2476 | 2.382 | HF Probe | SCS | 2008.06 | (8) |
| 59 | HF2-1 | 115°7′15″E | 19°56′25″N | 1225 | 3.490 | HF Probe | SCS | 2009.08-09 | (9) |
| 60 | HF2-2 | 115°8′13″E | 19°54′30″N | 1160 | 3.639 | HF Probe | SCS | 2009.08-09 | (9) |
| 61 | HF2-3 | 115°8′44″E | 19°52′55″N | 1200 | 4.512 | HF Probe | SCS | 2009.08-09 | (9) |
| 62 | HF2-4 | 115°10′12″E | 19°51′29″N | 1250 | 3.390 | HF Probe | SCS | 2009.08-09 | (9) |
| 63 | HF2-5 | 115°10′53″E | 19°50′10″N | 1400 | 2.941 | HF Probe | SCS | 2009.08-09 | (9) |
| 64 | HF2-6 | 115°11′46″E | 19°48′35″N | 1540 | 2.700 | HF Probe | SCS | 2009.08-09 | (9) |
| 65 | HF5-1 | 115°11′33″E | 19°54′18″N | 1250 | 3.342 | HF Probe | SCS | 2009.08-09 | (9) |
| 66 | HF5-2 | 115°12′9″E | 19°53′20″N | 1280 | 3.290 | HF Probe | SCS | 2009.08-09 | (9) |
| 67 | HF5-3 | 115°13′22″E | 19°51′30″N | 1320 | 3.101 | HF Probe | SCS | 2009.08-09 | (9) |
| 68 | HF5-4 | 115°14′8″E | 19°50′17″N | 1390 | 2.958 | HF Probe | SCS | 2009.08-09 | (9) |
| 69 | HF5-5 | 115°14′59″E | 19°49′3″N | 1500 | 2.814 | HF Probe | SCS | 2009.08-09 | (9) |
| 70 | HF5-6 | 115°16′2″E | 19°47′31″N | 1682 | 2.768 | HF Probe | SCS | 2009.08-09 | (9) |
| 71 | Hf0910 | 115°20′60″E | 19°25′48″N | 1500 | 2.450 | HF Probe | SCS | 2009.08-09 | (9) |
| 72 | ZS01 | - | - | 1150 | 3.959 | HF Probe | SCS | 2009.08-09 | (9)* |
| 73 | ZS02 | - | - | 1830 | 2.534 | HF Probe | SCS | 2009.08-09 | (9)* |
| 74 | ZS03 | - | - | 2040 | 2.452 | HF Probe | SCS | 2009.08-09 | (9)* |
| 75 | ZS04 | - | - | 2930 | 2.341 | HF Probe | SCS | 2009.08-09 | (9)* |
| 76 | ZS05 | - | - | 2938 | 2.356 | HF Probe | SCS | 2009.08-09 | (9)* |
| 77 | ZS06 | - | - | 3010 | 2.344 | HF Probe | SCS | 2009.08-09 | (9)* |
| 78 | ZS07 | - | - | 3030 | 2.350 | HF Probe | SCS | 2009.08-09 | (9)* |
| 79 | ZS08 | - | - | 3170 | 2.427 | HF Probe | SCS | 2009.08-09 | (9)* |
| 80 | ZS09 | - | - | 3420 | 2.377 | HF Probe | SCS | 2009.08-09 | (9)* |
| 81 | ZS10 | - | - | 3540 | 2.365 | HF Probe | SCS | 2009.08-09 | (9)* |
| 82 | ZS11 | - | - | 3616 | 2.362 | HF Probe | SCS | 2009.08-09 | (9)* |
| 83 | ZS12 | - | - | 3623 | 2.363 | HF Probe | SCS | 2009.08-09 | (9)* |
| 84 | ZS13 | - | - | 3630 | 2.400 | HF Probe | SCS | 2009.08-09 | (9)* |
| 85 | ZS14 | - | - | 3640 | 2.382 | HF Probe | SCS | 2009.08-09 | (9)* |
| 86 | ZS15 | - | - | 3720 | 2.375 | HF Probe | SCS | 2009.08-09 | (9)* |
| 87 | ZS16 | - | - | 3740 | 2.378 | HF Probe | SCS | 2009.08-09 | (9)* |
| 88 | ZS17 | - | - | 3780 | 2.389 | HF Probe | SCS | 2009.08-09 | (9)* |
| 89 | ZS18 | - | - | 3800 | 2.402 | HF Probe | SCS | 2009.08-09 | (9)* |
| 90 | ZS19 | - | - | 3802 | 2.383 | HF Probe | SCS | 2009.08-09 | (9)* |
| 91 | ZS20 | - | - | 3843 | 2.566 | HF Probe | SCS | 2009.08-09 | (9)* |
| 92 | ZS21 | - | - | 3870 | 2.410 | HF Probe | SCS | 2009.08-09 | (9)* |
| 93 | ZS22 | - | - | 3880 | 2.389 | HF Probe | SCS | 2009.08-09 | (9)* |
| 94 | ZS23 | - | - | 3880 | 2.412 | HF Probe | SCS | 2009.08-09 | (9)* |
| 95 | ZS24 | - | - | 3900 | 2.525 | HF Probe | SCS | 2009.08-09 | (9)* |
| 96 | ZS25 | - | - | 3917 | 2.543 | HF Probe | SCS | 2009.08-09 | (9)* |
| 97 | ZS26 | - | - | 3930 | 2.565 | HF Probe | SCS | 2009.08-09 | (9)* |
| 98 | ZS27 | - | - | 3937 | 2.528 | HF Probe | SCS | 2009.08-09 | (9)* |
| 99 | ZS28 | - | - | 3939 | 2.538 | HF Probe | SCS | 2009.08-09 | (9)* |
| 100 | ZS29 | - | - | 3947 | 2.562 | HF Probe | SCS | 2009.08-09 | (9)* |
| 101 | ZS30 | - | - | 3964 | 2.539 | HF Probe | SCS | 2009.08-09 | (9)* |
| 102 | ZS31 | - | - | 3967 | 2.540 | HF Probe | SCS | 2009.08-09 | (9)* |
| 103 | ZS32 | - | - | 3980 | 2.563 | HF Probe | SCS | 2009.08-09 | (9)* |
| 104 | ZS33 | - | - | 4006 | 2.544 | HF Probe | SCS | 2009.08-09 | (9)* |
| 105 | ZS34 | - | - | 4020 | 2.420 | HF Probe | SCS | 2009.08-09 | (9)* |
| 106 | ZS35 | - | - | 4038 | 2.546 | HF Probe | SCS | 2009.08-09 | (9)* |
| 107 | ZS36 | - | - | 4040 | 2.427 | HF Probe | SCS | 2009.08-09 | (9)* |
| 108 | ZS37 | - | - | 4046 | 2.553 | HF Probe | SCS | 2009.08-09 | (9)* |
| 109 | ZS38 | - | - | 4050 | 2.413 | HF Probe | SCS | 2009.08-09 | (9)* |
| 110 | ZS39 | - | - | 4057 | 2.551 | HF Probe | SCS | 2009.08-09 | (9)* |
| 111 | ZS40 | - | - | 4102 | 2.527 | HF Probe | SCS | 2009.08-09 | (9)* |
| 112 | ZS41 | - | - | 4170 | 2.395 | HF Probe | SCS | 2009.08-09 | (9)* |
| 113 | IODP349-U1431D | 117°0′0″E | 15°22′32″N | 4241 | 2.500 | IODP | SCS | 2014.02-03 | (Expedition 349 Scientists, 2014) |
| 114 | IODP349-U1432C | 116°23′27″E | 18°21′5″N | 3829 | 2.400 | IODP | SCS | 2014.02-03 | (Expedition 349 Scientists, 2014) |
| 115 | IODP349-U1433A | 115°2′50″E | 12°55′8″N | 4379 | 2.500 | IODP | SCS | 2014.02-03 | (Expedition 349 Scientists, 2014) |
| 116 | 630ht1b | 119°39′9″E | 22°19′0″N | 2006 | 2.792 | HF Probe | SCS | 2001.11 | (Shyu et al, 2006) |
| 117 | 630ht2 | 119°29′11″E | 22°10′25″N | 2006 | 2.576 | HF Probe | SCS | 2001.11 | (Shyu et al, 2006) |
| 118 | 630ht4 | 119°48′26″E | 22°9′43″N | 1307 | 3.093 | HF Probe | SCS | 2001.11 | (Shyu et al, 2006) |
| 119 | 630ht7 | 120°6′39″E | 21°57′4″N | 1469 | 3.023 | HF Probe | SCS | 2001.11 | (Shyu et al, 2006) |
| 120 | 630ht8 | 120°3′44″E | 21°57′3″N | 1341 | 3.037 | HF Probe | SCS | 2001.11 | (Shyu et al, 2006) |
| 121 | 698ht07 | 119°30′0″E | 21°47′24″N | 2756 | 3.036 | HF Probe | SCS | 2003.01 | (Shyu et al, 2006) |
| 122 | 680ht9-1 | 119°40′13″E | 21°44′55″N | 2908 | 2.229 | HF Probe | SCS | 2003.05 | (Shyu et al, 2006) |
| 123 | 680ht11 | 119°58′6″E | 21°50′48″N | 1730 | 2.387 | HF Probe | SCS | 2003.05 | (Shyu et al, 2006) |
| 124 | 680ht12 | 120°5′14″E | 21°53′11″N | 1663 | 2.541 | HF Probe | SCS | 2003.05 | (Shyu et al, 2006) |
| 125 | 680ht14 | 120°23′36″E | 21°59′32″N | 954 | 4.608 | HF Probe | SCS | 2003.05 | (Shyu et al, 2006) |
| 126 | 680ht19 | 119°53′59″E | 21°38′24″N | 3107 | 2.382 | HF Probe | SCS | 2003.05 | (Shyu et al, 2006) |
| 127 | 698ht30 | 119°20′20″E | 21°43′49″N | 2839 | 2.940 | HF Probe | SCS | 2003.01 | (Shyu et al, 2006) |
| 128 | 698ht41 | 119°33′44″E | 21°43′8″N | 2780 | 2.987 | HF Probe | SCS | 2003.01 | (Shyu et al, 2006) |
| 129 | 698ht44 | 119°54′43″E | 21°42′37″N | 2906 | 2.996 | HF Probe | SCS | 2003.01 | (Shyu et al, 2006) |
| 130 | 714ht2 | 119°58′49″E | 22°14′23″N | 948 | 4.462 | HF Probe | SCS | 2004.04 | (Shyu et al, 2006) |
| 131 | 714ht4 | 119°48′37″E | 22°5′27″N | 1660 | 2.632 | HF Probe | SCS | 2004.04 | (Shyu et al, 2006) |
| 132 | 714ht10 | 119°49′9″E | 21°47′41″N | 2477 | 2.356 | HF Probe | SCS | 2004.04 | (Shyu et al, 2006) |
| 133 | 714ht18 | 120°3′36″E | 21°41′33″N | 2781 | 2.371 | HF Probe | SCS | 2004.04 | (Shyu et al, 2006) |
| 134 | 714htg21 | 119°52′53″E | 22°15′12″N | 1312 | 3.355 | HF Probe | SCS | 2004.04 | (Shyu et al, 2006) |
| 135 | 714ht46 | 120°33′13″E | 21°31′6″N | 1799 | 2.583 | HF Probe | SCS | 2004.04 | (Shyu et al, 2006) |
| 136 | 714ht49 | 120°9′49″E | 21°27′16″N | 2887 | 2.355 | HF Probe | SCS | 2004.04 | (Shyu et al, 2006) |
| 137 | 714ht50 | 120°3′1″E | 21°26′3″N | 2884 | 2.349 | HF Probe | SCS | 2004.04 | (Shyu et al, 2006) |
| 138 | 714ht53 | 119°43′5″E | 21°22′51″N | 3209 | 2.453 | HF Probe | SCS | 2004.04 | (Shyu et al, 2006) |
| 139 | NS01 | - | - | 1602 | 2.800 | HF Probe | SCS | 2014.06 | * |
| 140 | NS02 | - | - | 2836 | 2.563 | HF Probe | SCS | 2014.06 | * |
| 141 | NS03 | - | - | 2469 | 2.554 | HF Probe | SCS | 2014.06 | * |
| 142 | NS04 | - | - | 1642 | 2.778 | HF Probe | SCS | 2014.06 | * |
| 143 | NS05 | - | - | 2275 | 2.582 | HF Probe | SCS | 2014.06 | * |
| 144 | NS06 | - | - | 1554 | 2.876 | HF Probe | SCS | 2014.06 | * |
| 145 | NS07 | - | - | 1987 | 2.581 | HF Probe | SCS | 2014.06 | * |
| 146 | NS08 | - | - | 1726 | 2.721 | HF Probe | SCS | 2014.06 | * |
| 147 | NS09 | - | - | 1888 | 2.665 | HF Probe | SCS | 2014.06 | * |
| 148 | NS10 | - | - | 908 | 5.096 | HF Probe | SCS | 2014.06 | * |
| 149 | NS11 | - | - | 4359 | 2.507 | HF Probe | SCS | 2014.06 | * |
| 150 | NS12 | - | - | 3017 | 2.370 | HF Probe | SCS | 2014.06 | * |
| 151 | NS13 | - | - | 1481 | 3.028 | HF Probe | SCS | 2014.06 | * |
| 152 | NS14 | - | - | 1755 | 2.672 | HF Probe | SCS | 2014.06 | * |
| 153 | NS15 | - | - | 1761 | 2.667 | HF Probe | SCS | 2014.06 | * |
| 154 | NS16 | - | - | 2100 | 2.550 | HF Probe | SCS | 2014.06 | * |
| 155 | NS17 | - | - | 1709 | 2.786 | HF Probe | SCS | 2014.06 | * |
| 156 | NS18 | - | - | 1715 | 2.698 | HF Probe | SCS | 2014.06 | * |
| 157 | NS19 | - | - | 1227 | 3.478 | HF Probe | SCS | 2014.06 | * |
| 158 | NS20 | - | - | 2906 | 2.567 | HF Probe | SCS | 2014.06 | * |
| 159 | Ind2010HF01a | 91°0′21″E | 10°0′44″N | 3460 | 1.373 | HF Probe | EIO | 2010.04 | (10) |
| 160 | Ind2010HF01b | 91°0′18″E | 10°0′34″N | 3460 | 1.373 | HF Probe | EIO | 2010.04 | (10) |
| 161 | Ind2010HF02 | 90°39′25″E | 10°0′5″N | 3360 | 1.362 | HF Probe | EIO | 2010.04 | (10) |
| 162 | Ind2010HF04 | 89°59′49″E | 10°0′16″N | 3303 | 1.335 | HF Probe | EIO | 2010.04 | (10) |
| 163 | Ind2010HF05 | 89°29′14″E | 10°0′6″N | 3340 | 1.452 | HF Probe | EIO | 2010.04 | (10) |
| 164 | Ind2010HF06 | 89°0′2″E | 10°0′19″N | 3368 | 1.491 | HF Probe | EIO | 2010.04 | (10) |
| 165 | Ind2010HF07a | 88°29′20″E | 9°59′44″N | 3400 | 1.479 | HF Probe | EIO | 2010.04 | (10) |
| 166 | Ind2010HF07b | 88°29′13″E | 9°59′48″N | 3400 | 1.478 | HF Probe | EIO | 2010.04 | (10) |
| 167 | Ind2010HF07c | 88°29′8″E | 9°59′54″N | 3400 | 1.477 | HF Probe | EIO | 2010.04 | (10) |
| 168 | Ind2010HF08 | 87°59′43″E | 9°59′16″N | 3412 | 1.486 | HF Probe | EIO | 2010.04 | (10) |
| 169 | Ind2010HF09 | 86°57′13″E | 10°2′60″N | 3472 | 1.484 | HF Probe | EIO | 2010.04 | (10) |
| 170 | Ind2013HF01 | 98°29′54″E | 6°59′47″S | 4852 | 1.143 | HF Probe | EIO | 2013.04 | (11) |
| 171 | Ind2013HF02 | 97°46′3″E | 6°1′11″S | 5725 | 1.252 | HF Probe | EIO | 2013.04 | (11) |
| 172 | Ind2013HF04 | 95°19′3″E | 2°57′26″S | 4810 | 1.150 | HF Probe | EIO | 2013.04 | (11) |
| 173 | Ind2013HF05 | 94°20′11″E | 1°25′32″S | 4617 | 1.144 | HF Probe | EIO | 2013.04 | (11) |
| 174 | Ind2013HF06 | 93°48′53″E | 0°27′53″S | 4527 | 1.151 | HF Probe | EIO | 2013.04 | (11) |
| 175 | Ind2013HF07 | 90°57′19″E | 0°0′30″N | 4532 | 1.149 | HF Probe | EIO | 2013.04 | (11) |
| 176 | 49MR03K04_5_I03-458 | 107°30′20″E | 20°0′2″S | 5391 | 1.187 | CTD | EIO | 2004.01 | (12)† |
| 177 | 49MR03K04_5_I03-459 | 106°37′29″E | 19°59′46″S | 5527 | 1.187 | CTD | EIO | 2004.01 | (12)† |
| 178 | 49MR03K04_5_I03-460 | 105°45′30″E | 19°59′34″S | 5305 | 1.151 | CTD | EIO | 2004.01 | (12)† |
| 179 | 49MR03K04_5_I03-462 | 104°0′37″E | 19°59′40″S | 5479 | 1.196 | CTD | EIO | 2004.01 | (12)† |
| 180 | 49MR03K04_5_I03-464 | 102°14′34″E | 19°59′50″S | 6052 | 1.237 | CTD | EIO | 2004.01 | (12)† |
| 181 | 49MR03K04_5_I03-468 | 98°42′58″E | 19°59′59″S | 6305 | 1.258 | CTD | EIO | 2004.01 | (12)† |
| 182 | 49MR03K04_5_I03-470 | 96°57′12″E | 19°59′28″S | 5339 | 1.124 | CTD | EIO | 2004.01 | (12)† |
| 183 | 49MR03K04_5_I03-473 | 94°18′29″E | 19°59′53″S | 5133 | 1.107 | CTD | EIO | 2004.01 | (12)† |
| 184 | 49MR03K04_5_I03-474 | 93°31′58″E | 19°59′28″S | 5325 | 1.143 | CTD | EIO | 2004.01 | (12)† |
| 185 | 49MR03K04_5_I03-475 | 92°48′16″E | 19°59′41″S | 5081 | 1.124 | CTD | EIO | 2004.01 | (12)† |
| 186 | 49MR03K04_5_I03-476 | 92°21′27″E | 19°59′48″S | 5130 | 1.123 | CTD | EIO | 2004.01 | (12)† |
| 187 | 49MR03K04_5_I03-477 | 91°48′54″E | 19°59′48″S | 5028 | 1.110 | CTD | EIO | 2004.01 | (12)† |
| 188 | 49MR03K04_5_I03-X09 | 95°0′44″E | 20°11′42″S | 5273 | 1.130 | CTD | EIO | 2004.01 | (12)† |
| 189 | KR09-16HF03A | 145°3′13″E | 39°0′5″N | 5510 | 1.557 | HF Probe | NWPO | 2009.11 | (13) |
| 190 | KR09-16HFPC01 | 145°14′55″E | 38°59′38″N | 5405 | 1.548 | HF Probe | NWPO | 2009.11 | (13) |
| 191 | KR09-16HFPC02 | 144°35′37″E | 38°4′54″N | 5750 | 1.591 | HF Probe | NWPO | 2009.11 | (13) |
| 192 | KR09-167KⅡ#461 | 145°40′24″E | 40°15′12″N | 5216 | 1.527 | CTD_ROV | NWPO | 2009.11 | (13) |
| 193 | KR09-167KⅡ#462 | 145°40′24″E | 40°15′12″N | 5216 | 1.525 | CTD_ROV | NWPO | 2009.11 | (13) |
| 194 | KR09-167KⅡ#463 | 144°35′45″E | 38°4′48″N | 5741 | 1.584 | CTD_ROV | NWPO | 2009.11 | (13) |
| 195 | IODP316-C0007A | 136°47′57″E | 33°1′14″N | 4081 | 1.650 | IODP | WPO | 2007.09-2008.02 | (Kimura et al, 2008) |
| 196 | IODP332-C0010A | 136°41′12″E | 32°12′36″N | 2552 | 1.700 | IODP | WPO | 2010.10-12 | (Kopf et al, 2011) |
| 197 | IODP337-C0020A | 142°12′2″E | 41°10′36″N | 1180 | 3.600 | IODP | NWPO | 2012.07-09 | (Inagaki et al, 2012) |
| 198 | IODP343-C0022D | 143°54′48″E | 37°56′19″N | 6898 | 1.700 | IODP | NWPO | 2012.04-05 | (Chester et al, 2012) |
| 199 | HPD0940HDDB103 | 139°13′0″E | 35°4′60″N | 920 | 3.675 | ROV | WPO | 2008.12.23 | (14)‡ |
| 200 | KAIKO0647C2HDF101 | 153°15′13″E | 22°38′59″N | 4055 | 1.470 | ROV | WPO | 2015.02.07 | (15)‡ |
| 201 | KAIKO0648C2HDF101 | 135°6′39″E | 19°19′26″N | 5682 | 1.755 | ROV | WPO | 2015.02.23 | (16)‡ |
| 202 | KAIKO0650C2HDF102 | 134°56′42″E | 32°21′13″N | 4665 | 1.642 | ROV | WPO | 2015.03.04 | (17)‡ |
| 203 | MT2016-P1 | 142°42′34″E | 10°42′51″N | 5441 | 1.528 | OBS | WPO | 2016.11-12 | (18) |
| 204 | MT2016-P2 | 142°37′11″E | 10°48′59″N | 5693 | 1.560 | OBS | WPO | 2016.11-12 | (18) |
| 205 | MT2016-P4 | 142°26′24″E | 11°1′14″N | 7015 | 1.758 | OBS | WPO | 2016.11-12 | (18) |
| 206 | MT2016-P6 | 142°2′30″E | 11°28′33″N | 7520 | 1.830 | OBS | WPO | 2016.11-12 | (18) |
| 207 | MT2016-P7 | 141°57′7″E | 11°34′41″N | 6114 | 1.664 | OBS | WPO | 2016.11-12 | (18) |
| 208 | MT2016-P8 | 141°51′44″E | 11°40′49″N | 5337 | 1.530 | OBS | WPO | 2016.11-12 | (18) |
| 209 | MT2016-P9 | 141°46′21″E | 11°46′58″N | 4567 | 1.520 | OBS | WPO | 2016.11-12 | (18) |
| 210 | MT2016-P10 | 141°40′57″E | 11°53′6″N | 2667 | 1.593 | OBS | WPO | 2016.11-12 | (18) |
| 211 | MT2016-P11 | 141°35′33″E | 11°59′14″N | 1665 | 2.197 | OBS | WPO | 2016.11-12 | (18) |
| 212 | MT2016-P13 | 141°24′45″E | 12°11′30″N | 4171 | 1.591 | OBS | WPO | 2016.11-12 | (18) |
| 213 | MT2016-P14 | 141°19′20″E | 12°17′37″N | 5526 | 1.691 | OBS | WPO | 2016.11-12 | (18) |
| 214 | MT2016-P17 | 141°3′5″E | 12°35′60″N | 2724 | 1.697 | OBS | WPO | 2016.11-12 | (18) |
| 215 | MT2016-PA05 | 141°29′59″E | 12°33′2″N | 3223 | 1.647 | OBS | WPO | 2016.11-12 | (18) |
| 216 | MT2016-PA06 | 141°45′39″E | 12°14′3″N | 2121 | 2.017 | OBS | WPO | 2016.11-12 | (18) |
| 217 | MT2016-PA07 | 142°1′27″E | 11°56′8″N | 4889 | 1.502 | OBS | WPO | 2016.11-12 | (18) |
| 218 | MT2016-PA08 | 141°35′26″E | 11°33′59″N | 5582 | 1.569 | OBS | WPO | 2016.11-12 | (18) |
| 219 | MT2016-PA09 | 141°16′22″E | 11°55′57″N | 3839 | 1.535 | OBS | WPO | 2016.11-12 | (18) |
| 220 | MT2016-PA10 | 140°57′14″E | 12°16′14″N | 3521 | 1.574 | OBS | WPO | 2016.11-12 | (18) |
| 221 | MT2016-PA11 | 140°55′51″E | 11°58′20″N | 4205 | 1.520 | OBS | WPO | 2016.11-12 | (18) |
| 222 | WPO-CTD-02 | - | - | 1736 | 2.411 | CTD | WPO | 2015.06 | * |
| 223 | WPO-CTD-03 | - | - | 1527 | 2.776 | CTD | WPO | 2015.06 | * |
| 224 | WPO-CTD-04 | - | - | 1771 | 2.345 | CTD | WPO | 2015.06 | * |
| 225 | WPO-CTD-05 | - | - | 2084 | 1.969 | CTD | WPO | 2015.06 | * |
Notes: The abbreviations of SCS, EIO, NWPO and WPO represent the South China Sea, eastern Indian Ocean, the northwestern Pacific Ocean and western Pacific Ocean, respectively. In this paper, most of the BWT data were measured by the Heat Flow Probe (HF Probe), Conductivity-Temperature-Depth Profiler (CTD); the others were obtained by mounting the Miniaturized Temperature Unit (MTU) on the Ocean Bottom Seismometer (OBS), Sediments Box Core (SBC), Sediments Trap (ST), and Remotely Operated Vehicles (ROV). The abbreviation of CTD_ROV means that the CTD is mounted on the ROV. (1) 2010SCS-Open cruise: 2010 South China Sea Open Cruise by R/V Shiyan 3, South China Sea Institute of Oceanology, CAS; (2) 2012NSFC-SCS cruise: 2012 NSFC Sharing Research Cruise in South China Sea by R/V Shiyan 3, South China Sea Institute of Oceanology, CAS; (3) 2013NSFC-SCS cruise: 2013 NSFC Sharing Research Cruise in South China Sea by R/V Shiyan 2, South China Sea Institute of Oceanology, CAS; (4) 2014NSFC-SCS cruise: 2014 NSFC Sharing Research Cruise in South China Sea by R/V Shiyan 2, South China Sea Institute of Oceanology, CAS; (5) 2015NSFC-SCS cruise: 2015 NSFC Sharing Research Cruise in South China Sea by R/V Shiyan 3, South China Sea Institute of Oceanology, CAS; (6) 2016SCS cruise: 2016 Research Cruise in South China Sea by R/V Haidiao 6, South China Sea Institute of Oceanology, CAS; (7) 2016NSFC-SCS cruise: 2016 NSFC Sharing Research Cruise in South China Sea by R/V Shiyan 3, South China Sea Institute of Oceanology, CAS; (8) HY4-2008-3 cruise of R/V Haiyang 4 of Guangzhou Marine Geological Survey; (9) HY4-2009-4 cruise of R/V Haiyang 4 of Guangzhou Marine Geological Survey; (10) 2010SCSIO-IndOcean cruise: 2010 Sharing Research Cruise in Indian Ocean by R/V Shiyan 1, South China Sea Institute of Oceanology, CAS; (11) 2013NSFC-IndOcean cruise: 2013 NSFC Sharing Research Cruise in Indian Ocean by R/V Shiyan 1, South China Sea Institute of ceanology, CAS; (12) MR03-K04 leg 5 Cruise: 2003 Research Cruise in Japan Trench by R/V Mirai, Japan Agency for Marine-Earth Science and Technology (JAMSTEC), occupied stations along 20°S from 48°55’ E to 113°46’ E (Tamatave to Fremantle via Port Louise); (13) KR09-16 Cruise: 2009 Research Cruise in Japan Trench by R/V Kairei (with ROV Kaiko 7000II), Japan Agency for Marine-Earth Science and Technology (JAMSTEC); (14) NT08-25 Cruise: 2008 Research Cruise in the Sagami Bay, off-Hatsushima by R/V NATSUSHIMA (with ROV HYPER-DOLPHIN), JAMSTEC; (15) KR15-E01 Cruise: 2015 Research Cruise in Takuyo-Daigo Seamount by R/V Kairei (with ROV Kaiko 7000II), JAMSTEC; (16) KR15-03 Cruise: 2015 Research Cruise in West Philippine Basin by R/V Kairei (with ROV Kaiko 7000II), JAMSTEC; (17) KR15-04 Cruise: 2015 Research Cruise in Nankai Trough by R/V Kairei (with ROV Kaiko 7000II), JAMSTEC; (18) 2016 Mariana Cruise: 2016 Expedition to the Mariana Trench by R/V Shiyan 3, South China Sea Institute of Oceanology, CAS. * The location information of these stations is still not released to the public according the Data Management Policy; † These data were collected from the Carbon Hydro-graphic Data Office website (https://cchdo.ucsd.edu/); ‡ These data were collected from the Data and Sample Research System for Whole Cruise Information in JAMSTEC (http://www.godac.jamstec.go.jp/darwin/e/). |
The authors have declared that no competing interests exist.
| [1] |
|
| [2] |
|
| [3] |
EXPEDITION 349 SCIENTISTS, 2014. South China Sea tectonics: opening of the South China Sea and its implications for southeast Asian tectonics, climates, and deep mantle processes since the late Mesozoic [R] //Integrated Ocean Drilling Program Management International, Inc. International Ocean Discovery Program Preliminary Report, 349. http://dx.doi.org/ 10.14379/iodp.pr.349.2014.
|
| [4] |
|
| [5] |
|
| [6] |
|
| [7] |
|
| [8] |
|
| [9] |
|
| [10] |
|
| [11] |
|
| [12] |
|
| [13] |
|
| [14] |
|
| [15] |
|
| [16] |
|
| [17] |
|
| [18] |
|
| [19] |
|
| [20] |
|
| [21] |
|
| [22] |
|
| [23] |
|
| [24] |
|
| [25] |
|
| [26] |
|
| [27] |
|
/
| 〈 |
|
〉 |
